Zoom and Pan with React Chart multiple Modifiers
Demonstrates different Zoom and Pan Modifiers on a React Chart including Mousewheel, Pinchzoom, Rubber-band zoom.
drawExample.ts
index.tsx
ExampleDataProvider.ts
theme.ts
1import { appTheme } from "../../../theme";
2import { ExampleDataProvider } from "../../../ExampleData/ExampleDataProvider";
3
4import {
5    easing,
6    EHorizontalAnchorPoint,
7    EllipsePointMarker,
8    ENumericFormat,
9    EVerticalAnchorPoint,
10    FastLineRenderableSeries,
11    MouseWheelZoomModifier,
12    NumberRange,
13    NumericAxis,
14    PinchZoomModifier,
15    RubberBandXyZoomModifier,
16    SciChartSurface,
17    XyDataSeries,
18    ZoomExtentsModifier,
19    ZoomPanModifier,
20    EExecuteOn,
21    TextAnnotation,
22    ECoordinateMode,
23    NativeTextAnnotation,
24    EWrapTo,
25} from "scichart";
26
27export const drawExample = async (rootElement: string | HTMLDivElement) => {
28    // Create a SciChartSurface with X,Y Axis
29    const { sciChartSurface, wasmContext } = await SciChartSurface.create(rootElement, {
30        theme: appTheme.SciChartJsTheme,
31    });
32
33    sciChartSurface.xAxes.add(
34        new NumericAxis(wasmContext, {
35            growBy: new NumberRange(0.05, 0.05),
36            labelFormat: ENumericFormat.Decimal,
37            labelPrecision: 4,
38        })
39    );
40
41    sciChartSurface.yAxes.add(
42        new NumericAxis(wasmContext, {
43            growBy: new NumberRange(0.1, 0.1),
44            labelFormat: ENumericFormat.Decimal,
45            labelPrecision: 4,
46        })
47    );
48
49    // Add some data
50    const data1 = ExampleDataProvider.getFourierSeriesZoomed(0.6, 0.13, 5.0, 5.15);
51    const lineSeries0 = new FastLineRenderableSeries(wasmContext, {
52        dataSeries: new XyDataSeries(wasmContext, {
53            xValues: data1.xValues,
54            yValues: data1.yValues,
55            dataSeriesName: "First Line Series",
56        }),
57        strokeThickness: 3,
58        stroke: appTheme.VividSkyBlue,
59        pointMarker: new EllipsePointMarker(wasmContext, {
60            width: 7,
61            height: 7,
62            strokeThickness: 0,
63            fill: appTheme.VividSkyBlue,
64        }),
65    });
66    sciChartSurface.renderableSeries.add(lineSeries0);
67
68    const data2 = ExampleDataProvider.getFourierSeriesZoomed(0.5, 0.12, 5.0, 5.15);
69    const lineSeries1 = new FastLineRenderableSeries(wasmContext, {
70        dataSeries: new XyDataSeries(wasmContext, {
71            xValues: data2.xValues,
72            yValues: data2.yValues,
73            dataSeriesName: "Second Line Series",
74        }),
75        strokeThickness: 3,
76        stroke: appTheme.VividOrange,
77        pointMarker: new EllipsePointMarker(wasmContext, {
78            width: 7,
79            height: 7,
80            strokeThickness: 0,
81            fill: appTheme.VividOrange,
82        }),
83    });
84    sciChartSurface.renderableSeries.add(lineSeries1);
85
86    const data3 = ExampleDataProvider.getFourierSeriesZoomed(0.4, 0.11, 5.0, 5.15);
87    const lineSeries2 = new FastLineRenderableSeries(wasmContext, {
88        dataSeries: new XyDataSeries(wasmContext, {
89            xValues: data3.xValues,
90            yValues: data3.yValues,
91            dataSeriesName: "Third Line Series",
92        }),
93        strokeThickness: 3,
94        stroke: appTheme.MutedPink,
95        pointMarker: new EllipsePointMarker(wasmContext, {
96            width: 7,
97            height: 7,
98            strokeThickness: 0,
99            fill: appTheme.MutedPink,
100        }),
101    });
102    sciChartSurface.renderableSeries.add(lineSeries2);
103
104    // Here is where we add the zoom, pan behaviour
105    sciChartSurface.chartModifiers.add(
106        // use RubberBandXyZoomModifier with Right Mouse Button
107        // use easingFunction to animate zoom
108        new RubberBandXyZoomModifier({ executeOn: EExecuteOn.MouseRightButton, easingFunction: easing.elastic }),
109        // enable pan withZoomPanModifier, and additionally e PinchZoom to allow zooming with pinch gesture on touch devices by setting enableZoom
110        new ZoomPanModifier({ enableZoom: true }),
111        new MouseWheelZoomModifier(),
112        // remark: PinchZoom functionality was included into ZoomPanModifier.
113        // if having any conflicts, check the value of modifier.enableZoom
114        // new PinchZoomModifier(),
115        // Zoom extents on double click
116        new ZoomExtentsModifier({ easingFunction: easing.elastic })
117    );
118
119    // Add annotations to tell the user what to do
120    sciChartSurface.annotations.add(
121        new TextAnnotation({
122            text: "Zoom Pan Modifiers Demo",
123            x1: 0.5,
124            y1: 0.5,
125            yCoordShift: -50,
126            xCoordinateMode: ECoordinateMode.Relative,
127            yCoordinateMode: ECoordinateMode.Relative,
128            horizontalAnchorPoint: EHorizontalAnchorPoint.Center,
129            verticalAnchorPoint: EVerticalAnchorPoint.Center,
130            opacity: 0.33,
131            fontSize: 48,
132            fontWeight: "Bold",
133        })
134    );
135    sciChartSurface.annotations.add(
136        new TextAnnotation({
137            text: "Multiple zoom, pan behaviours enabled on a single chart",
138            x1: 0.5,
139            y1: 0.5,
140            yCoordShift: 0,
141            xCoordinateMode: ECoordinateMode.Relative,
142            yCoordinateMode: ECoordinateMode.Relative,
143            horizontalAnchorPoint: EHorizontalAnchorPoint.Center,
144            verticalAnchorPoint: EVerticalAnchorPoint.Center,
145            opacity: 0.38,
146            fontSize: 20,
147        })
148    );
149    sciChartSurface.annotations.add(
150        new NativeTextAnnotation({
151            text: "Try mouse-wheel, left/right mouse drag, mousewheel on axis, pinch zoom, double-click to zoom to fit etc...",
152            x1: 0.5,
153            y1: 0.6,
154            xCoordinateMode: ECoordinateMode.Relative,
155            yCoordinateMode: ECoordinateMode.Relative,
156            horizontalAnchorPoint: EHorizontalAnchorPoint.Center,
157            verticalAnchorPoint: EVerticalAnchorPoint.Center,
158            opacity: 0.45,
159            fontSize: 17,
160            wrapTo: EWrapTo.ViewRect,
161        })
162    );
163    return { wasmContext, sciChartSurface };
164};
165
See Also: Zoom and Pan a Chart (6 Demos)
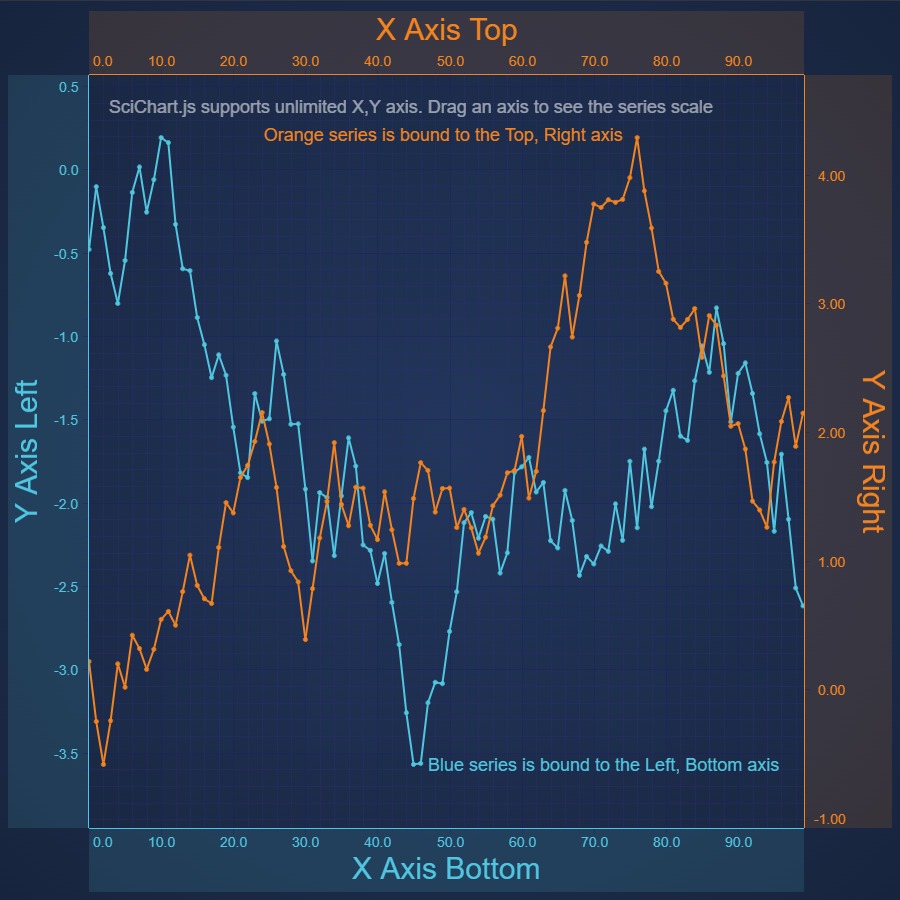
React Chart with Multiple X Axes
Demonstrates Multiple X & Y Axis on a React Chart using SciChart.js. SciChart supports unlimited left, right, top, bottom X, Y axis with configurable alignment and individual zooming, panning
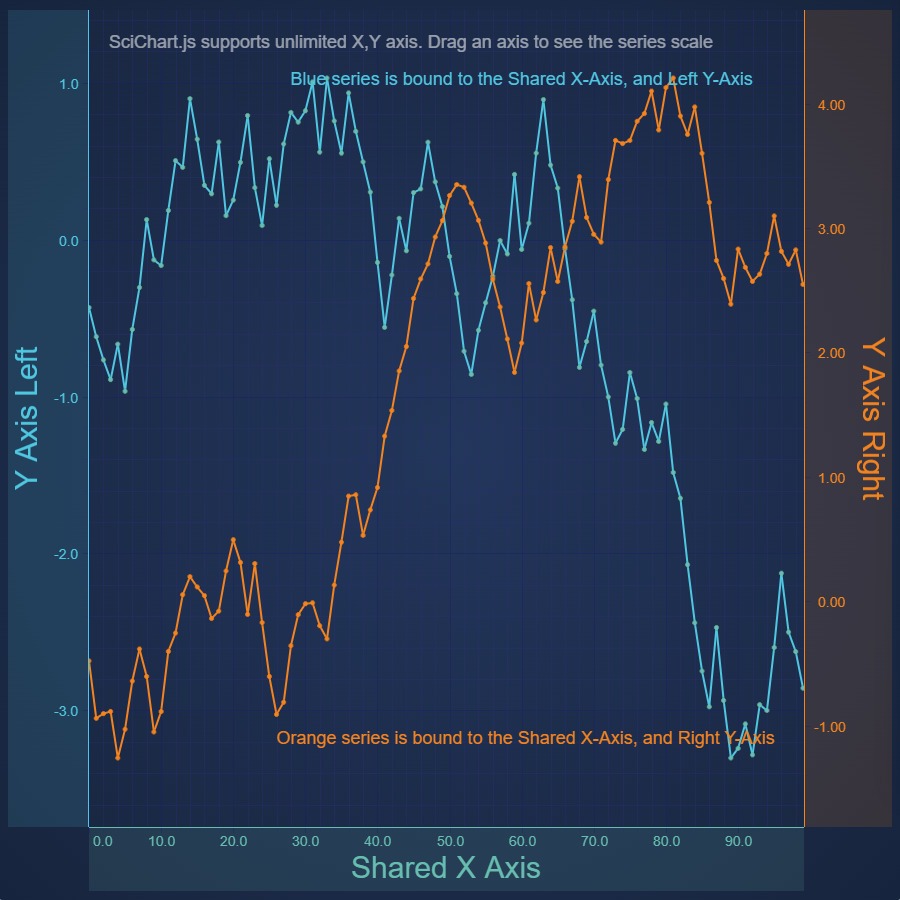
React Chart with Secondary Y Axes
Demonstrates Secondary Y Axis on a React Chart using SciChart.js. SciChart supports unlimited, multiple left, right, top, bottom X, Y axis with configurable alignment and individual zooming, panning
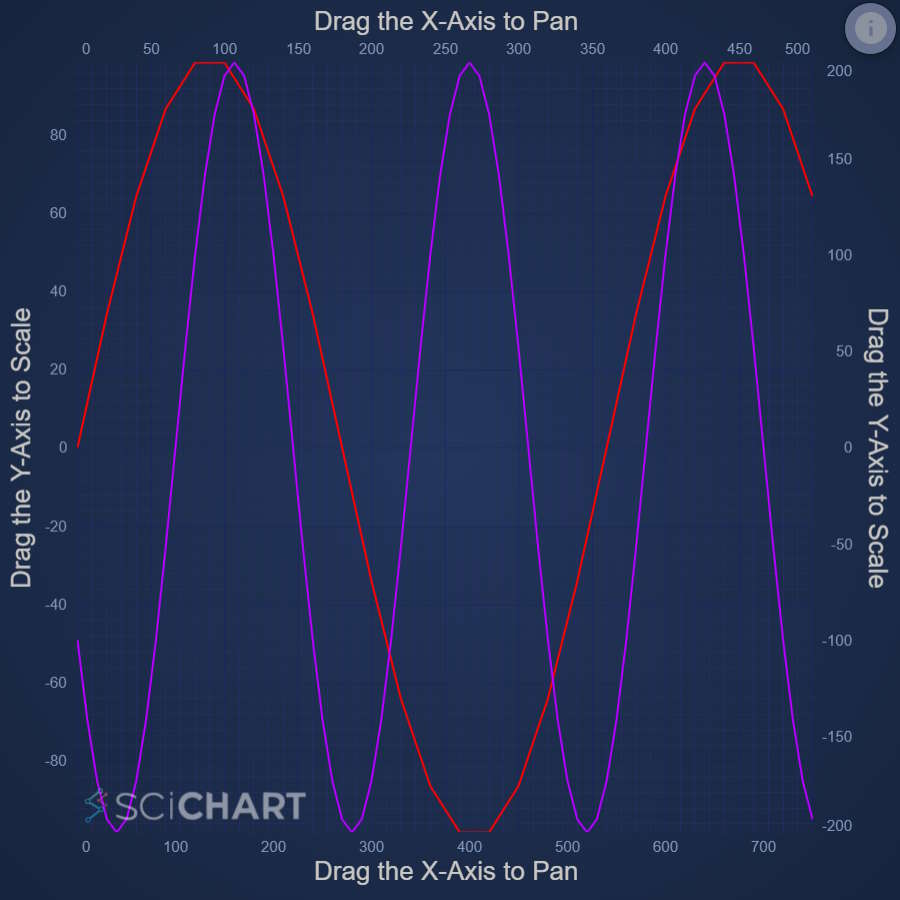
Drag React Chart Axis to Scale or Pan
Demonstrates how to Zoom, Scale or Pan individual Axis on a React Chart with SciChart.js AxisDragModifiers

Zoom and Pan a Realtime React Chart
Demonstrates how to zoom and pan a realtime React Chart while it is updating, with SciChart.js ZoomState API
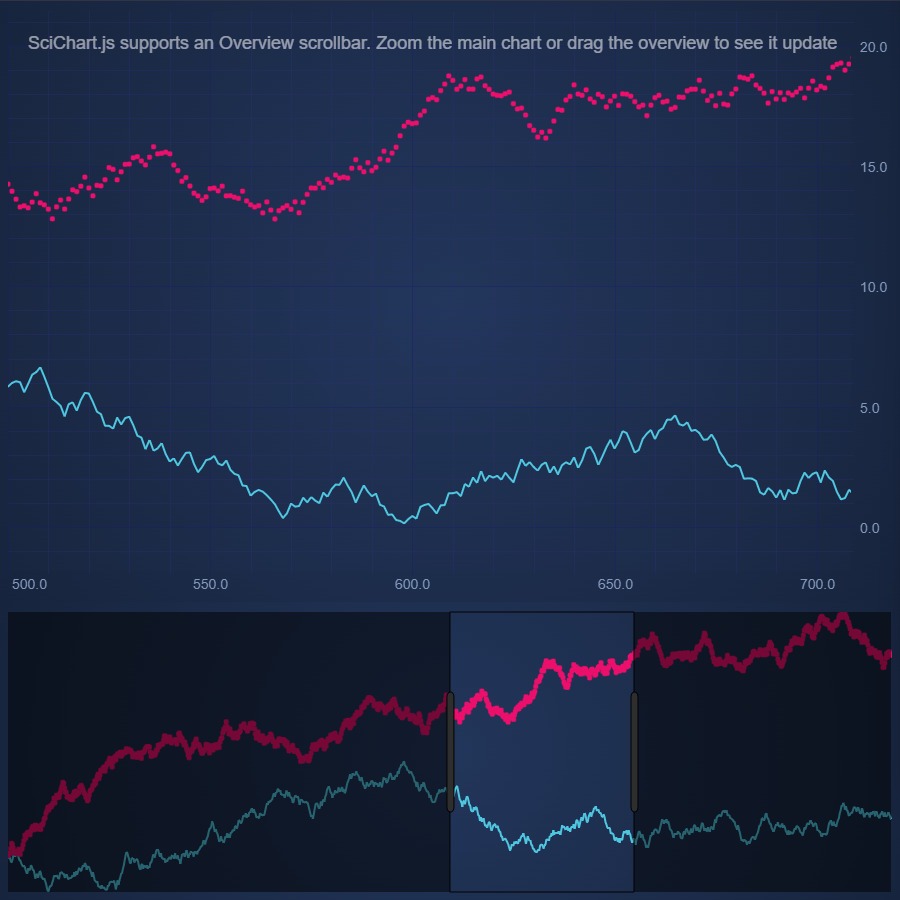
Zoom and Pan with Overview Chart
Demonstrates how to zoom and pan with an Overview Chart
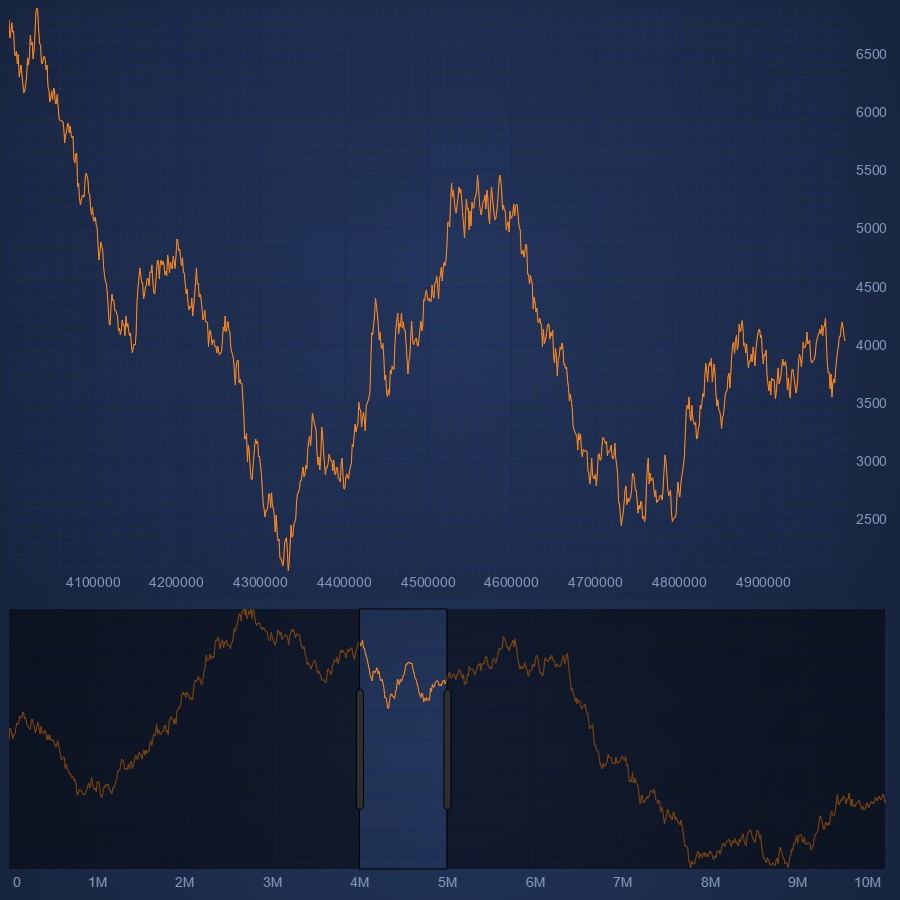
Virtualized React Charts: Load Data on Zoom/Pan
shows how to load data on zoom/pan and how to create an overview chart for this case.