SciChart.js Demo
The SciChart.js Demo app is where we host our showcases and demos for SciChart's JavaScript Chart Library
Featured Apps: Performance Demos & Showcases (12 Demos)
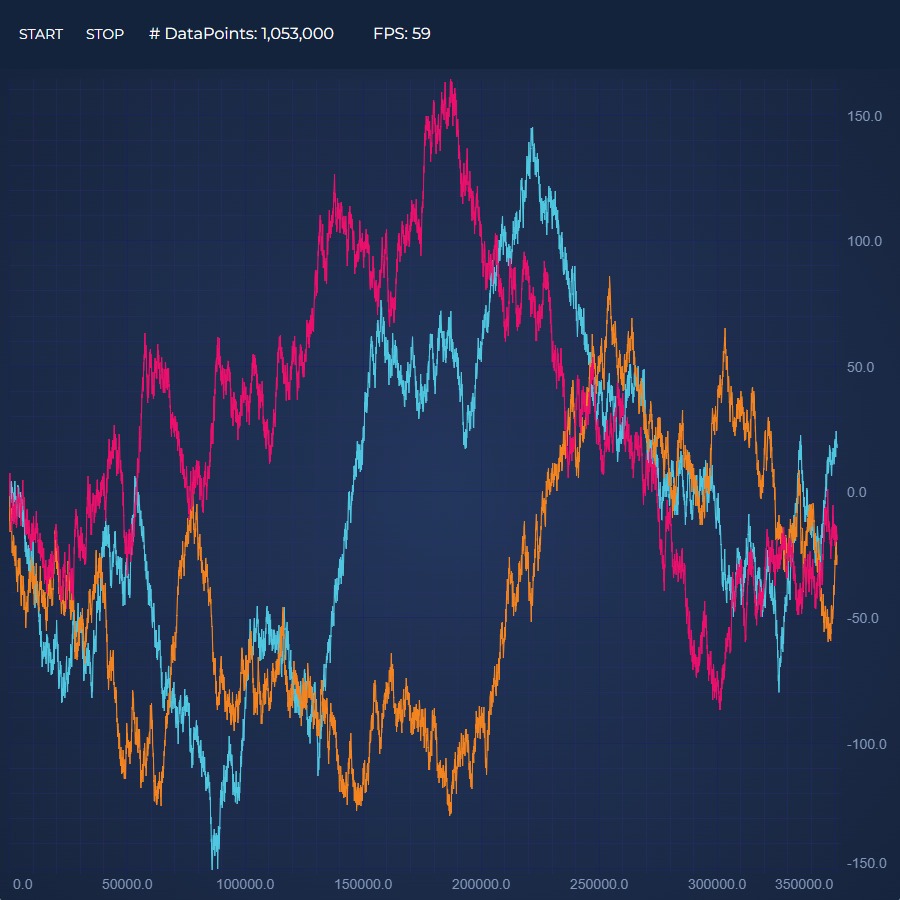
Realtime JavaScript Chart Performance Demo
This demo showcases the incredible realtime performance of our JavaScript charts by updating the series with millions of data-points!
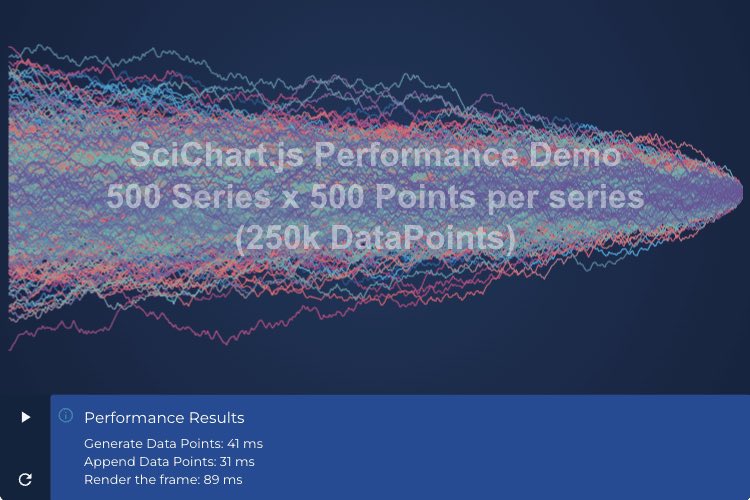
Load 500 Series x 500 Points Performance Demo
This demo showcases the incredible performance of our JavaScript Chart by loading 500 series with 500 points (250k points) instantly!
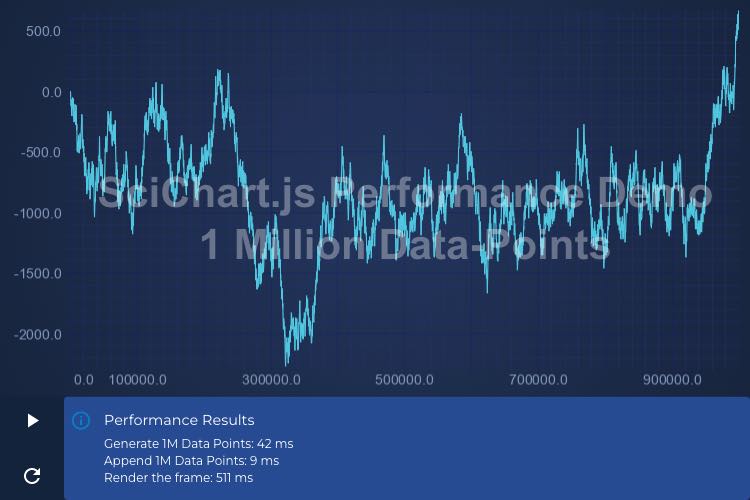
Load 1 Million Points Performance Demo
This demo showcases the incredible performance of our JavaScript Chart by loading a million points instantly.
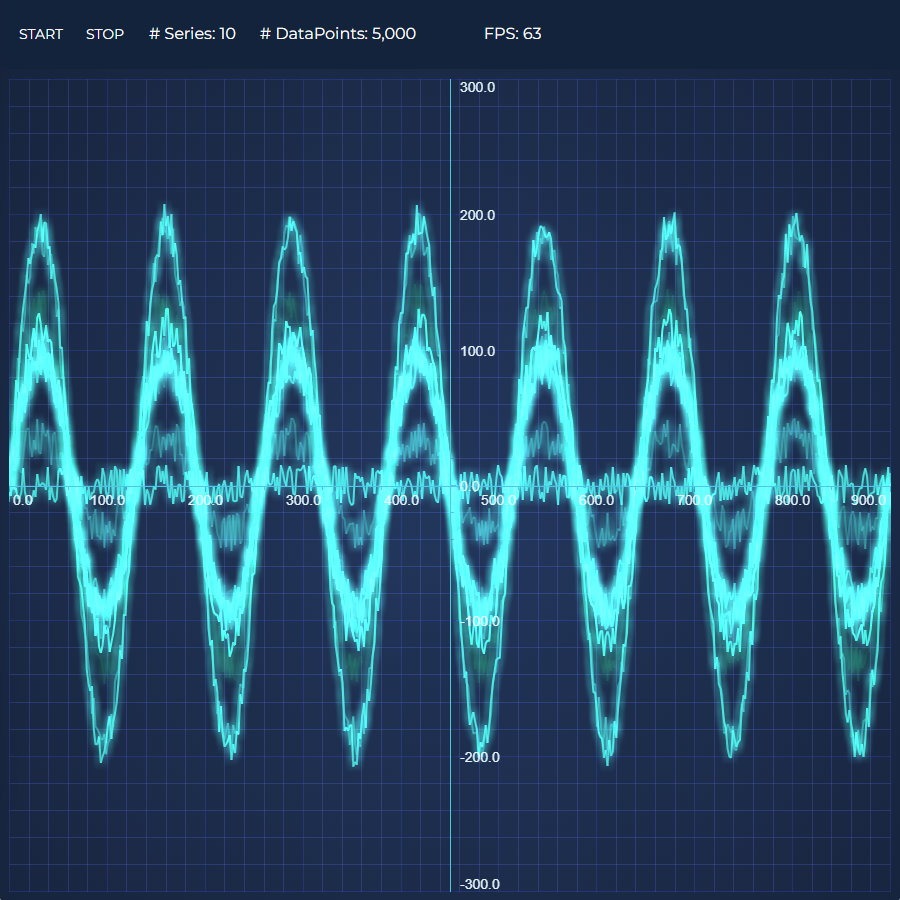
Realtime Ghosted Traces
This demo showcases the realtime performance of our JavaScript Chart by animating several series with thousands of data-points at 60 FPS

Realtime Audio Analyzer Demo
Demonstrating the capability of SciChart.js to create a JavaScript Audio Analyzer and visualize the Fourier-Transform of an audio waveform in realtime.
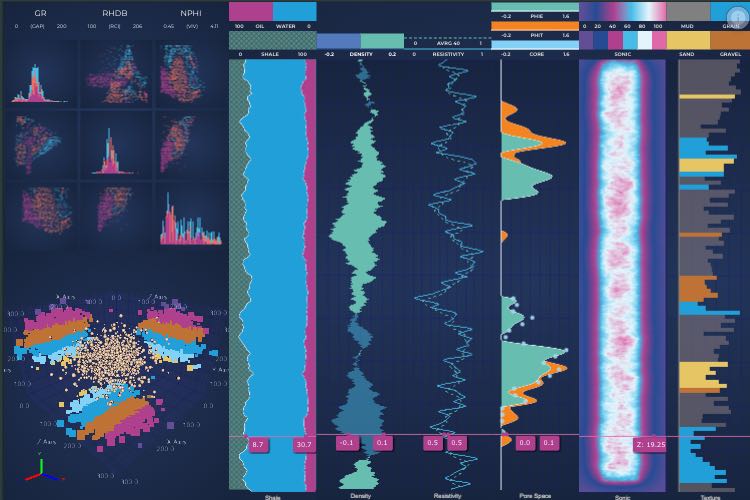
Oil & Gas Explorer JavaScript Dashboard
Demonstrates how to create Oil and Gas Dashboard
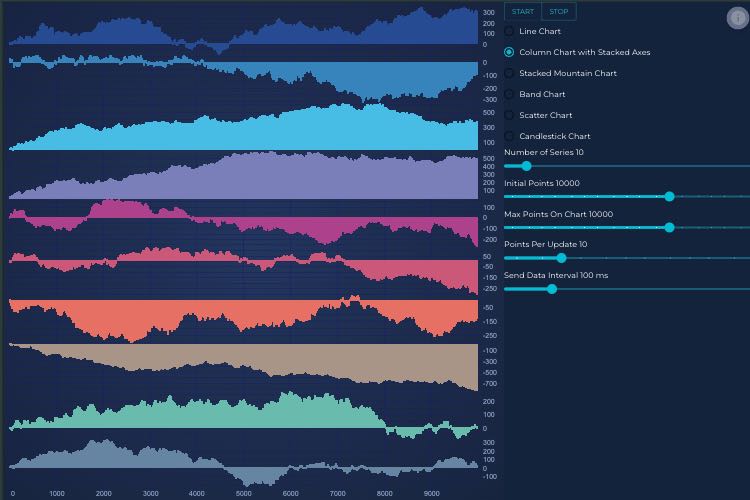
Client/Server Websocket Data Streaming
This demo showcases the incredible realtime performance of our JavaScript charts by updating the series with millions of data-points!
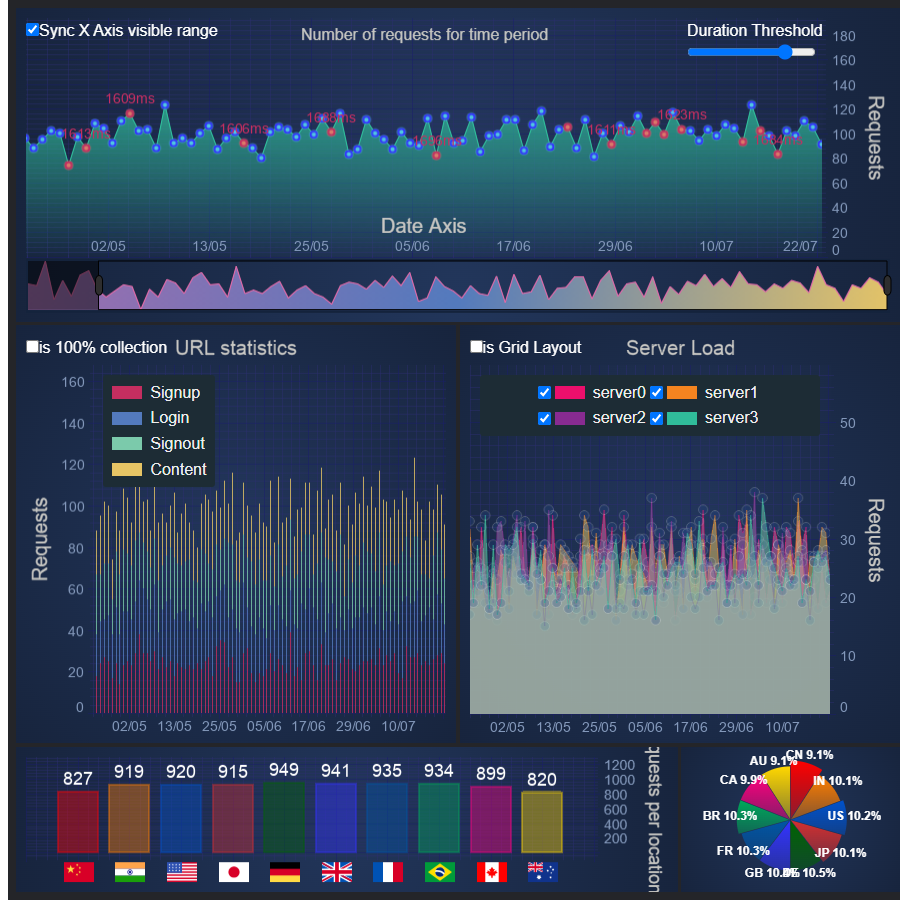
Server Traffic Dashboard
This dashboard demo showcases the incredible realtime performance of our JavaScript charts by updating the series with millions of data-points!
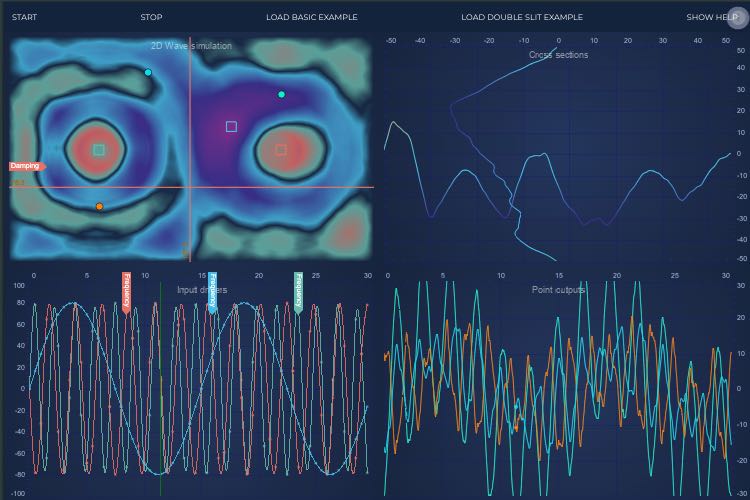
Rich Interactions Showcase
This demo showcases the incredible realtime performance of our JavaScript charts by updating the series with millions of data-points!
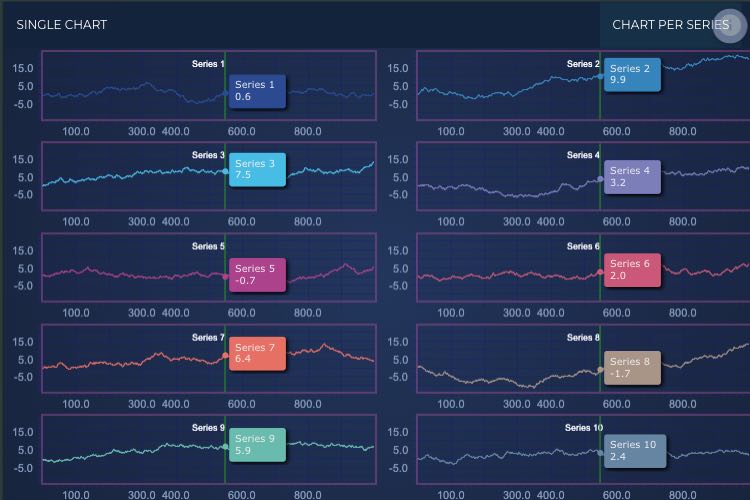
Dynamic Layout Showcase
Demonstrates a custom modifier which can convert from single chart to grid layout and back.
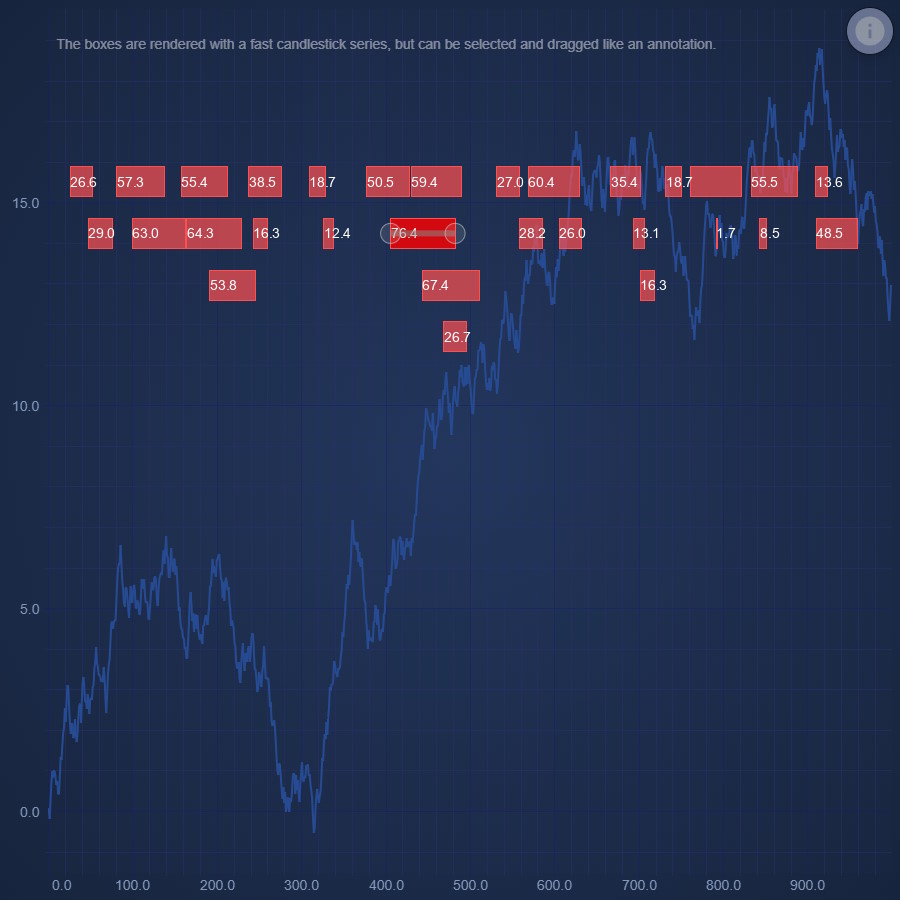
Dragabble Event Markers
Demonstrates how to repurpose a Candlestick Series into dragabble, labled, event markers
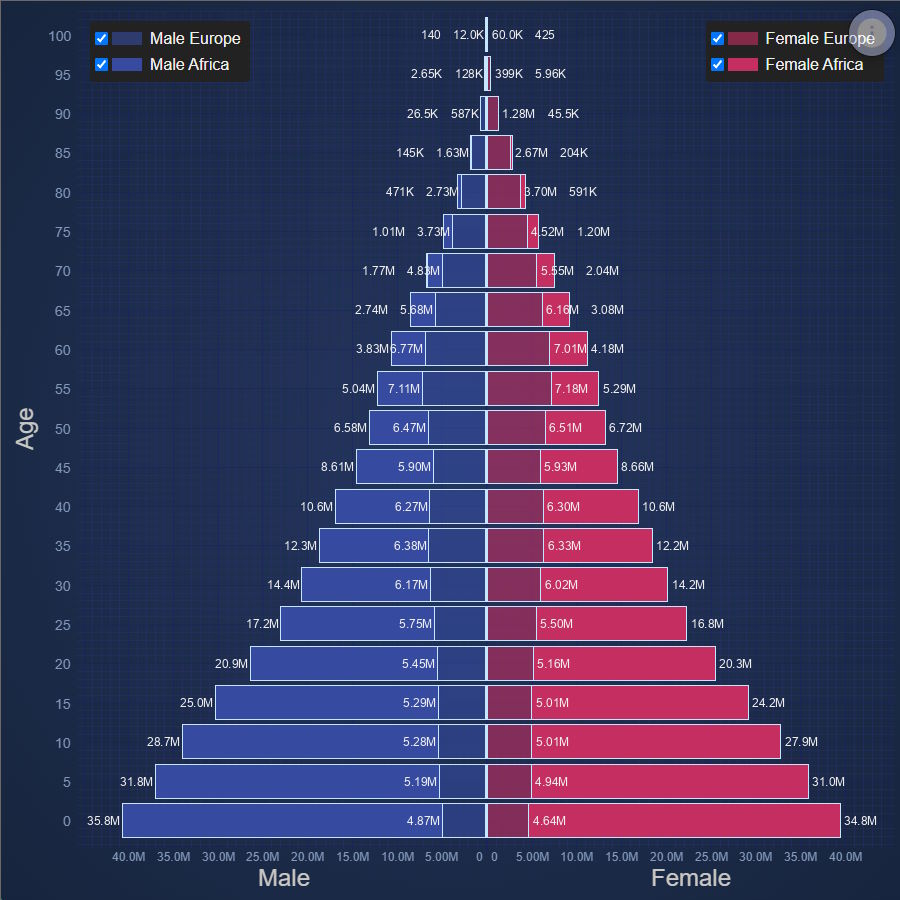
JavaScript Population Pyramid
Population Pyramid of Europe and Africa
Featured Apps: Scientific & Medical Charts (6 Demos)
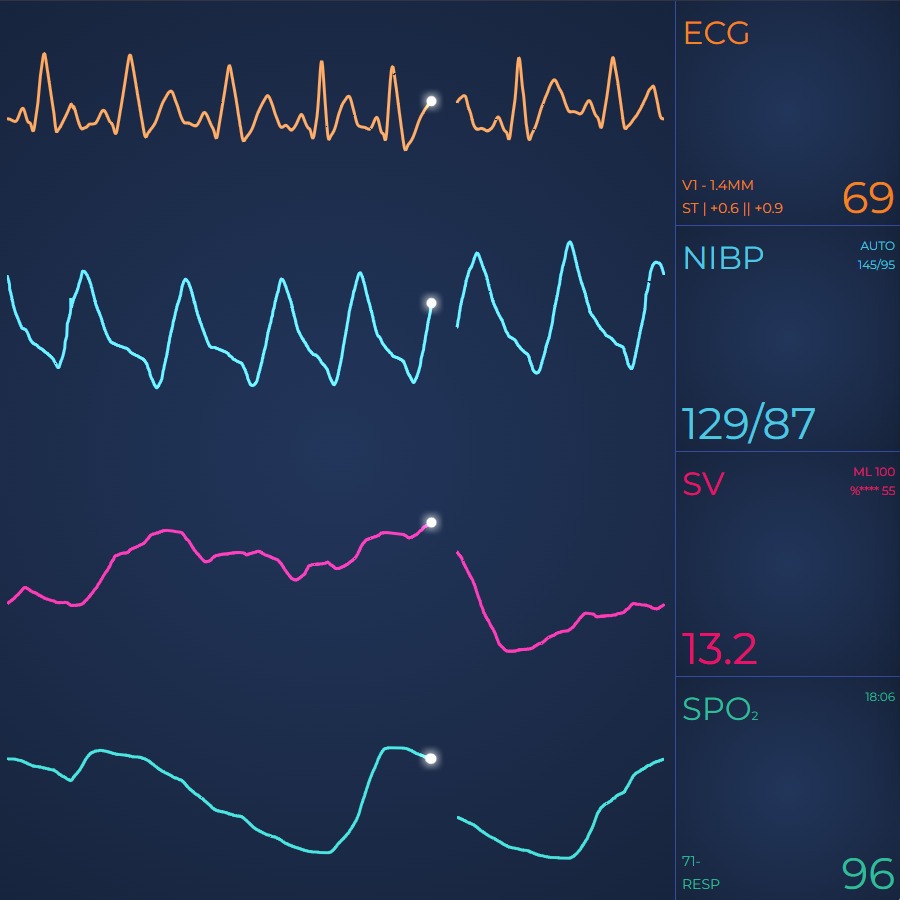
JavaScript Vital Signs ECG/EKG Medical Demo
In this example we are simulating four channels of data showing that SciChart.js can be used to draw real-time ECG/EKG charts and graphs to monitor heart reate, body temperature, blood pressure, pulse rate, SPO2 blood oxygen, volumetric flow and more.
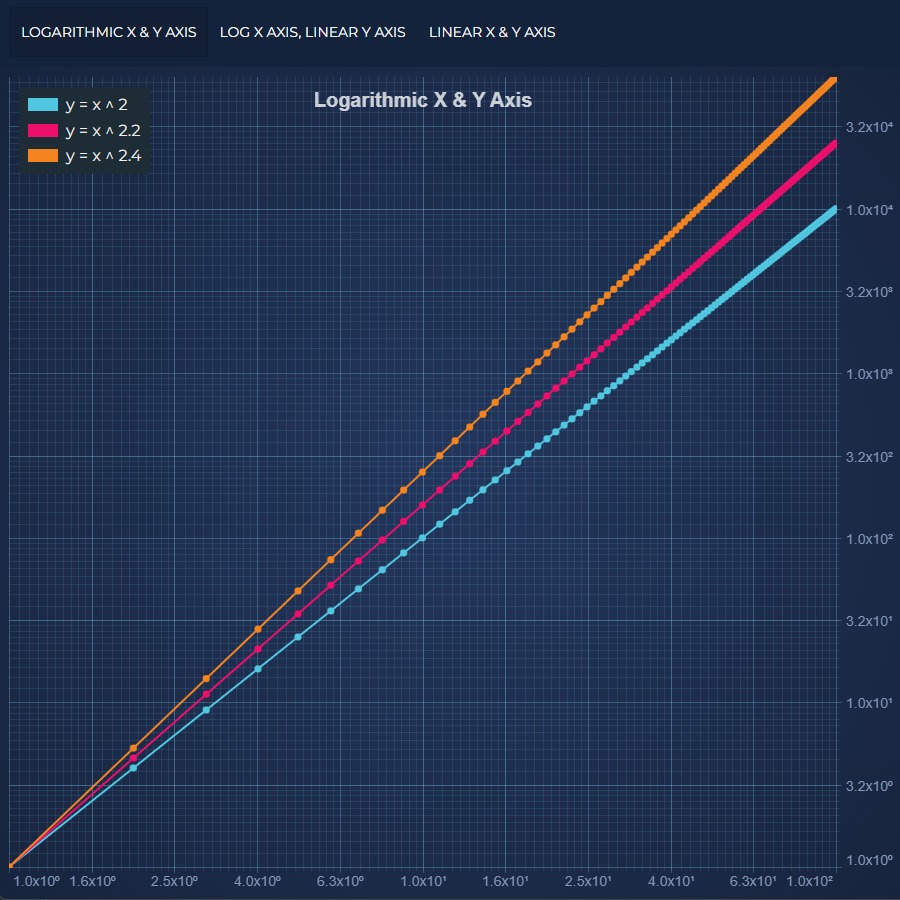
JavaScript Chart with Logarithmic Axis Example
Demonstrates Logarithmic Axis on a JavaScript Chart using SciChart.js. SciChart supports logarithmic axis with scientific or engineering notation and positive and negative values
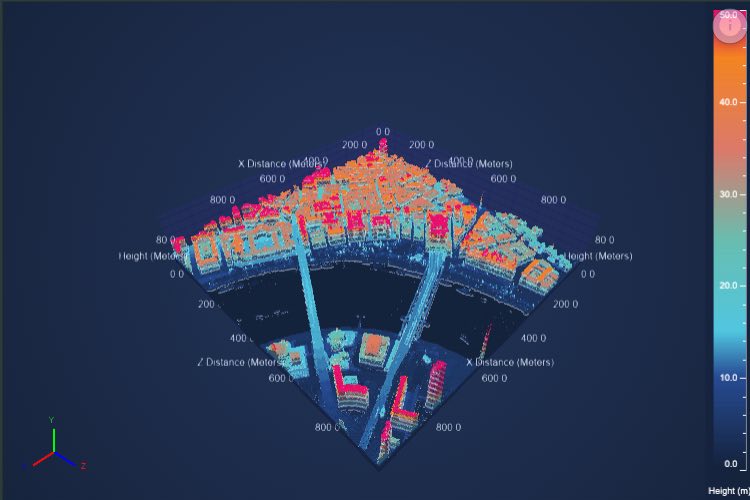
LiDAR 3D Point Cloud of Geospatial Data
Demonstrating the capability of SciChart.js to create JavaScript 3D Point Cloud charts and visualize LiDAR data from the UK Defra Survey.
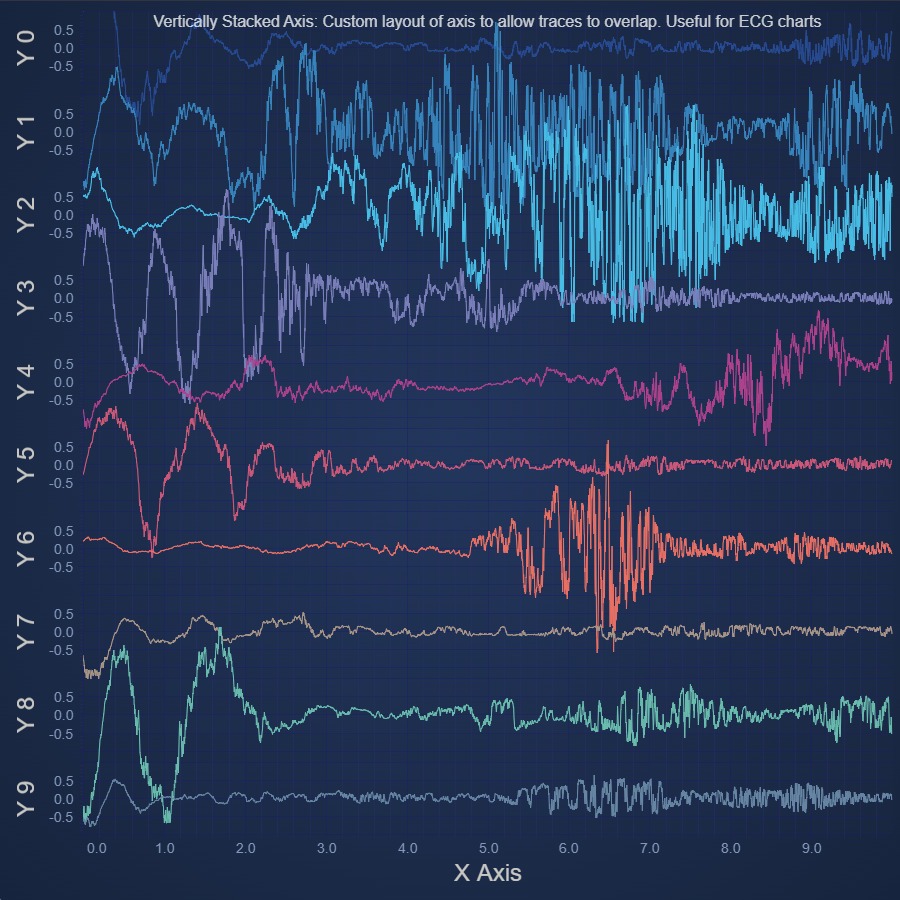
JavaScript Chart with Vertically Stacked Axes
Demonstrates Vertically Stacked Axes on a JavaScript Chart using SciChart.js, allowing data to overlap

Realtime Audio Analyzer Demo
Demonstrating the capability of SciChart.js to create a JavaScript Audio Analyzer and visualize the Fourier-Transform of an audio waveform in realtime.
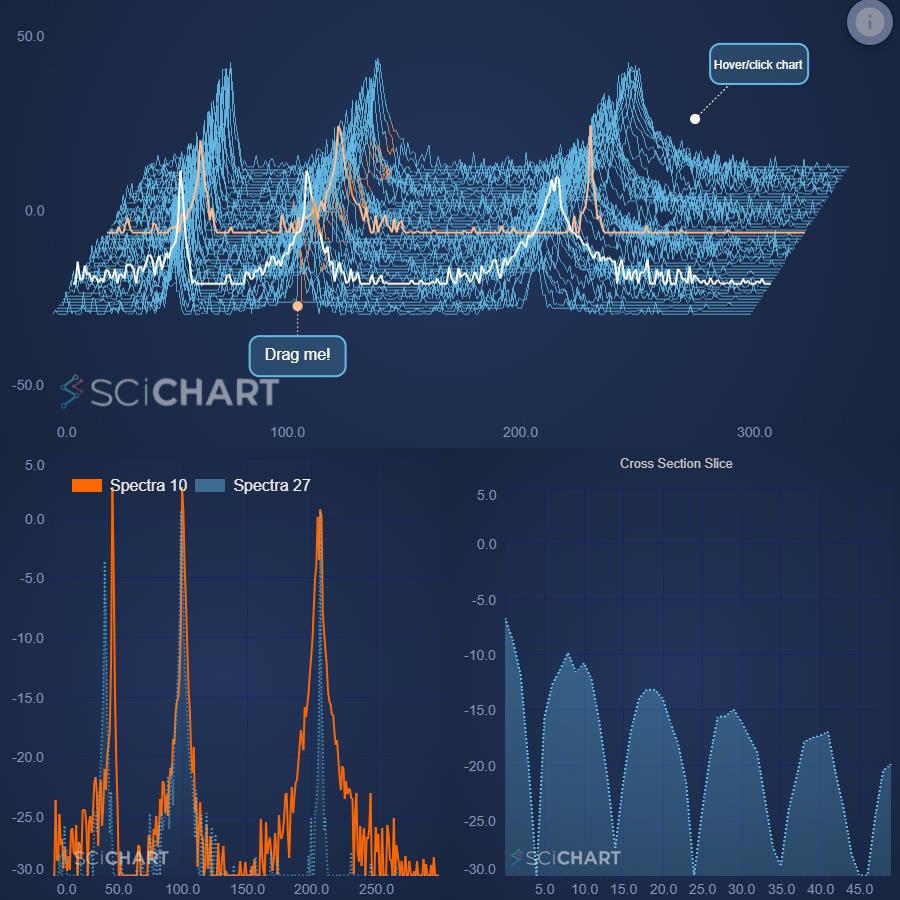
Interactive Waterfall Spectral Chart
Demonstrates how to create a Waterfall chart in SciChart.js, showing chromotragraphy data with interactive selection of points.
Featured Apps: Financial Charts (9 Demos)

JavaScript Candlestick Chart
Discover how to create a JavaScript Candlestick Chart or Stock Chart using SciChart.js. For high Performance JavaScript Charts, get your free demo now.
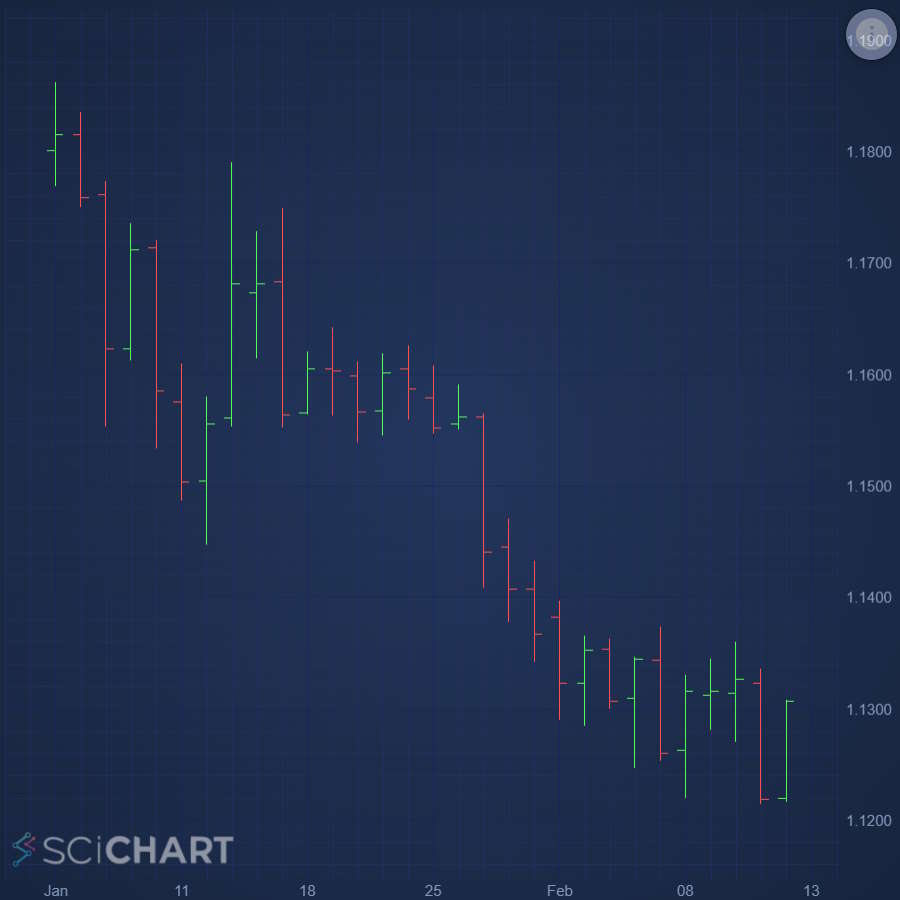
JavaScript OHLC Chart
Easily create JavaScript OHLC Chart or Stock Chart using feature-rich SciChart.js chart library. Supports custom colors. Get your free trial now.
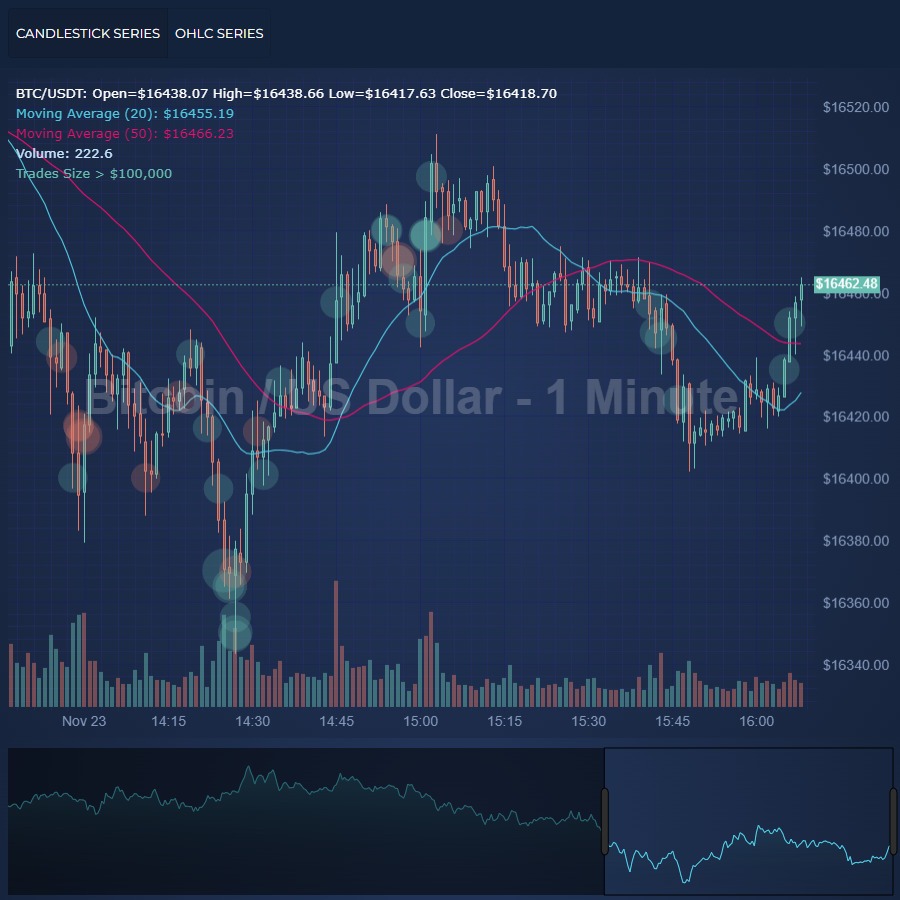
JavaScript Realtime Ticking Stock Charts
Create a JavaScript Realtime Ticking Candlestick / Stock Chart with live ticking and updating, using the high performance SciChart.js chart library. Get free demo now.
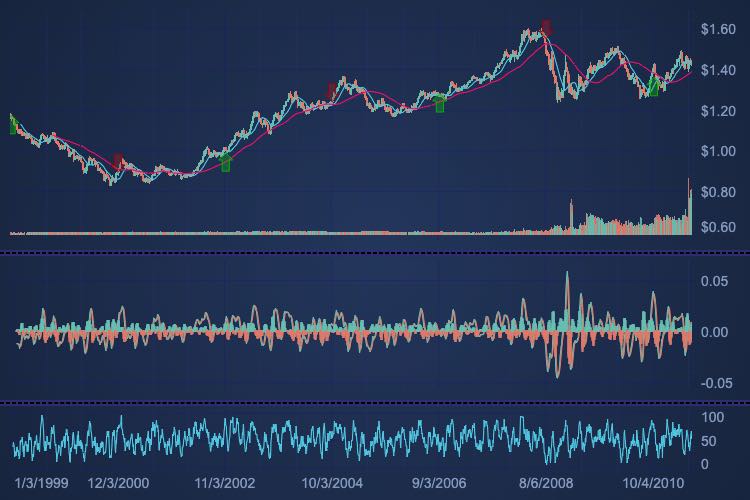
JavaScript Multi-Pane Stock Charts using Subcharts
Create a JavaScript Multi-Pane Candlestick / Stock Chart with indicator panels, synchronized zooming, panning and cursors. Get your free trial of SciChart.js now.

Tenor Curves Demo
Demonstrating the capability of SciChart.js to create a composite 2D & 3D Chart application. An example like this could be used to visualize Tenor curves in a financial setting, or other 2D/3D data combined on a single screen.
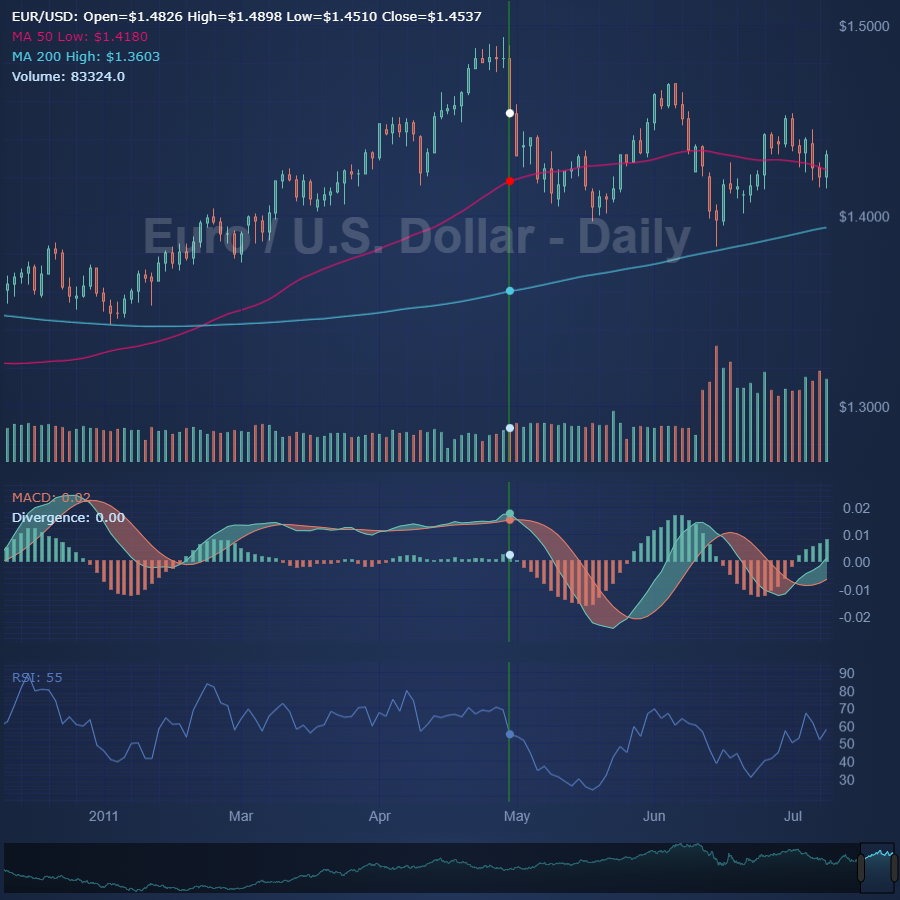
JavaScript Multi-Pane Stock Charts using Sync Multi-Chart
Create a JavaScript Multi-Pane Candlestick / Stock Chart with indicator panels, synchronized zooming, panning and cursors. Get your free trial of SciChart.js now.
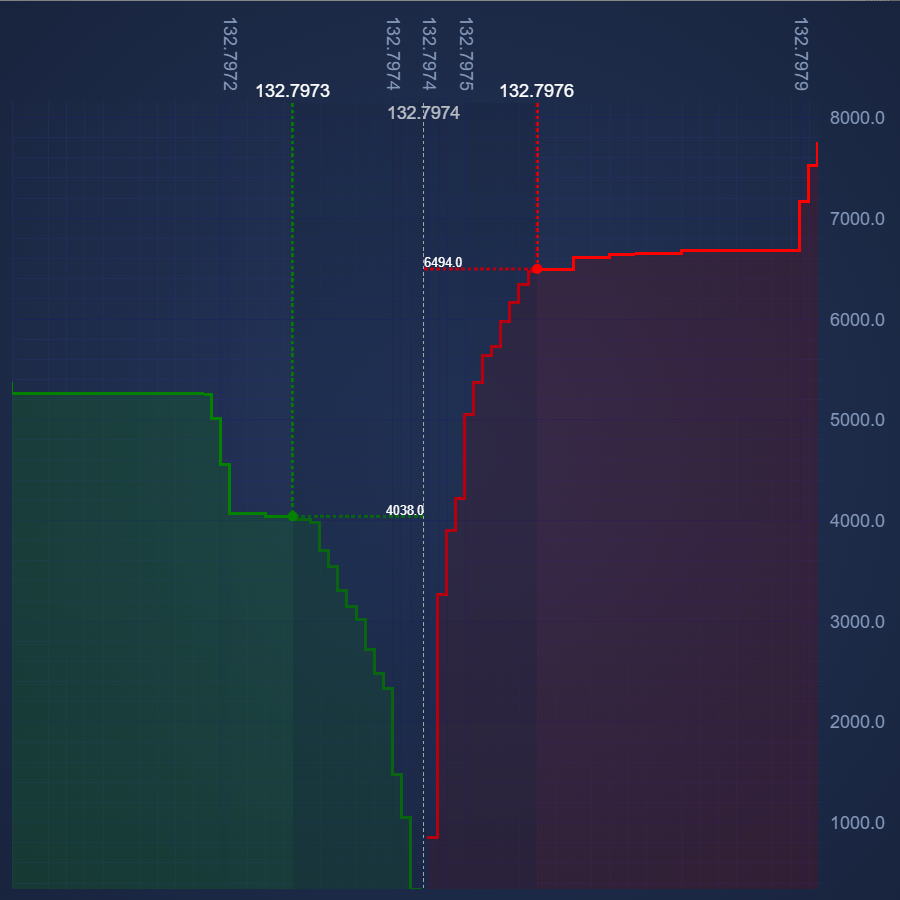
JavaScript Market Depth Chart
Create a JavaScript Depth Chart, using the high performance SciChart.js chart library. Get free demo now.
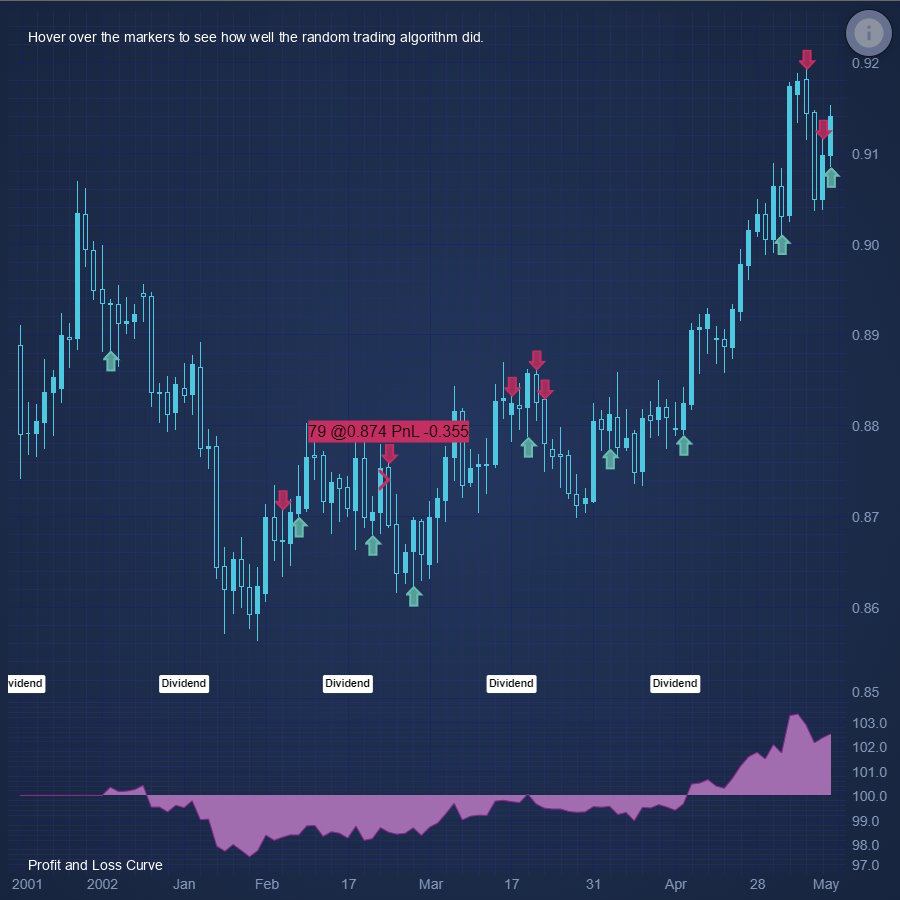
JavaScript Chart Hoverable Buy Sell Marker Annotations
Demonstrates how to place Buy/Sell arrow markers on a JavaScript Stock Chart using SciChart.js - Annotations API
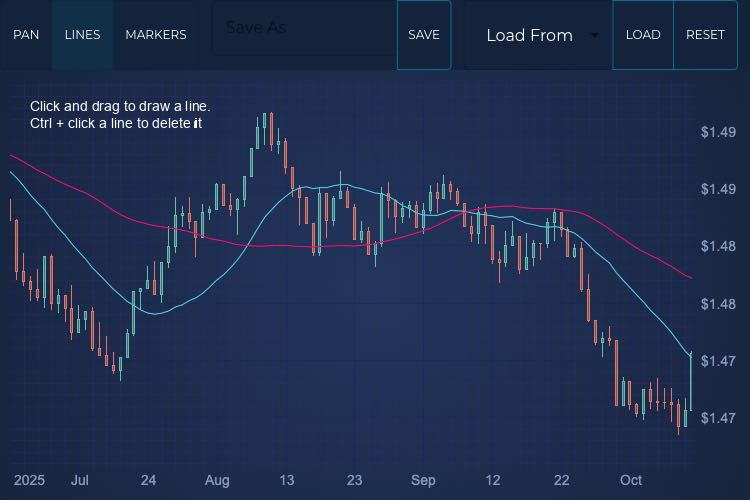
JavaScript User Annotated Stock Chart
This demo shows you how to create a <strong>{frameworkName} User Annotated Stock Chart</strong> using SciChart.js. Custom modifiers allow you to add lines and markers, then use the built in serialisation functions to save and reload the chart, including the data and all your custom annotations.
2D Charts: JavaScript Chart Types (29 Demos)

JavaScript Line Chart
Discover how to create a high performance JavaScript Line Chart with SciChart - the leading JavaScript library. Get your free demo now.
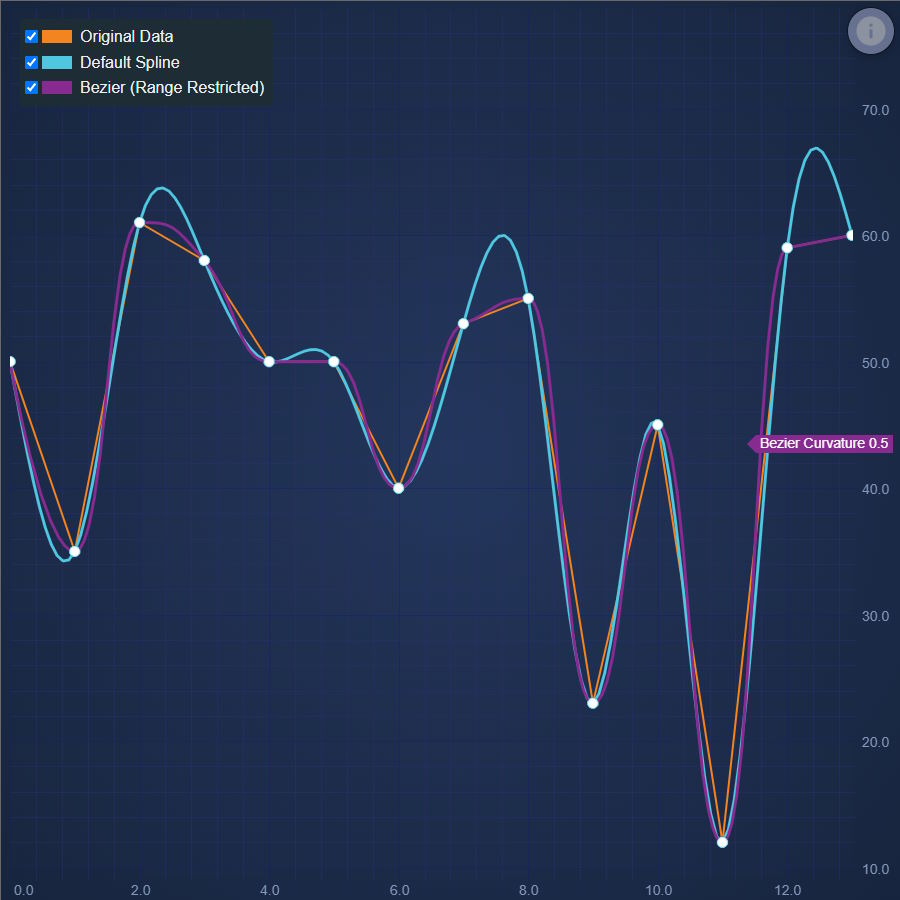
JavaScript Spline Line Chart
Discover how to create a JavaScript Spline Line Chart with SciChart. Demo includes algorithm for smoother lines. Get your free trial now.
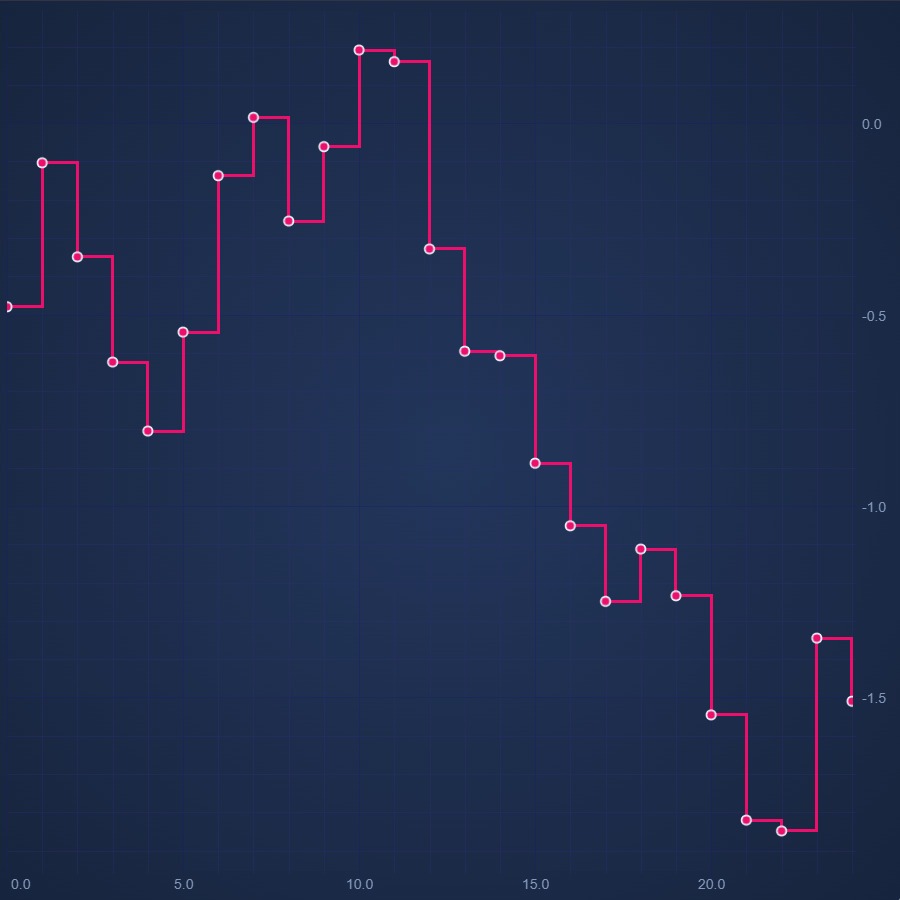
JavaScript Digital Line Chart
Discover how to create a JavaScript Digital Line Chart with SciChart - your feature-rich JavaScript Chart Library. Get your free demo now.
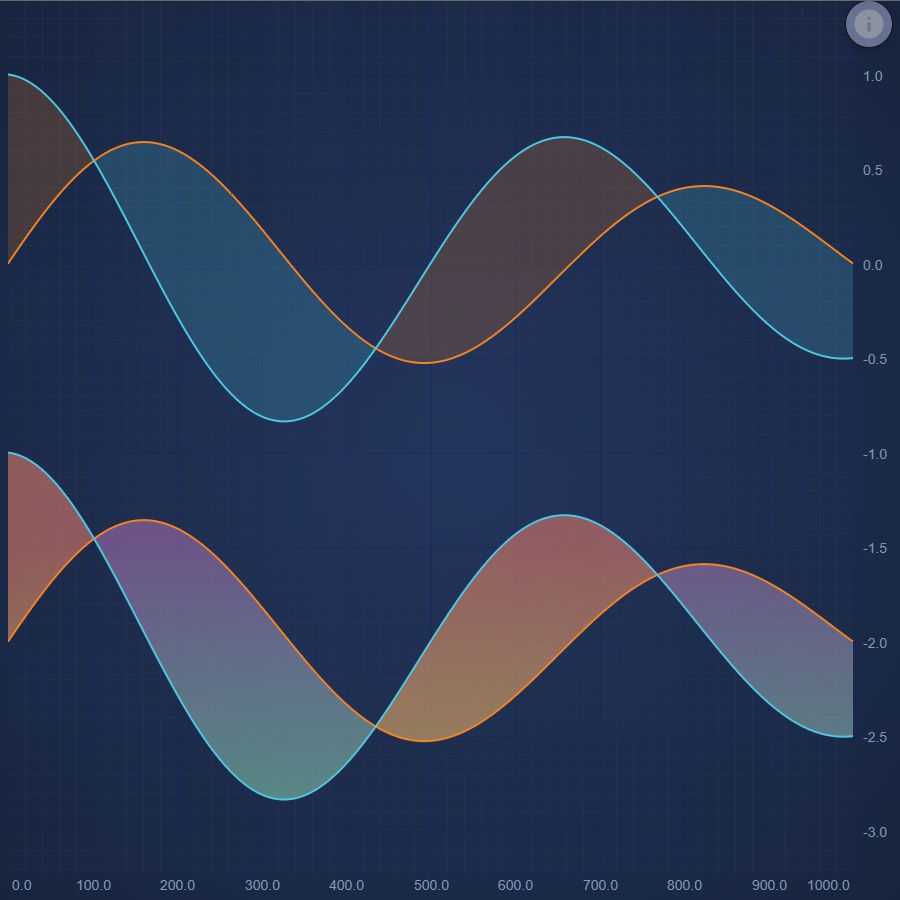
JavaScript Band Chart
Easily create a JavaScript Band Chart or High-Low Fill with SciChart - high performance JavaScript Chart Library. Get your free trial now.
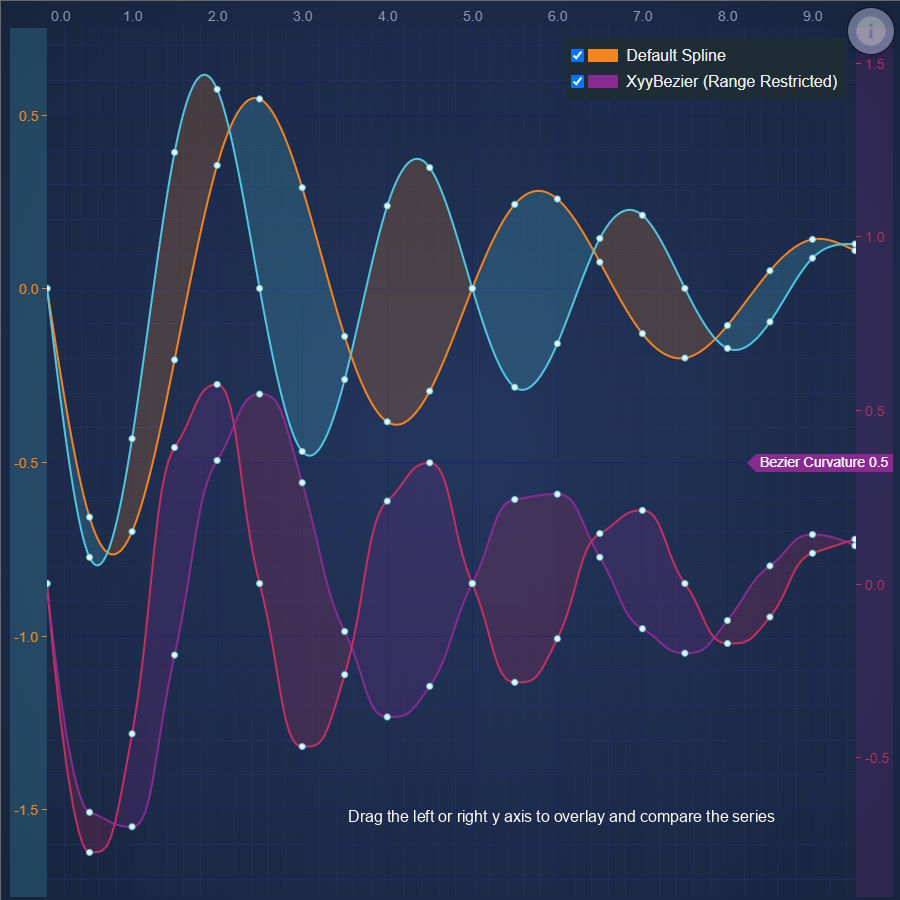
JavaScript Spline Band Chart
SciChart's JavaScript Spline Band Chart makes it easy to draw thresholds or fills between two lines on a chart. Get your free demo today.
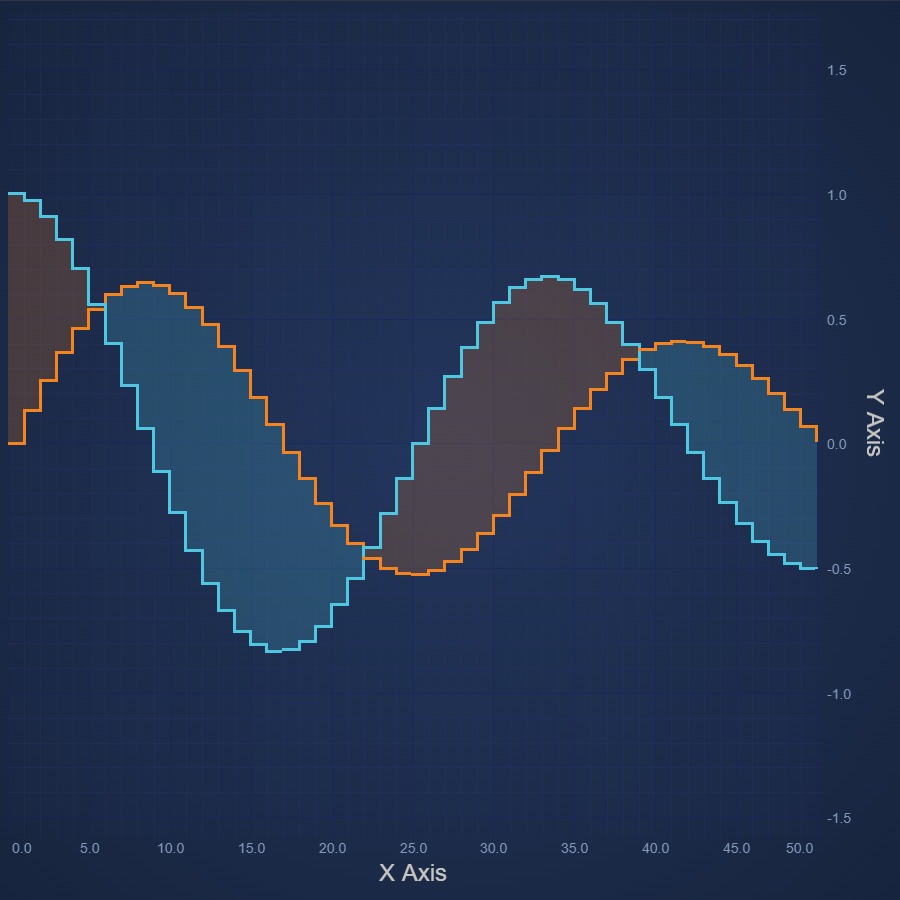
JavaScript Digital Band Chart
Learn how to create a JavaScript Digital Band Chart or High-Low Fill Chart with SciChart's easy-to-follow demos. Get your free trial today.
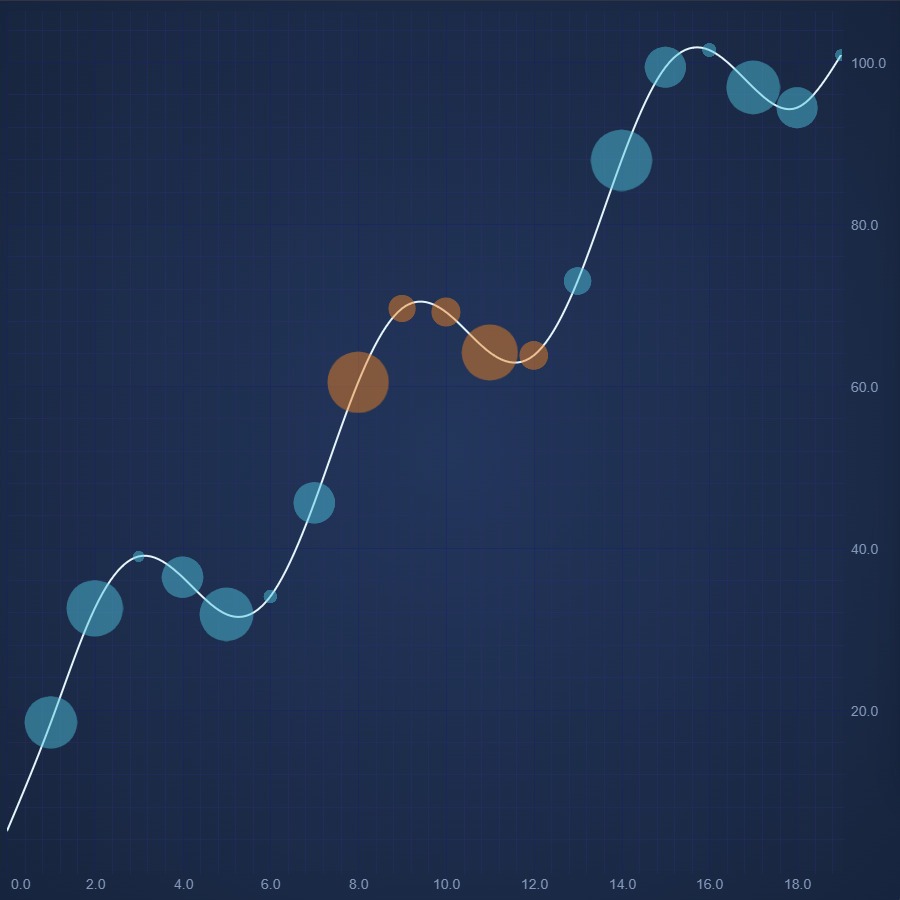
JavaScript Bubble Chart
Create a high performance JavaScript Bubble Chart with Sci-Chart. Demo shows how to draw point-markers at X,Y locations. Get your free demo now.

JavaScript Candlestick Chart
Discover how to create a JavaScript Candlestick Chart or Stock Chart using SciChart.js. For high Performance JavaScript Charts, get your free demo now.
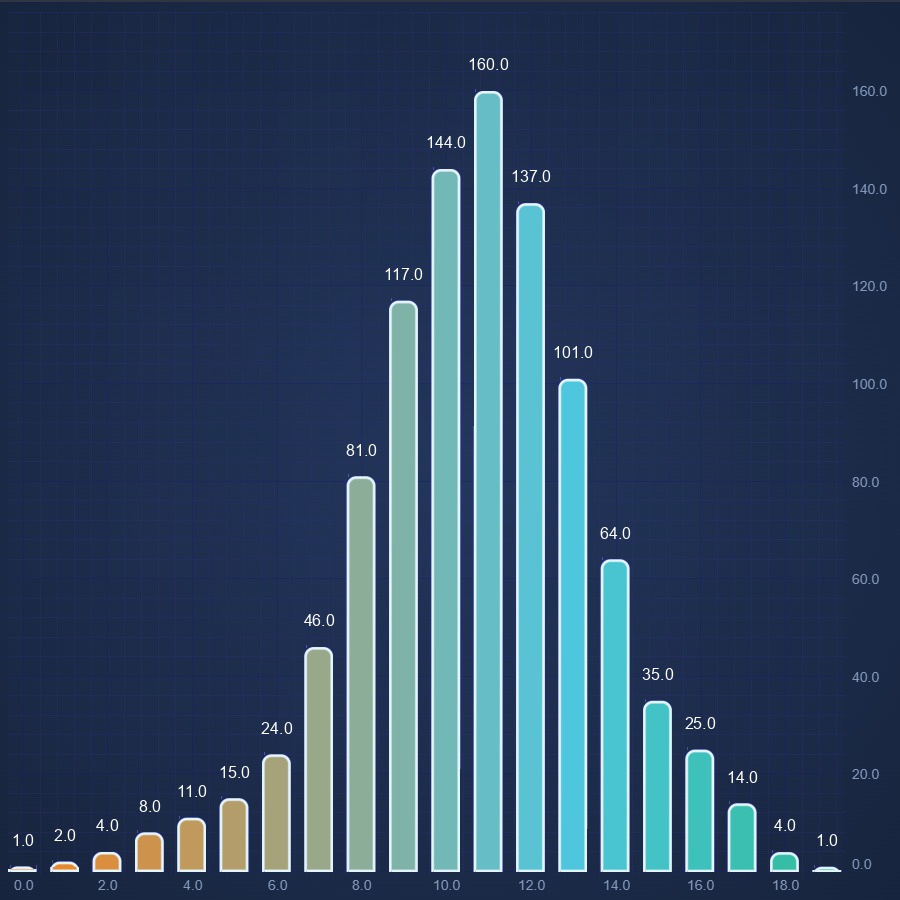
JavaScript Column Chart
JavaScript Column Chart demo by SciChart supports gradient fill and paletteproviders for more custom coloring options. Get your free demo now.

JavaScript Population Pyramid
Population Pyramid of Europe and Africa
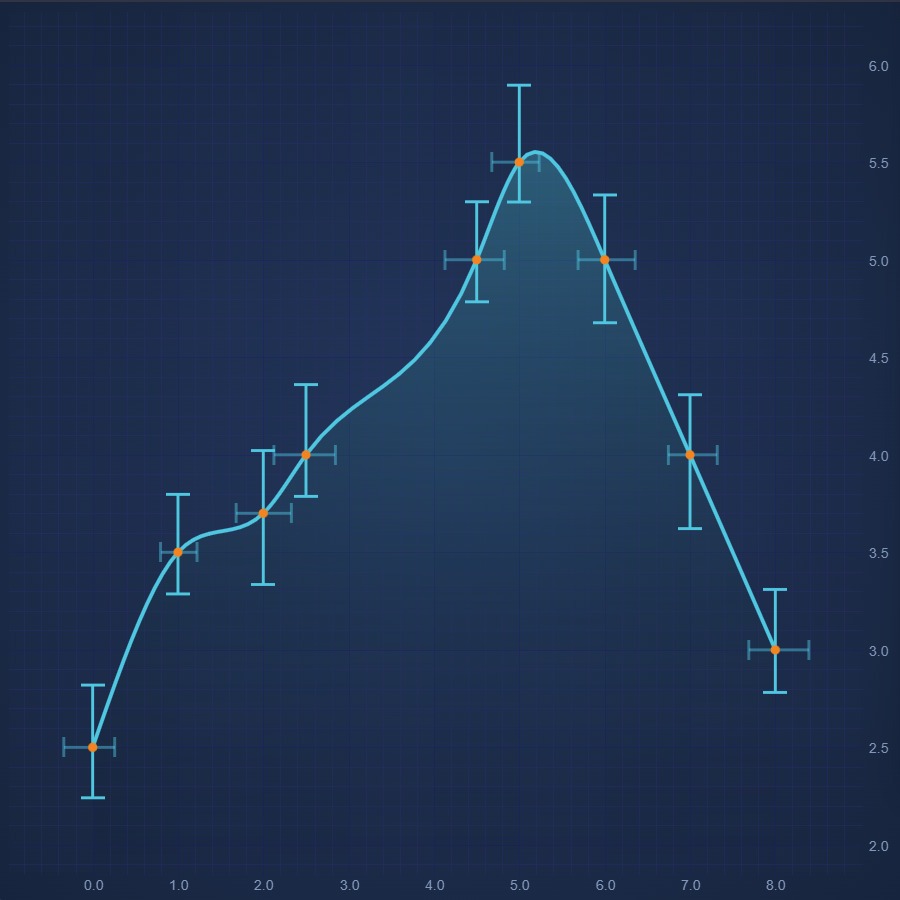
JavaScript Error Bars Chart
Create JavaScript Error Bars Chart using high performance SciChart.js. Display uncertainty or statistical confidence of a data-point. Get free demo now.
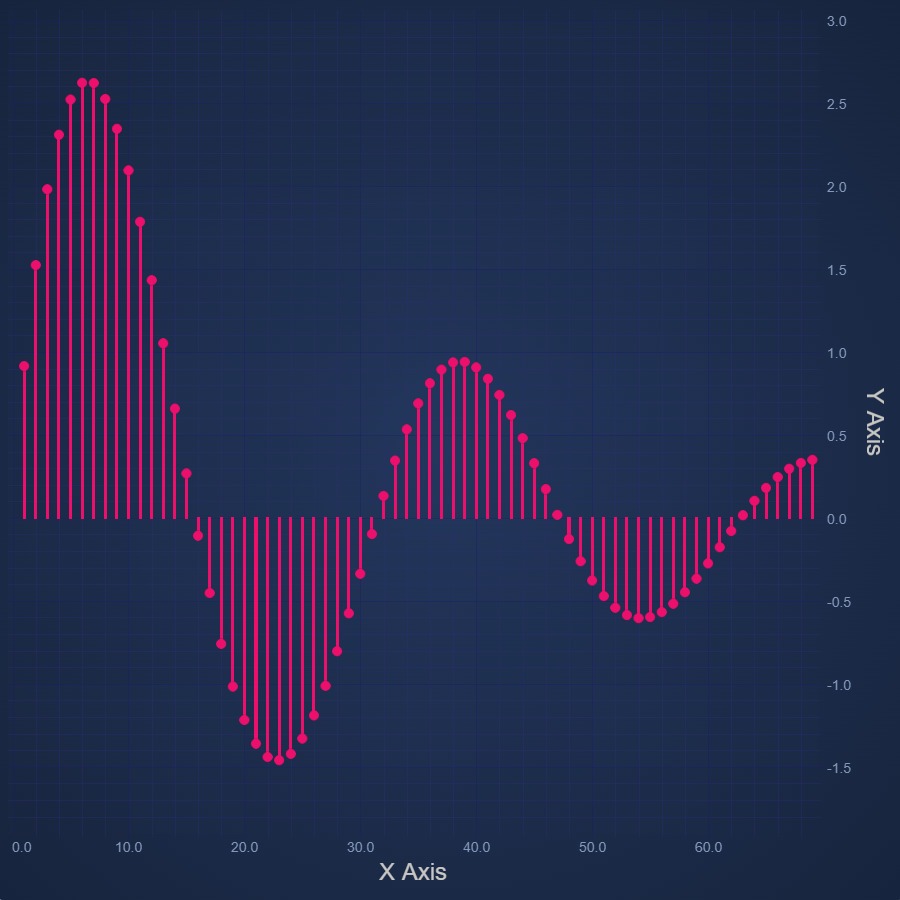
JavaScript Impulse Chart
Easily create JavaScript Impulse Chart or Stem Chart using SciChart.js - our own high performance JavaScript Chart Library. Get your free trial now.
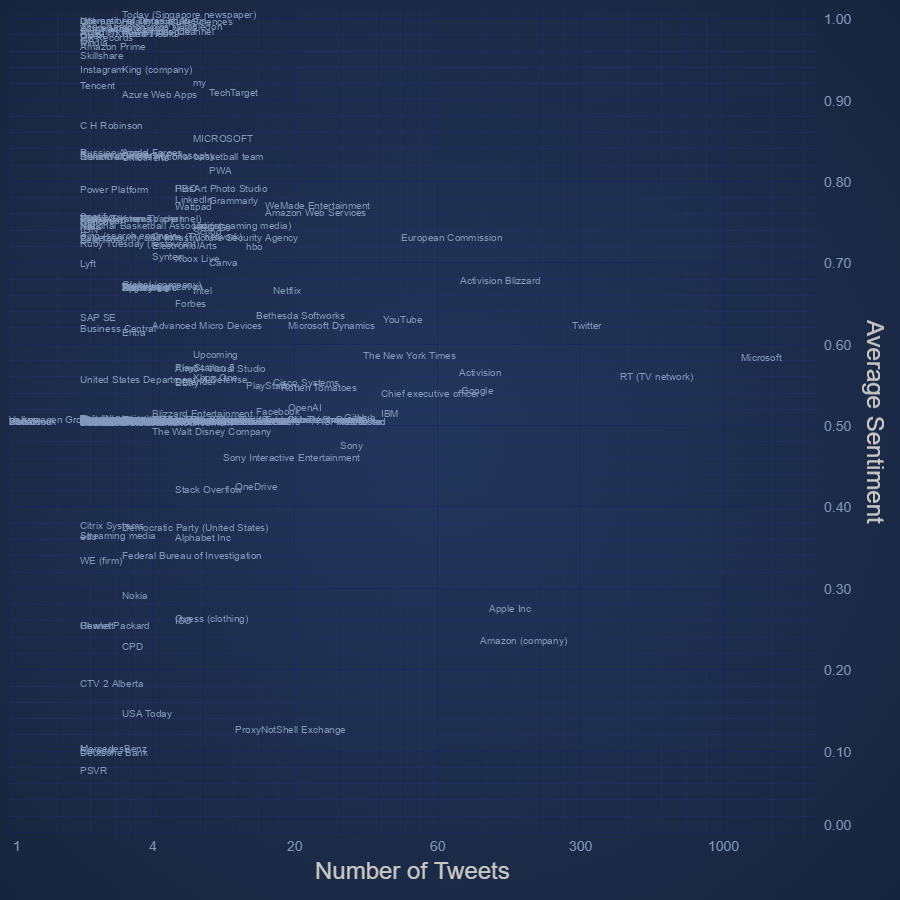
JavaScript Text Chart
Create JavaScript Text Chart with high performance SciChart.js.
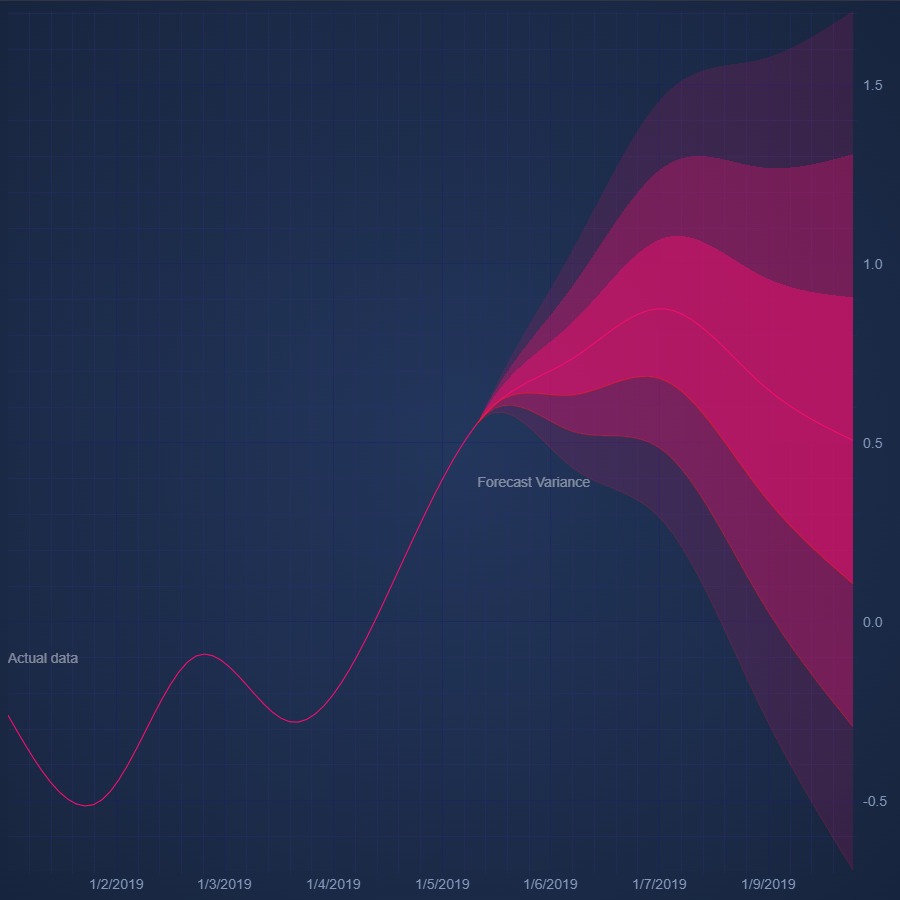
JavaScript Fan Chart
Discover how to create JavaScript Fan Chart with SciChart. Zoom in to see the detail you can go to using our JavaScript Charts. Get your free demo today.

JavaScript Heatmap Chart
Easily create a high performance JavaScript Heatmap Chart with SciChart. Get your free trial of our 5-star rated JavaScript Chart Component today.
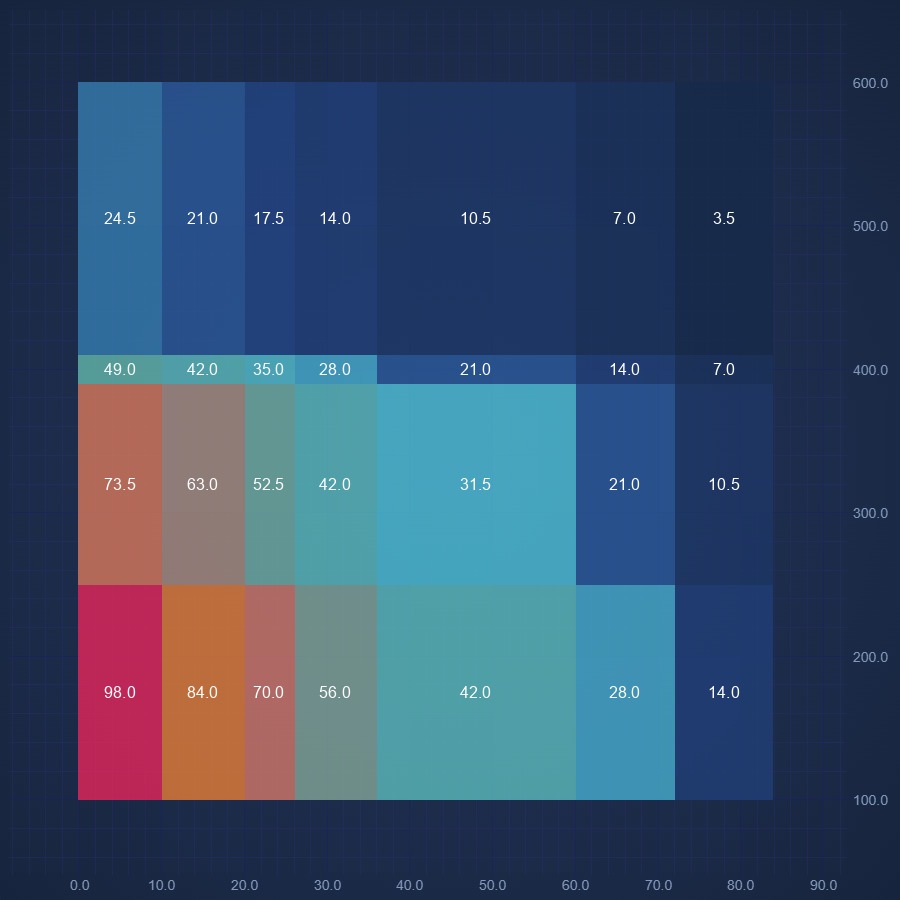
JavaScript Non Uniform Heatmap Chart
Create JavaScript Non Uniform Chart using high performance SciChart.js. Display Heatmap with variable cell sizes. Get free demo now.
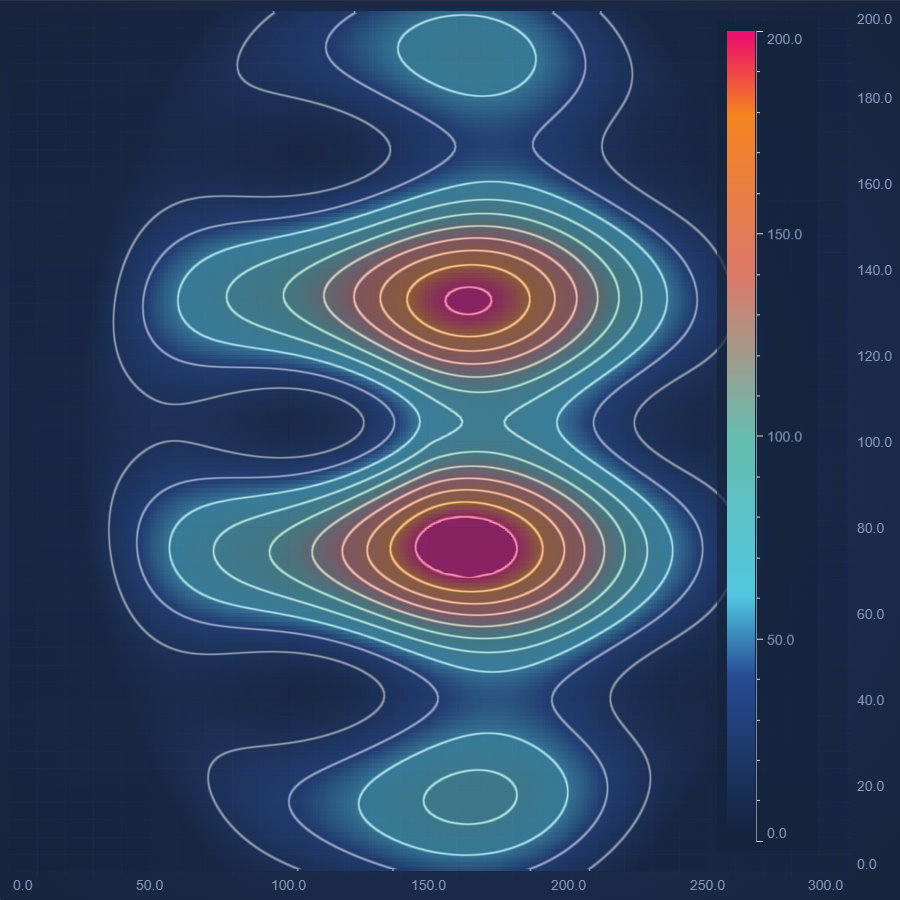
JavaScript Heatmap Chart With Contours
Design a highly dynamic JavaScript Heatmap Chart With Contours with SciChart's feature-rich JavaScript Chart Library. Get your free demo today.
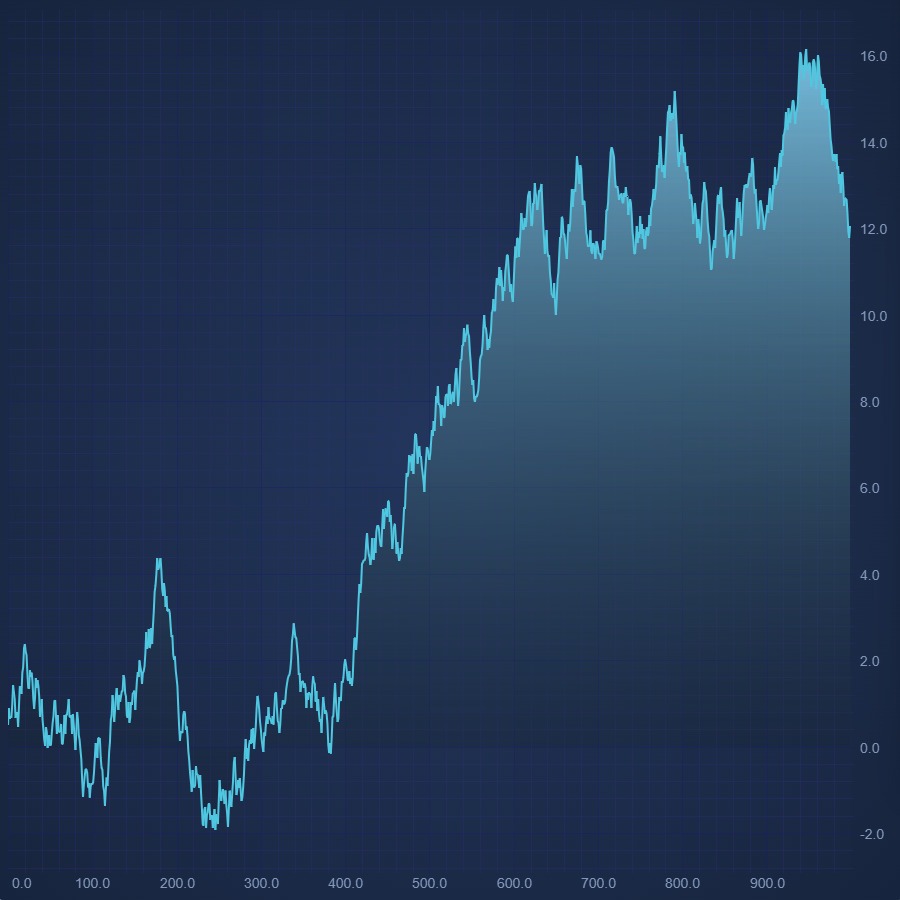
JavaScript Mountain Chart
Create JavaScript Mountain Chart with SciChart.js. Zero line can be zero or a specific value. Fill color can be solid or gradient as well. Get a free demo now.
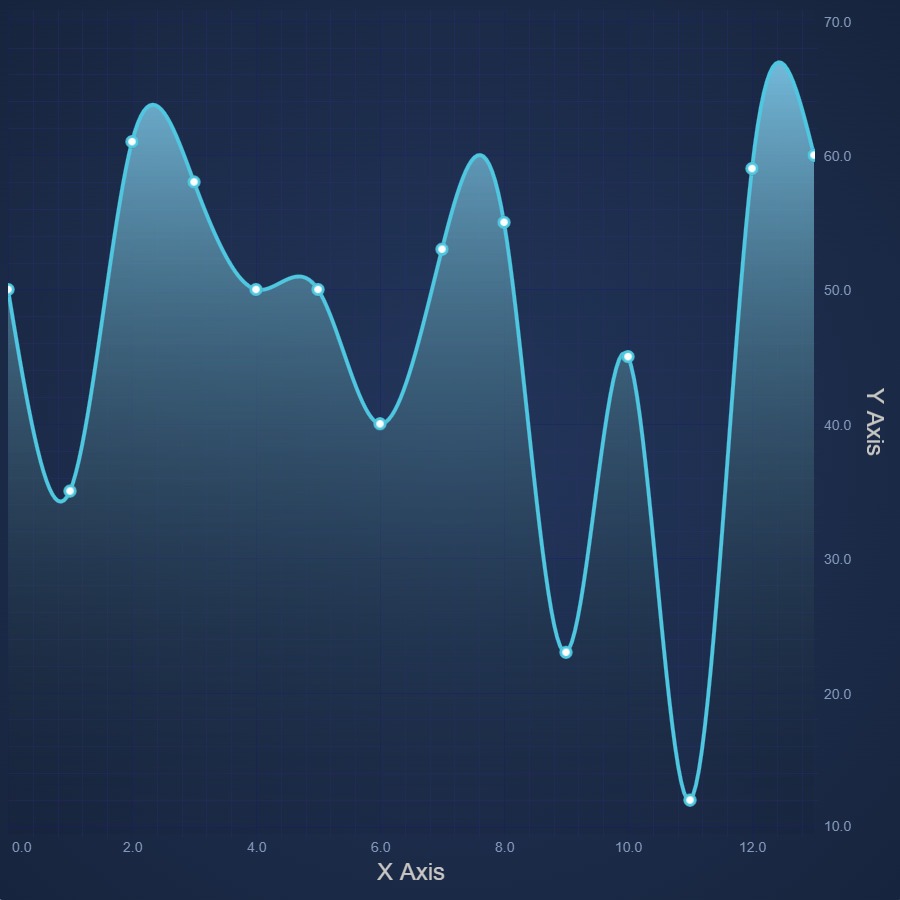
JavaScript Spline Mountain Chart
JavaScript Spline Mountain Chart design made easy. Use SciChart.js' JavaScript Charts for high performance, feature-rich designs. Get free demo now.
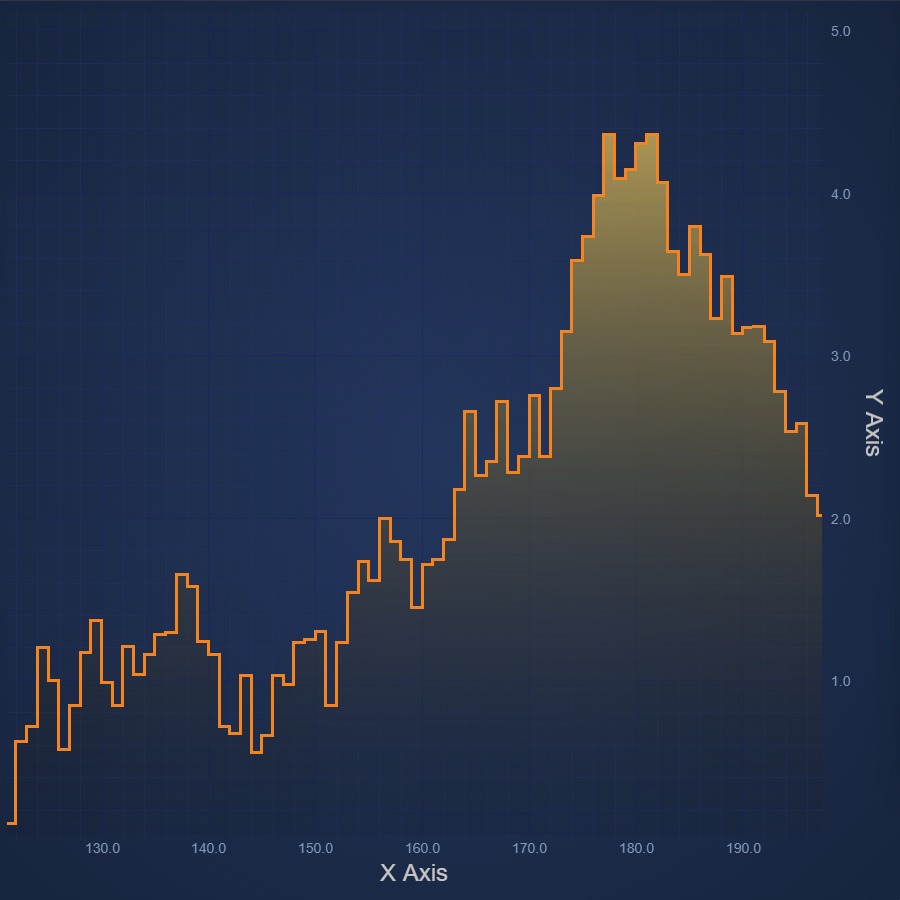
JavaScript Digital Mountain Chart
Create JavaScript Digital Mountain Chart with a stepped-line visual effect. Get your free trial of SciChart's 5-star rated JavaScript Chart Component now.
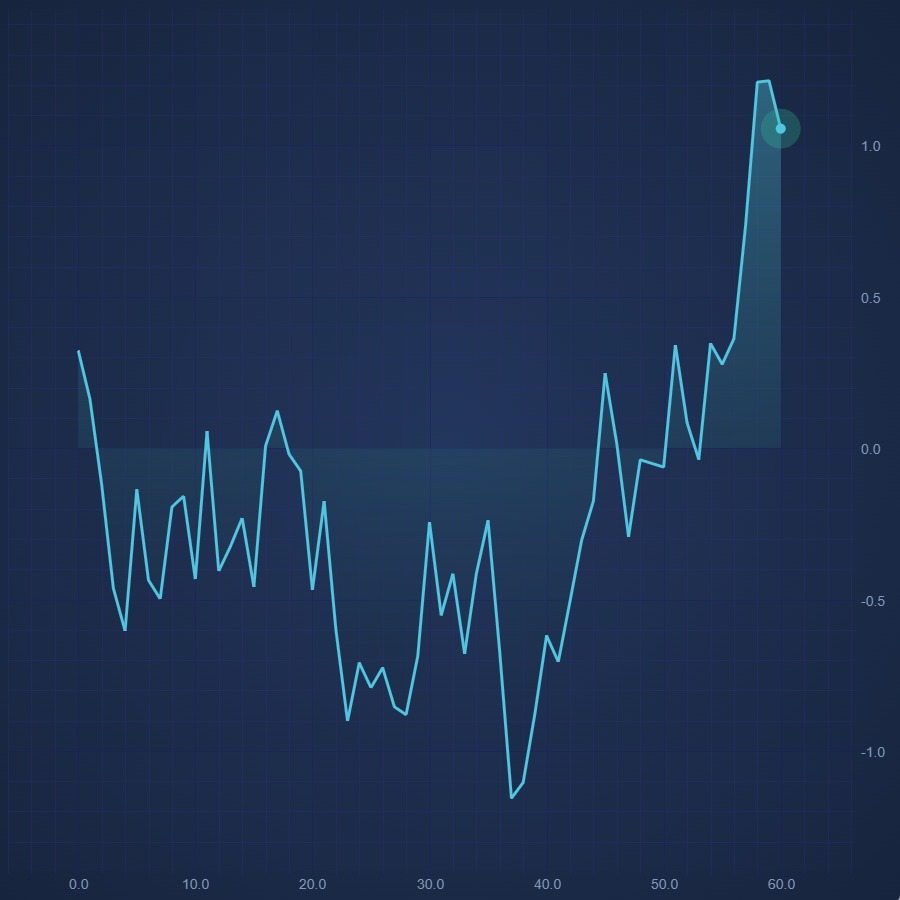
JavaScript Realtime Mountain Chart
JavaScript Realtime Mountain Chart made easy. Add animated, real-time updates with SciChart.js - high performance JavaScript Charts. Get free trial now.
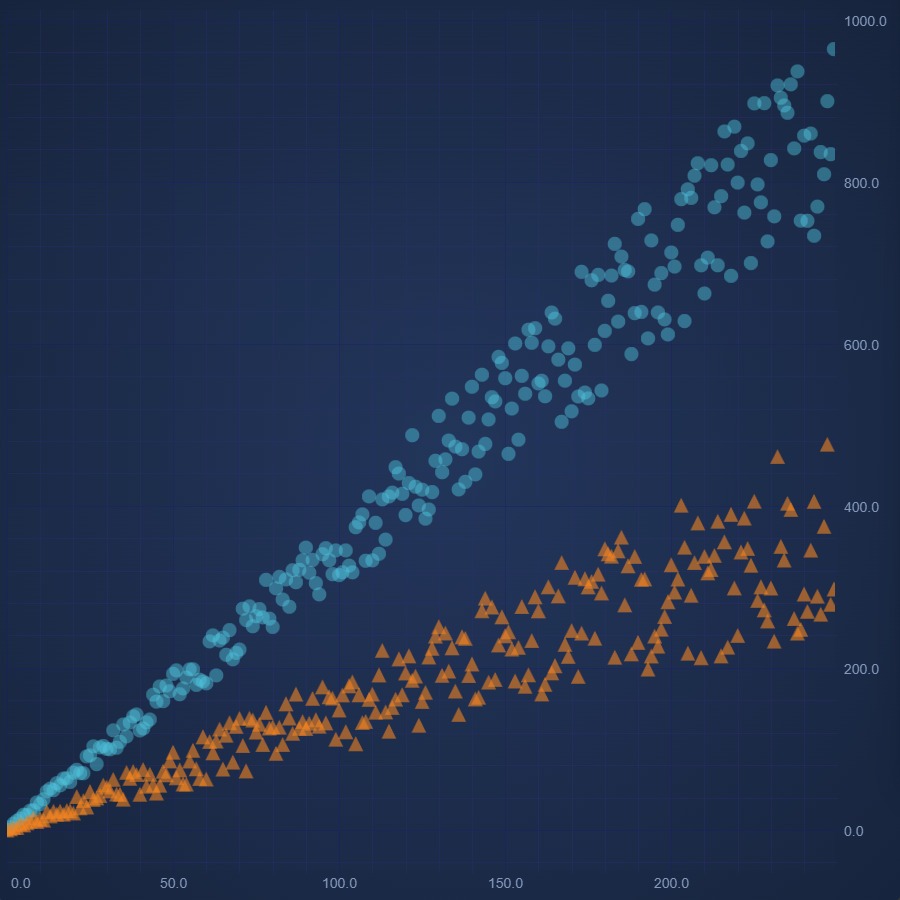
JavaScript Scatter Chart
Create JavaScript Scatter Chart with high performance SciChart.js. Easily render pre-defined point types. Supports custom shapes. Get your free trial now.
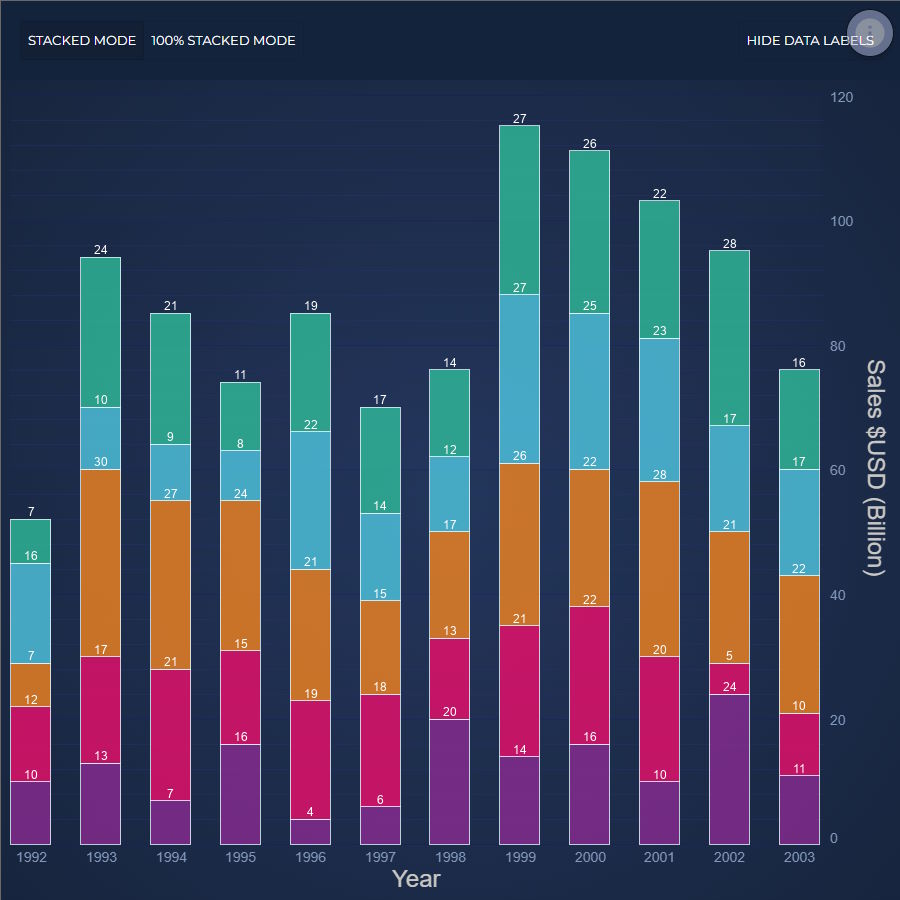
JavaScript Stacked Column Chart
Discover how to create a JavaScript Stacked Column Chart using our feature-rich JavaScript Chart Library, SciChart.js. Get your free demo today!
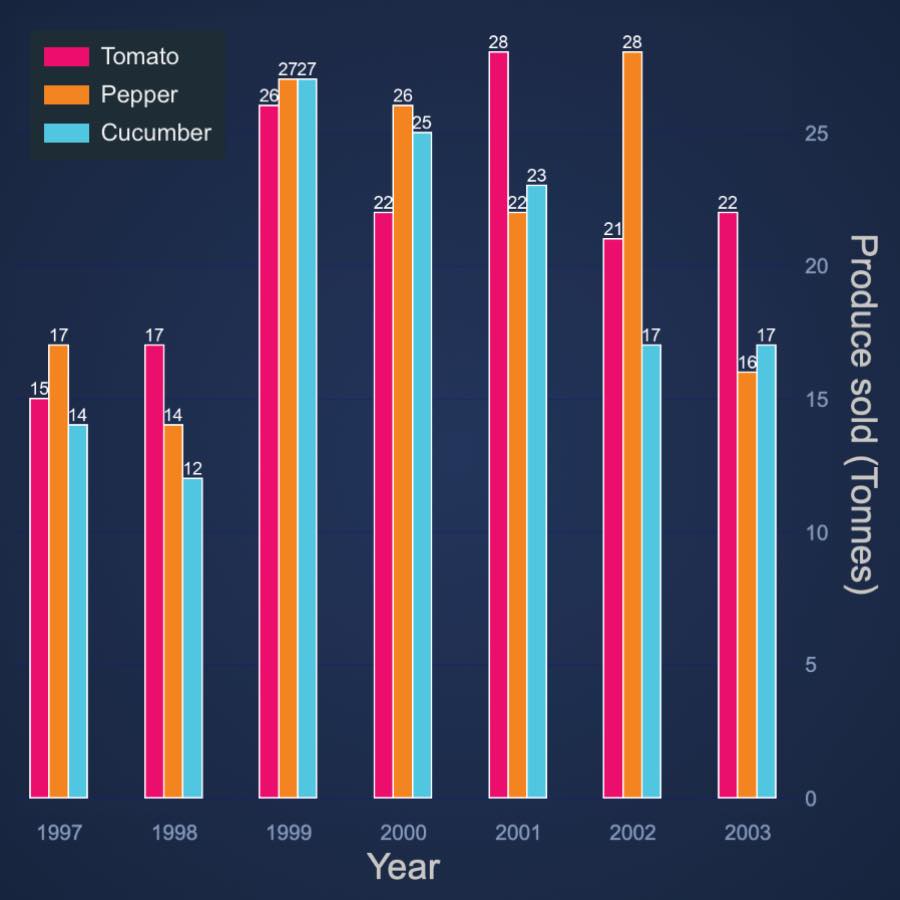
JavaScript Stacked Column Side by Side
Design JavaScript Stacked Group Column Chart side-by-side using our 5-star rated JavaScript Chart Framework, SciChart.js. Get your free demo now.
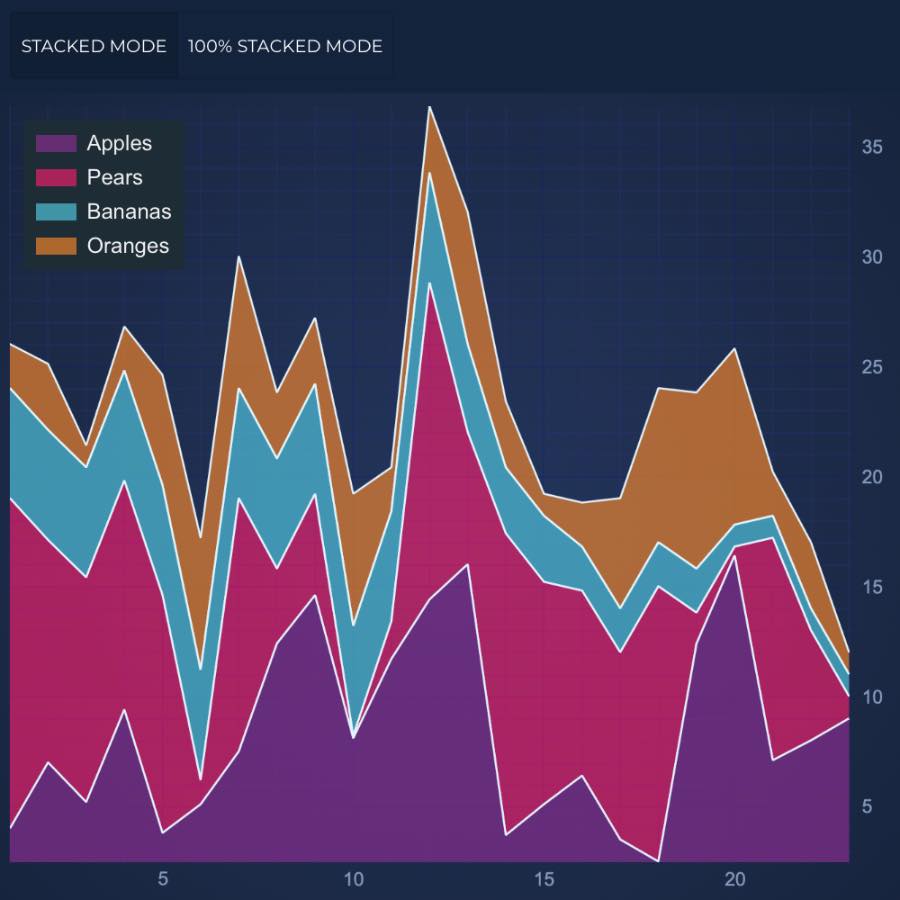
JavaScript Stacked Mountain Chart
Design a high performance JavaScript Stacked Mountain Chart with SciChart.js - your one-stop JavaScript chart library. Get free demo now to get started.
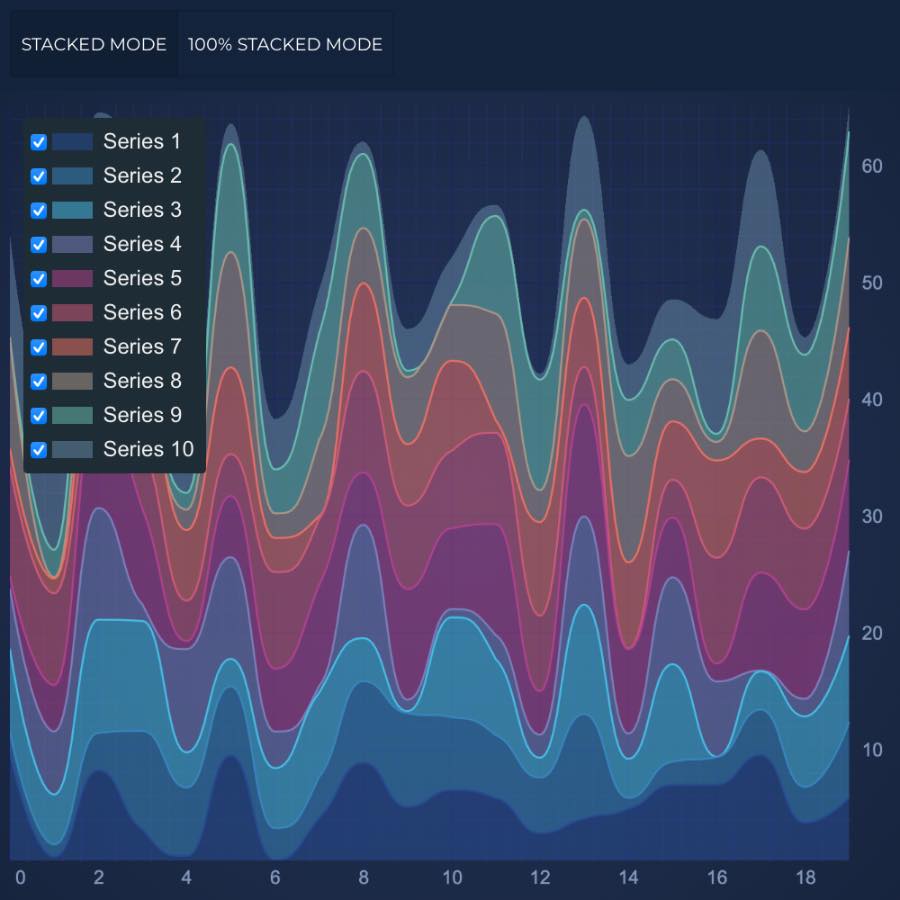
JavaScript Smooth Stacked Mountain Chart
Design a high performance JavaScript Stacked Mountain Chart with SciChart.js - your one-stop JavaScript chart library. Get free demo now to get started.
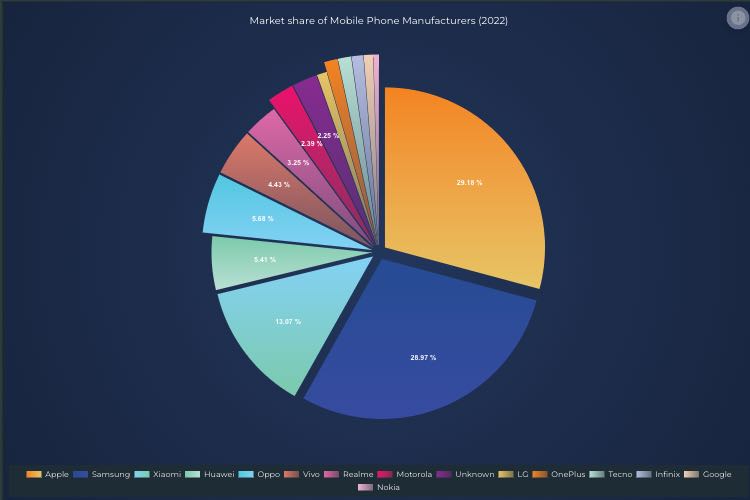
JavaScript Pie Chart
Easily create and customise a high performance JavaScript Pie Chart with 5-star rated SciChart.js. Get your free trial now to access the whole library.
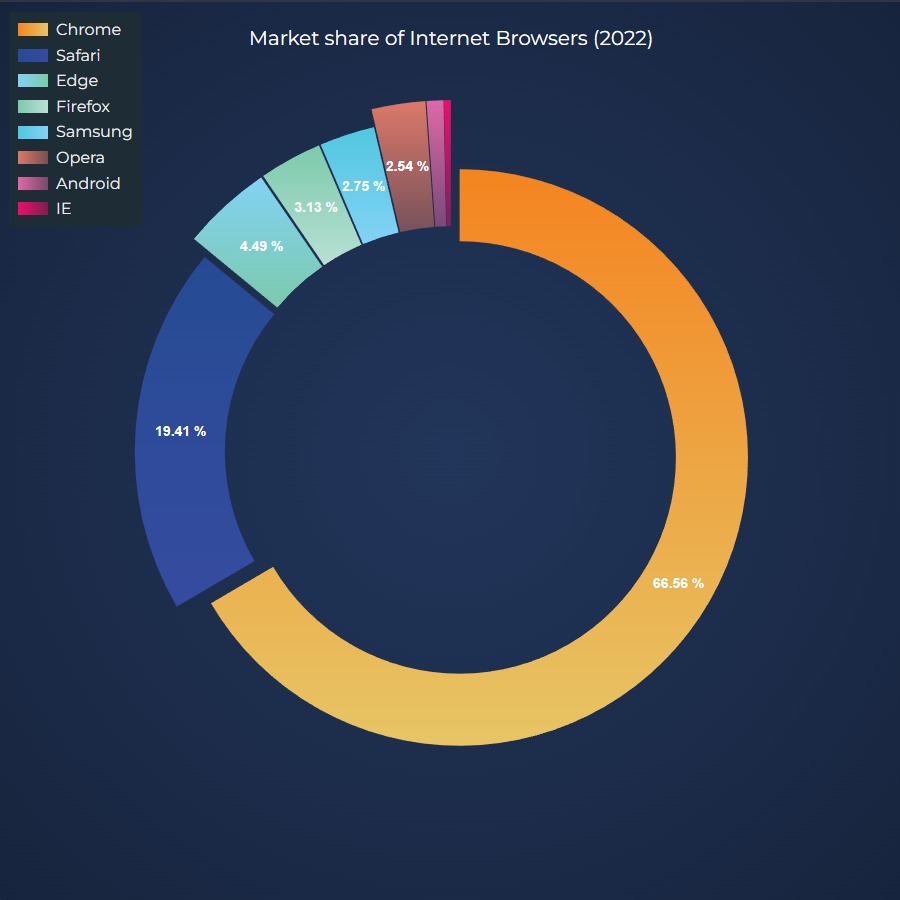
JavaScript Donut Chart
Create JavaScript Donut Chart with 5-star rated SciChart.js chart library. Supports legends, text labels, animated updates and more. Get free trial now.
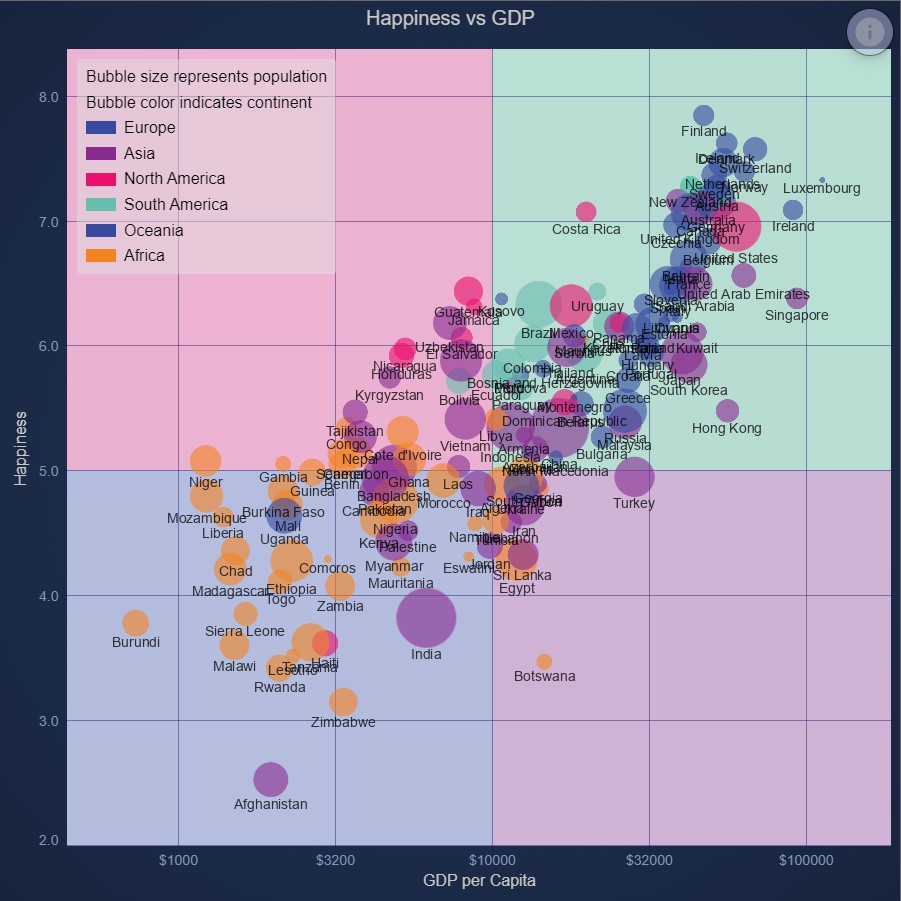
JavaScript Quadrant Chart using Background Annotations
Demonstrates how to color areas of the chart surface using background Annotations using SciChart.js Annotations API
2D Charts: Chart Annotations (7 Demos)
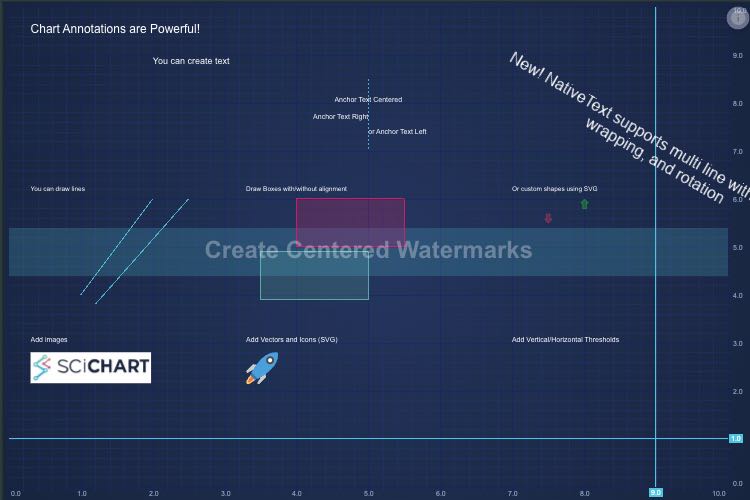
JavaScript Chart Annotations
Demonstrates how to place Annotations (lines, arrows, markers, text) over a JavaScript Chart using SciChart.js Annotations API
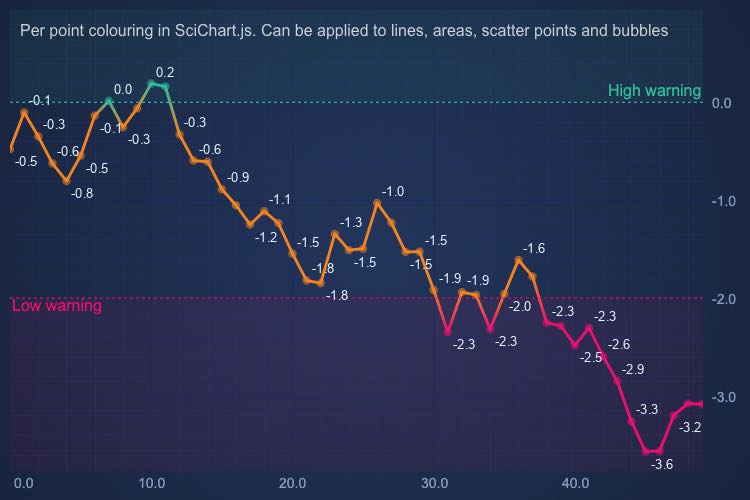
Coloring Series per-point using the PaletteProvider
Demonstrates per-point coloring in JavaScript chart types with SciChart.js PaletteProvider API

JavaScript Chart Hoverable Buy Sell Marker Annotations
Demonstrates how to place Buy/Sell arrow markers on a JavaScript Stock Chart using SciChart.js - Annotations API
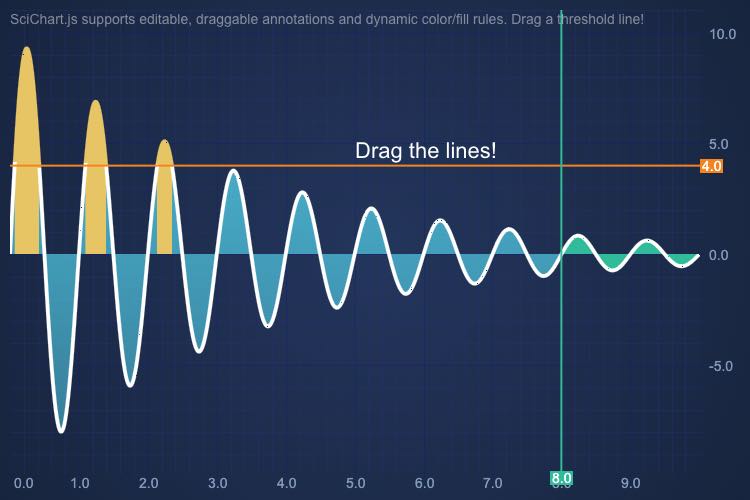
JavaScript Mountain Chart Draggable Thresholds
Demonstrates how to add draggable thresholds which change the series color in the chart in SciChart.js
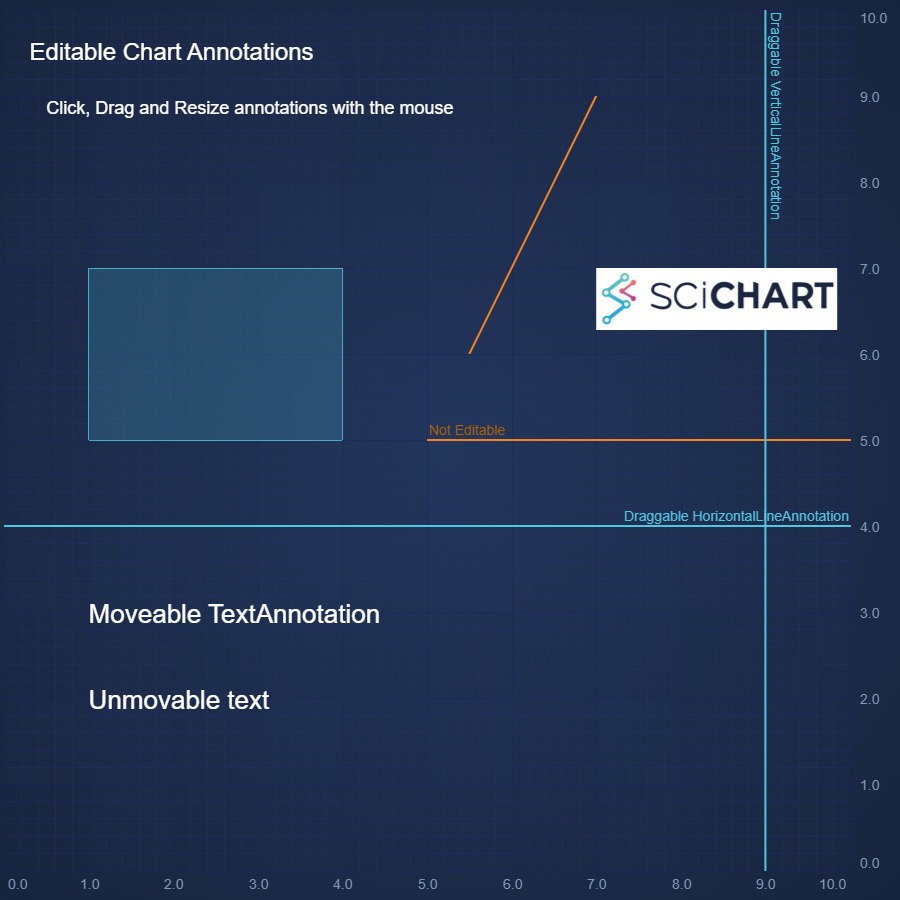
JavaScript Chart Editable Annotations
Demonstrates how to edit Annotations (shapes, boxes, lines, text, horizontal and vertical line) over a JavaScript Chart using SciChart.js Annotations API

JavaScript Quadrant Chart using Background Annotations
Demonstrates how to color areas of the chart surface using background Annotations using SciChart.js Annotations API
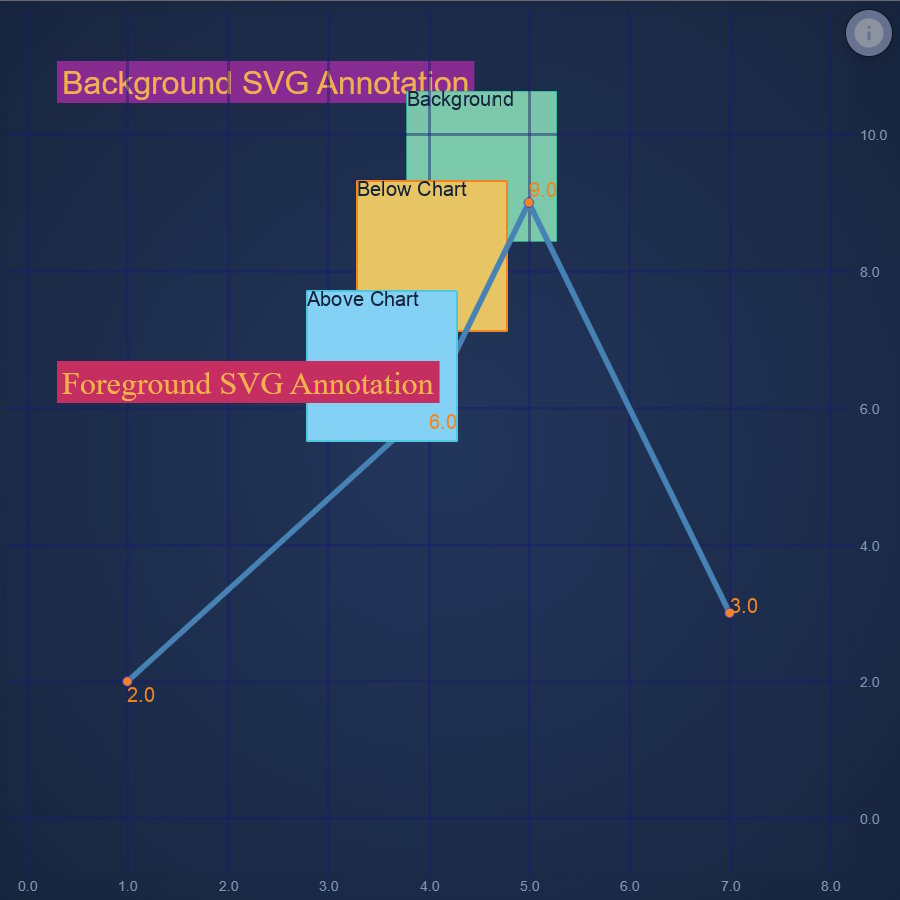
JavaScript Chart Annotation Layers
Demonstrates how layering works a JavaScript Chart using SciChart.js Annotations API
2D Charts: Chart Legends (1 Demo)
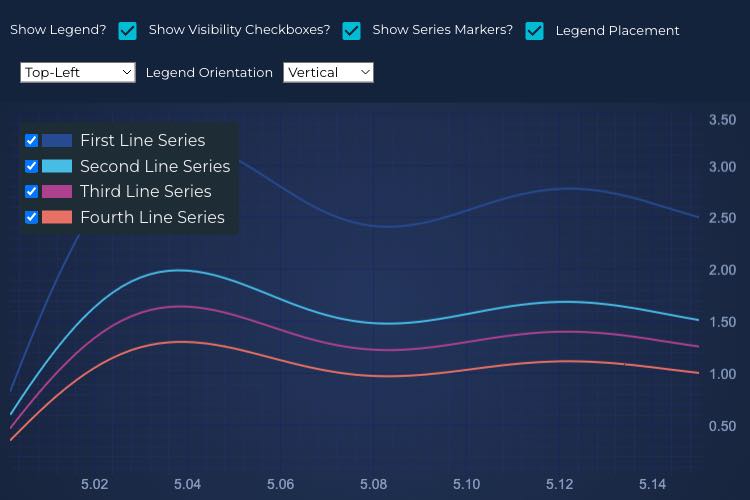
Chart Legends API
Demonstrates how to add a Legends to a JavaScript Line Chart using SciChart.js. The legend is created when you add a LegendModifier type to the sciChartSurface.chartModifiers collection.
2D Charts: Chart Axis APIs (10 Demos)
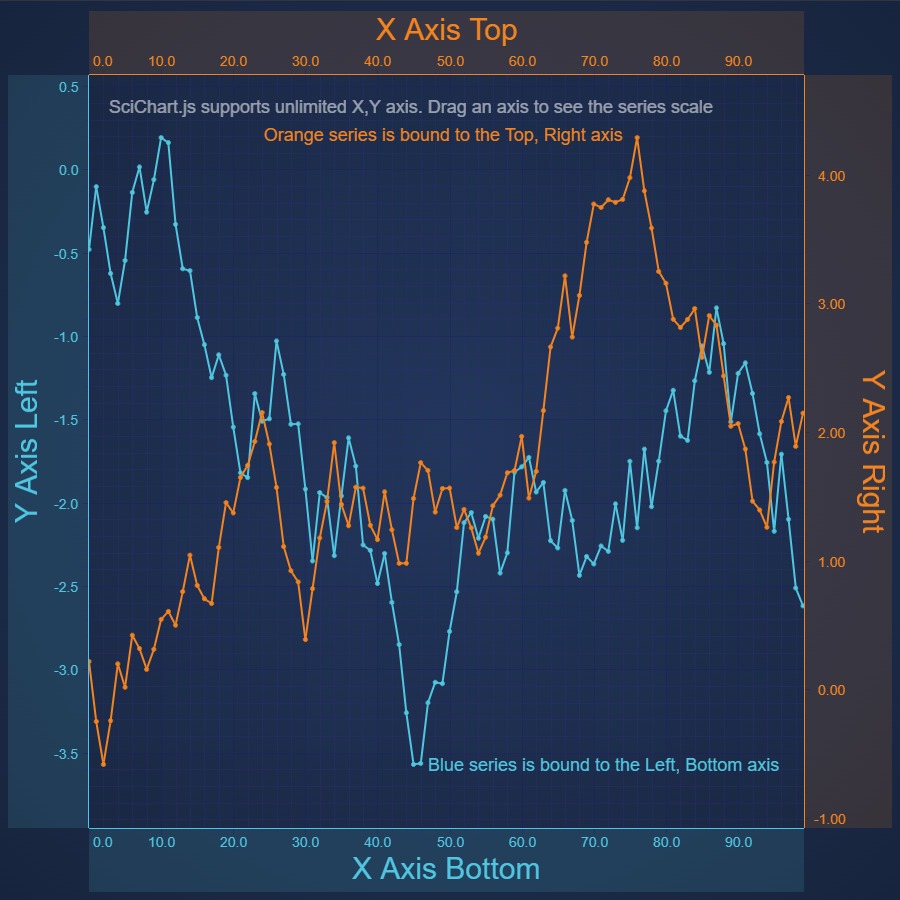
JavaScript Chart with Multiple X Axes
Demonstrates Multiple X & Y Axis on a JavaScript Chart using SciChart.js. SciChart supports unlimited left, right, top, bottom X, Y axis with configurable alignment and individual zooming, panning
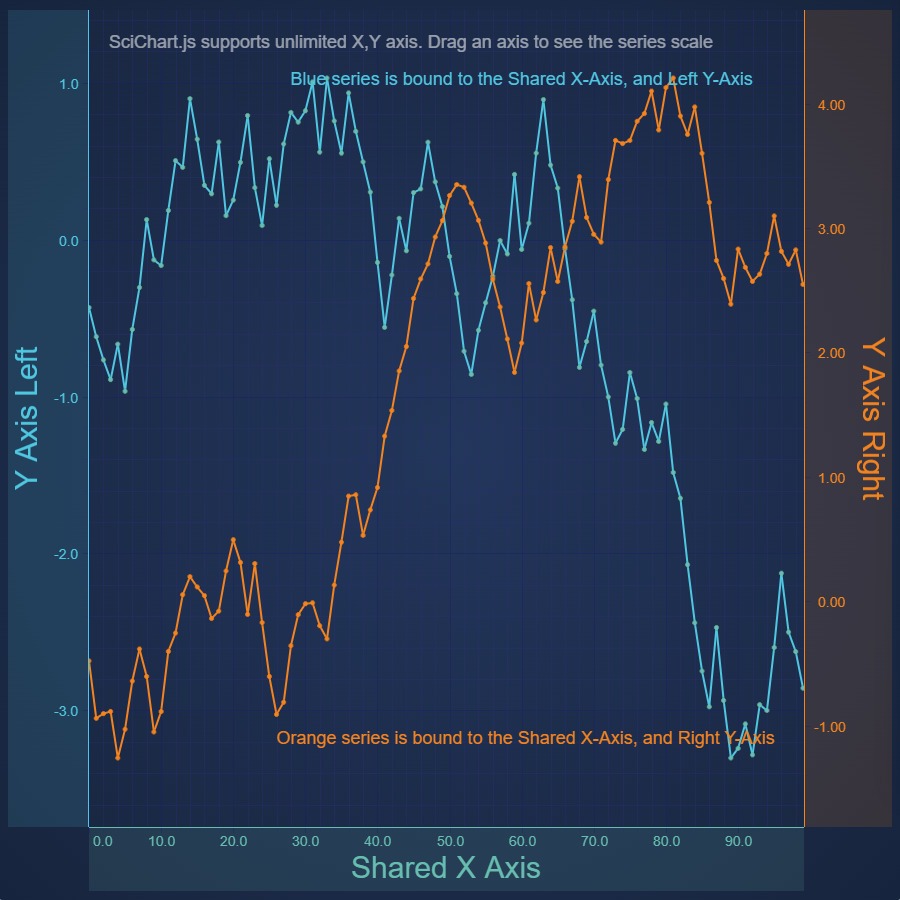
JavaScript Chart with Secondary Y Axes
Demonstrates Secondary Y Axis on a JavaScript Chart using SciChart.js. SciChart supports unlimited, multiple left, right, top, bottom X, Y axis with configurable alignment and individual zooming, panning
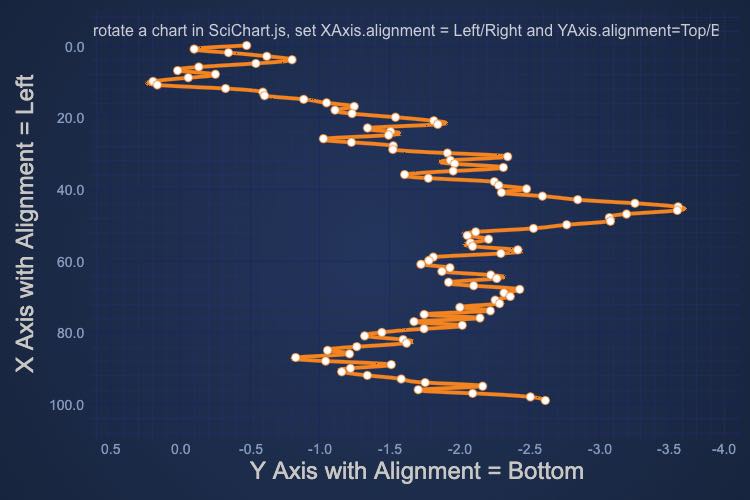
JavaScript Vertical Charts
Demonstrates alignment of Axis to create a vertical chart with SciChart.js - JavaScript Charts.

JavaScript Chart with Central Axes
Demonstrates Central Axes on a JavaScript Chart using SciChart.js. SciChart supports unlimited left, right, top, bottom X, Y axis with configurable layout
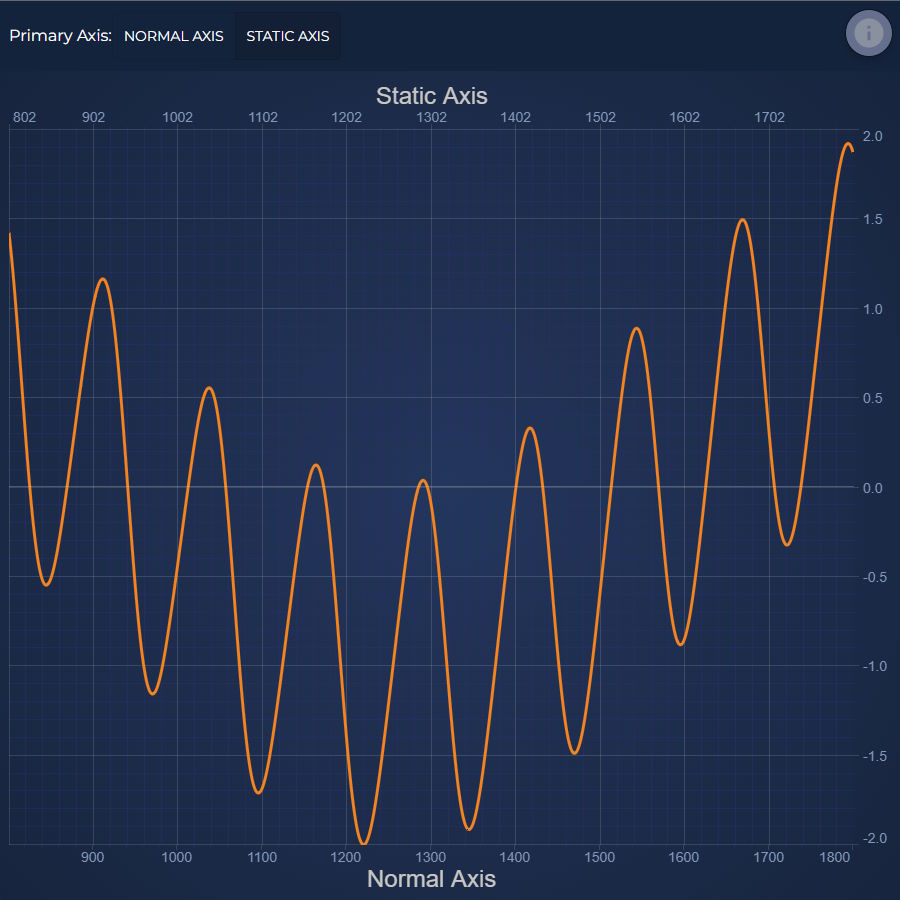
JavaScript Chart with Static X Axis
Demonstrates isStaticAxis on a JavaScript Chart using SciChart.js.

JavaScript Chart with Vertically Stacked Axes
Demonstrates Vertically Stacked Axes on a JavaScript Chart using SciChart.js, allowing data to overlap

JavaScript Chart with Logarithmic Axis Example
Demonstrates Logarithmic Axis on a JavaScript Chart using SciChart.js. SciChart supports logarithmic axis with scientific or engineering notation and positive and negative values
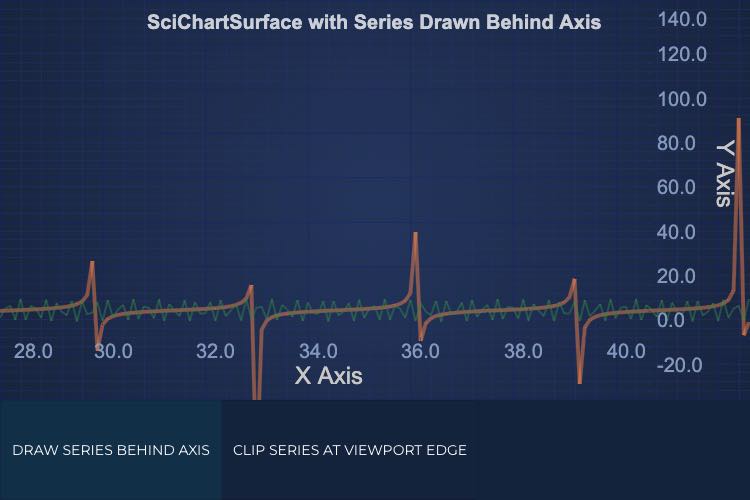
Draw JavaScript Chart Behind Axis
Demonstrates the option of the transparent Axes customization on a JavaScript Chart using SciChart.js.
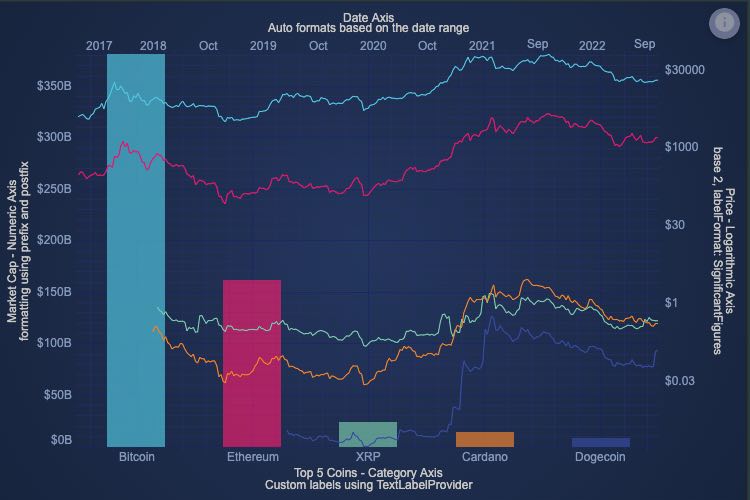
Axis Types
Demonstrates how to use arbitrary text for axis labels, rather than formatted data values, using the new TextLabelProvider
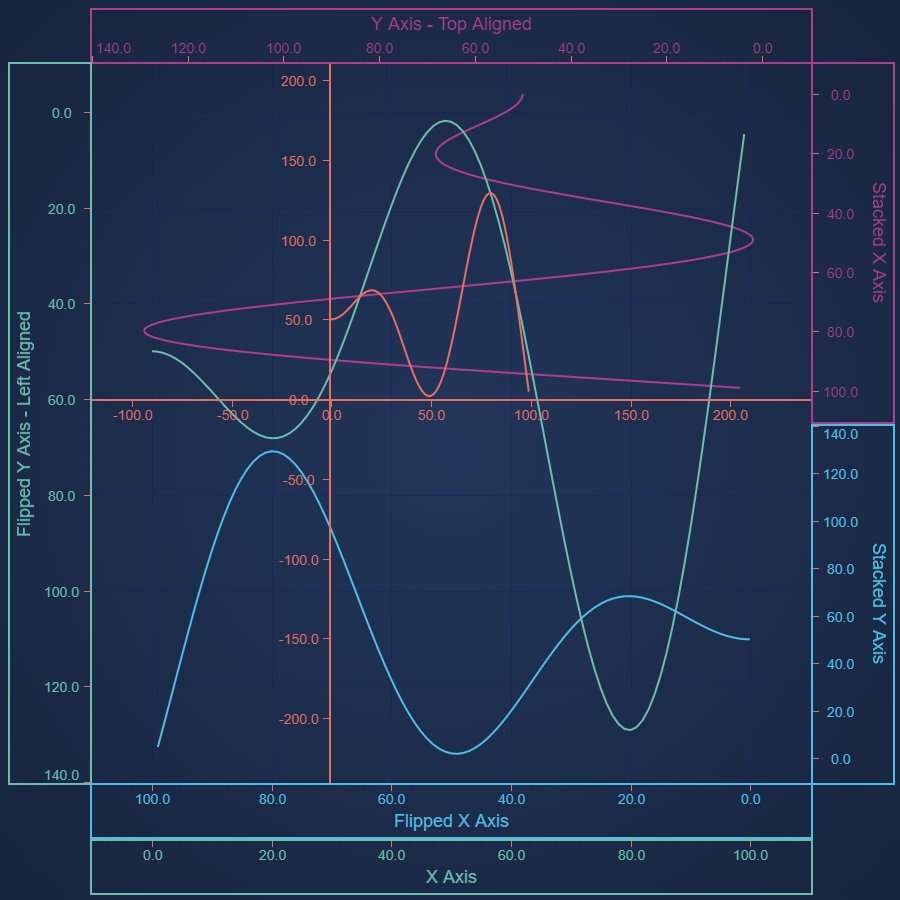
JavaScript Chart Axis Layout Options
Demonstrates outer, inner, central and stacked axes, and use of axis alignment to create vertical charts
2D Charts: Axis Label Customization (3 Demos)
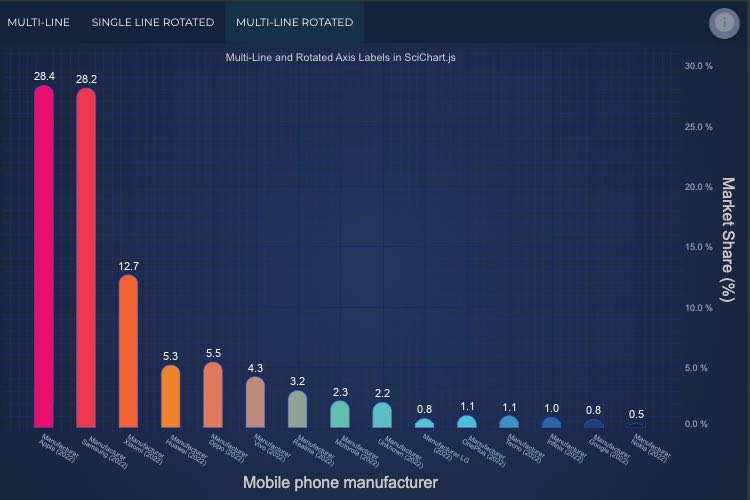
Multi-line and Rotated Text labels
Demonstrates how to use arbitrary text for axis labels, rather than formatted data values, using the new TextLabelProvider
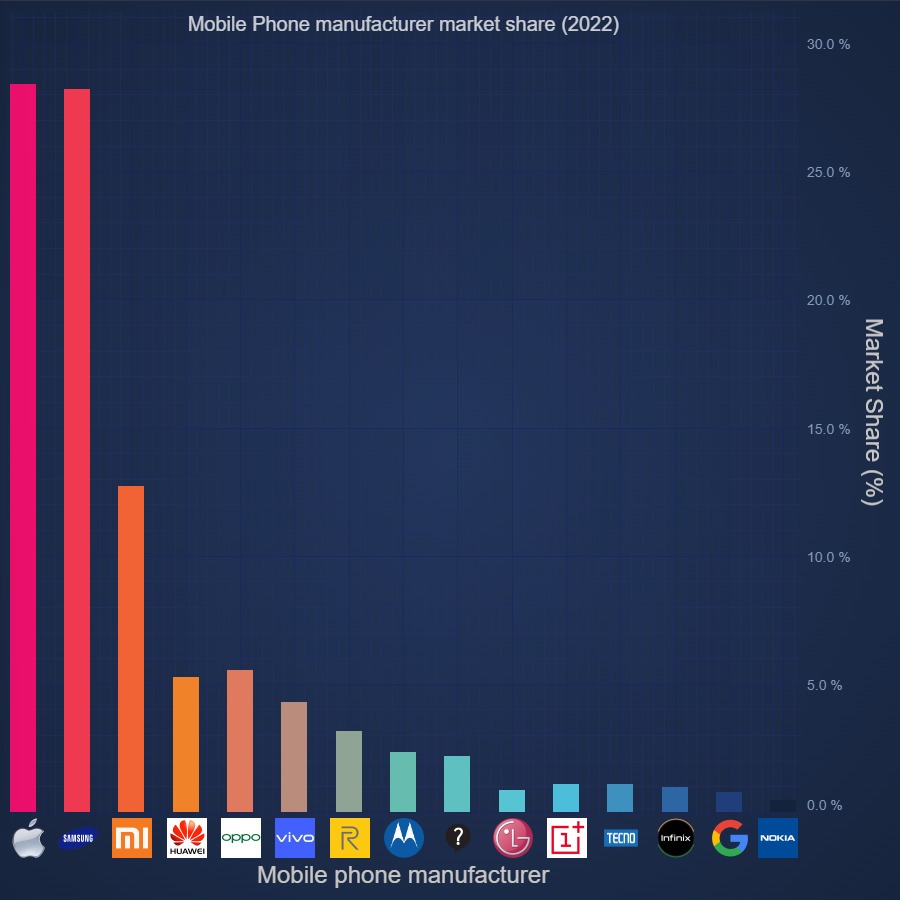
Image labels
Demonstrates how to use Images as Axis Labels
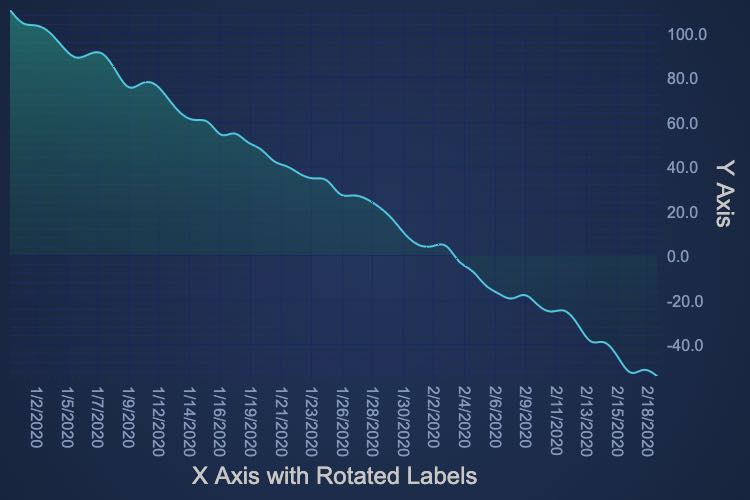
Rotated Labels and Alignment
Rotate to create vertical axis labels and fit more on an axis
2D Charts: Styling and Theming (11 Demos)
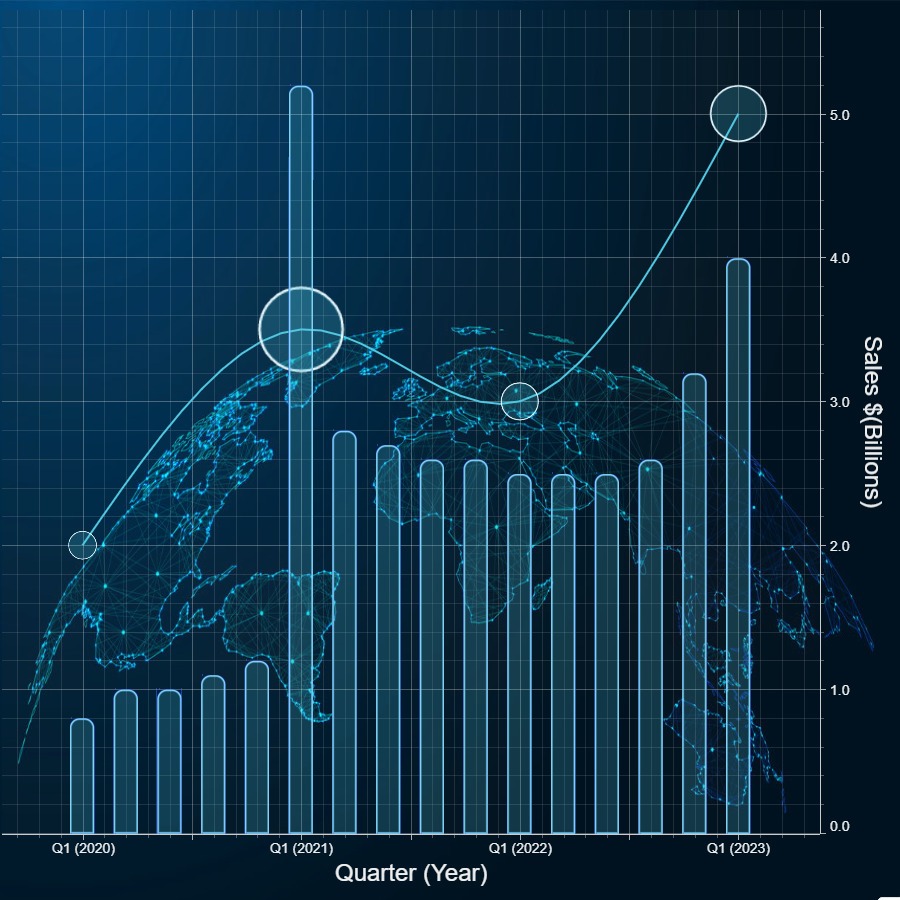
Background Image with Transparency
Demonstrates how to create a JavaScript Chart with background image using transparency in SciChart.js
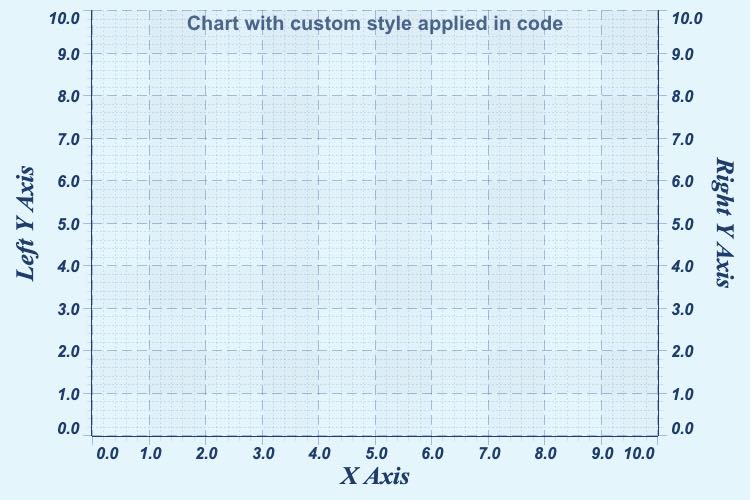
Styling a JavaScript Chart in Code
Demonstrates how to style a JavaScript Chart entirely in code with SciChart.js themeing API
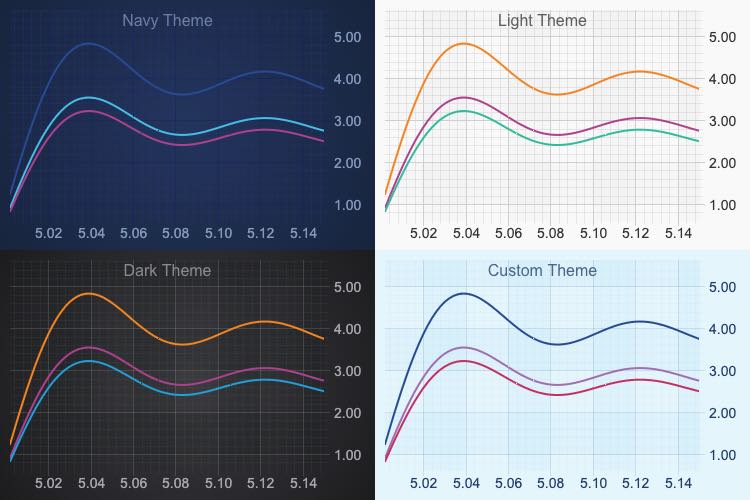
Using Theme Manager in JavaScript Chart
Demonstrates our Light and Dark Themes for JavaScript Charts with SciChart.js ThemeManager API
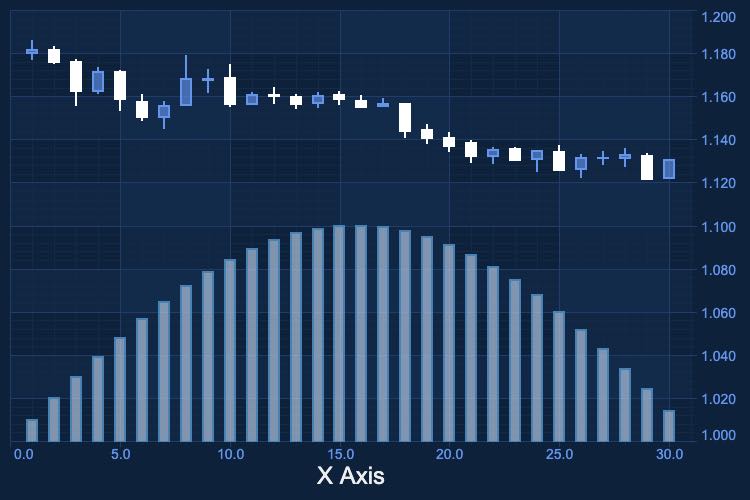
Create a Custom Theme for JavaScript Chart
Demonstrates how to create a Custom Theme for a SciChart.js JavaScript Chart using our Theming API

Coloring Series per-point using the PaletteProvider
Demonstrates per-point coloring in JavaScript chart types with SciChart.js PaletteProvider API
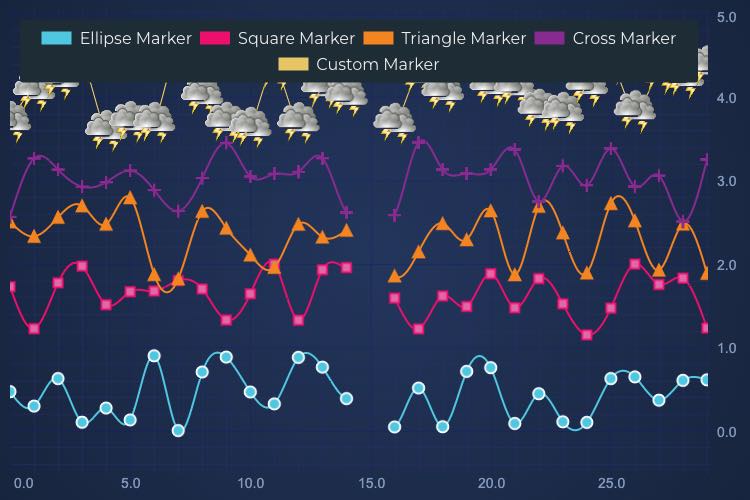
JavaScript Point-Markers Chart
Demonstrates the different point-marker types for JavaScript Scatter charts (Square, Circle, Triangle and Custom image point-marker)
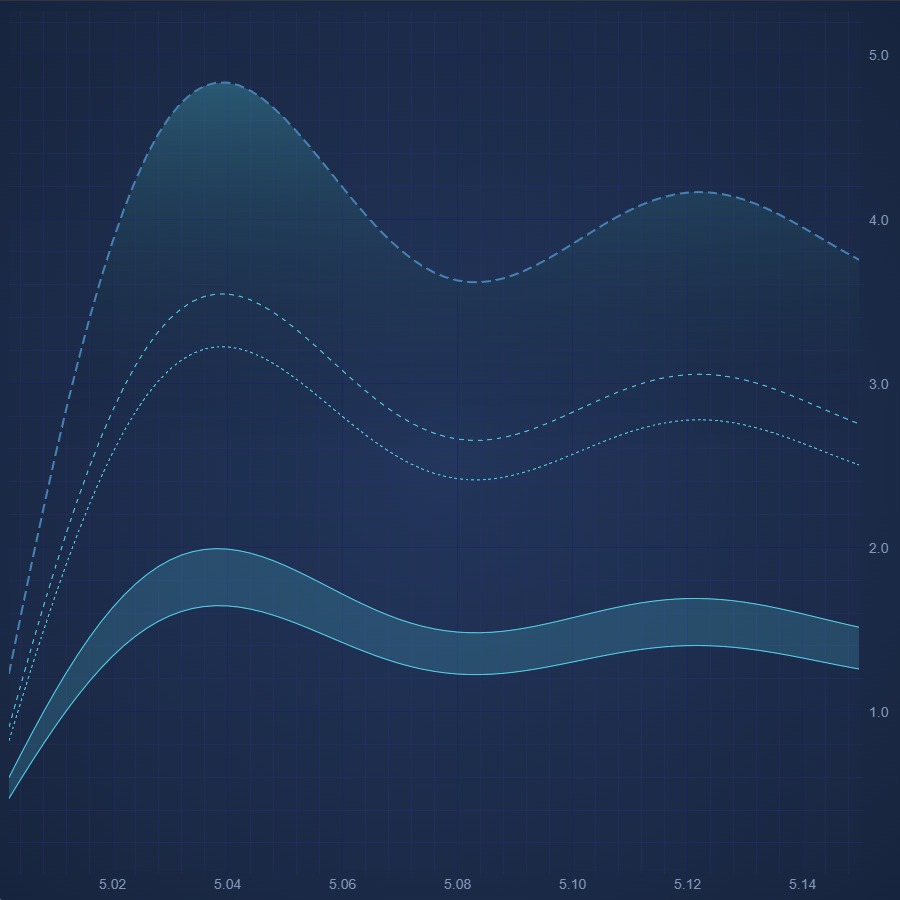
Dashed Line Styling
Demonstrates dashed line series in JavaScript Charts with SciChart.js
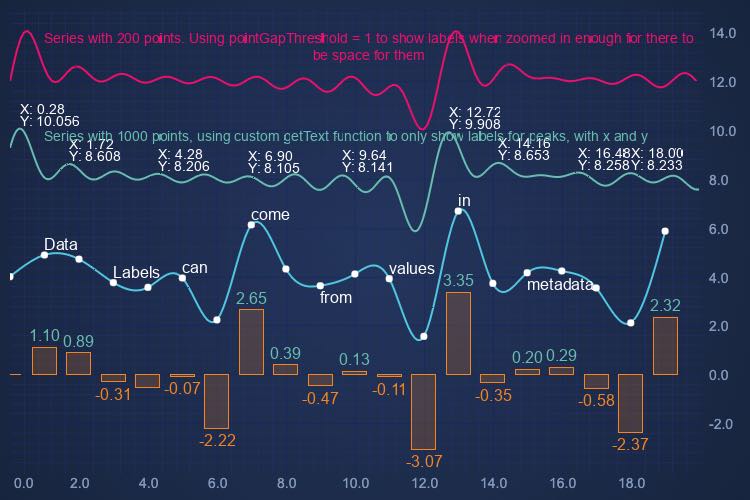
Data Labels
Show data labels on JavaScript Chart. Get your free demo now.
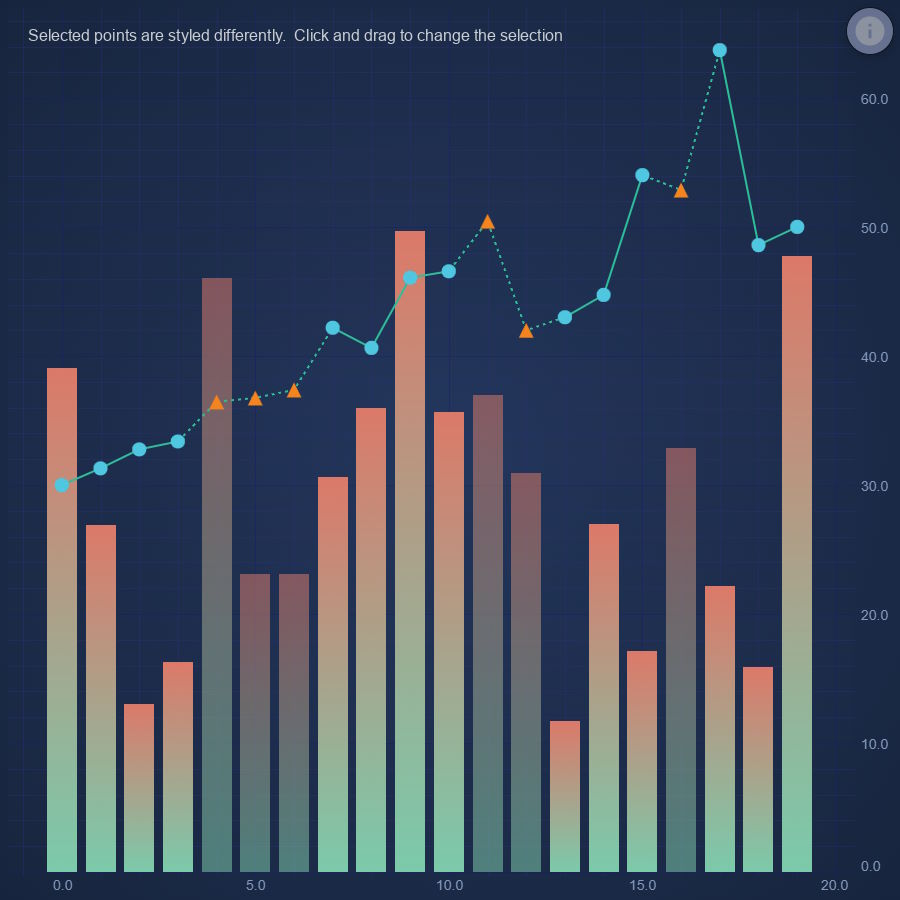
JavaScript Chart with Multi-Style Series
Demonstrates how to apply multiple different styles to a single series using RenderDataTransform
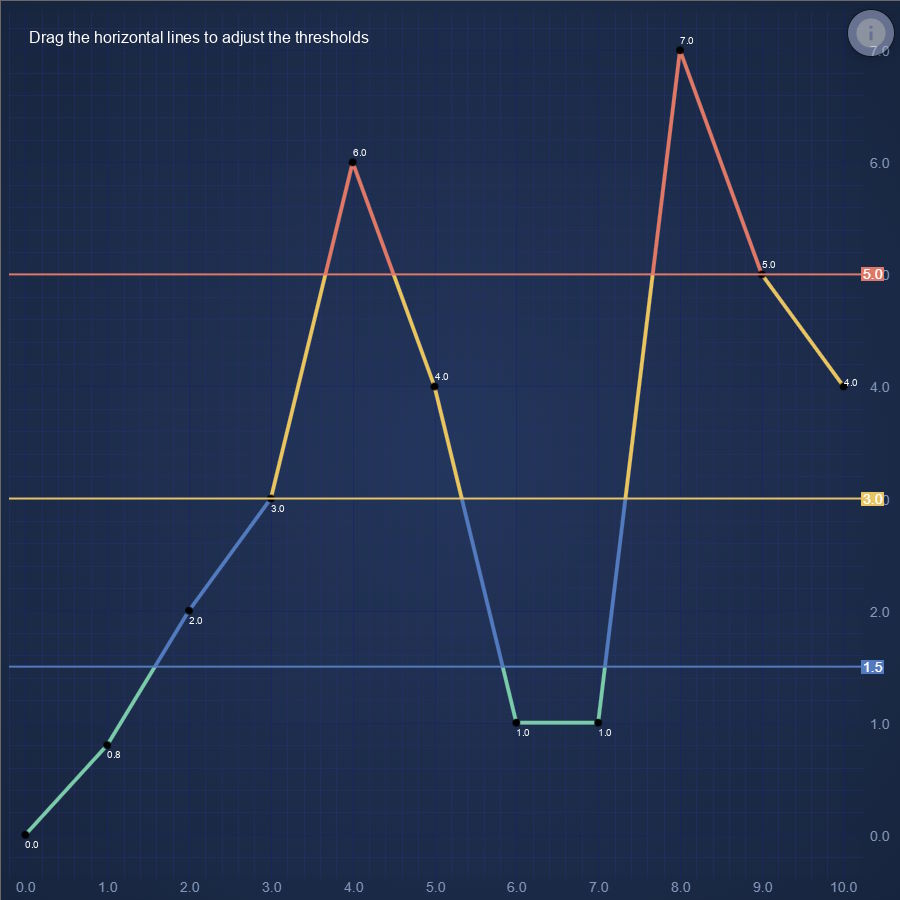
JavaScript Chart with lines split by thresholds
Demonstrates how to use a RenderDataTransform to split lines into multiple segments so they can be individually colored according to thresholds
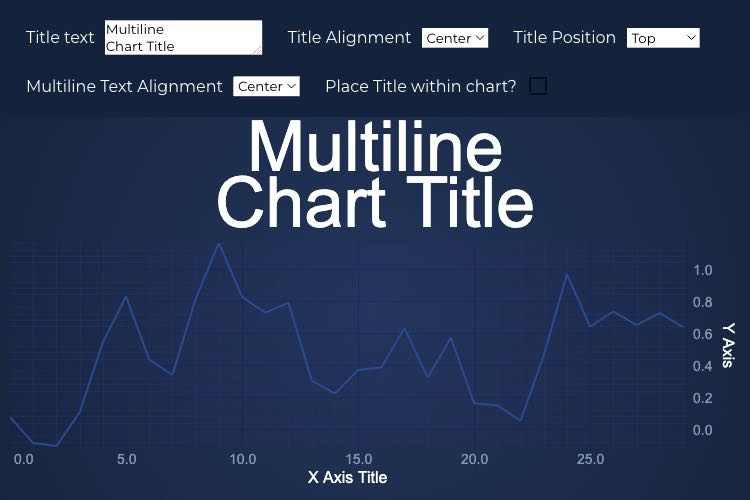
JavaScript Chart Title
Demonstrates chart title with different position and alignment options
2D Charts: Tooltips and Hit-Test (7 Demos)
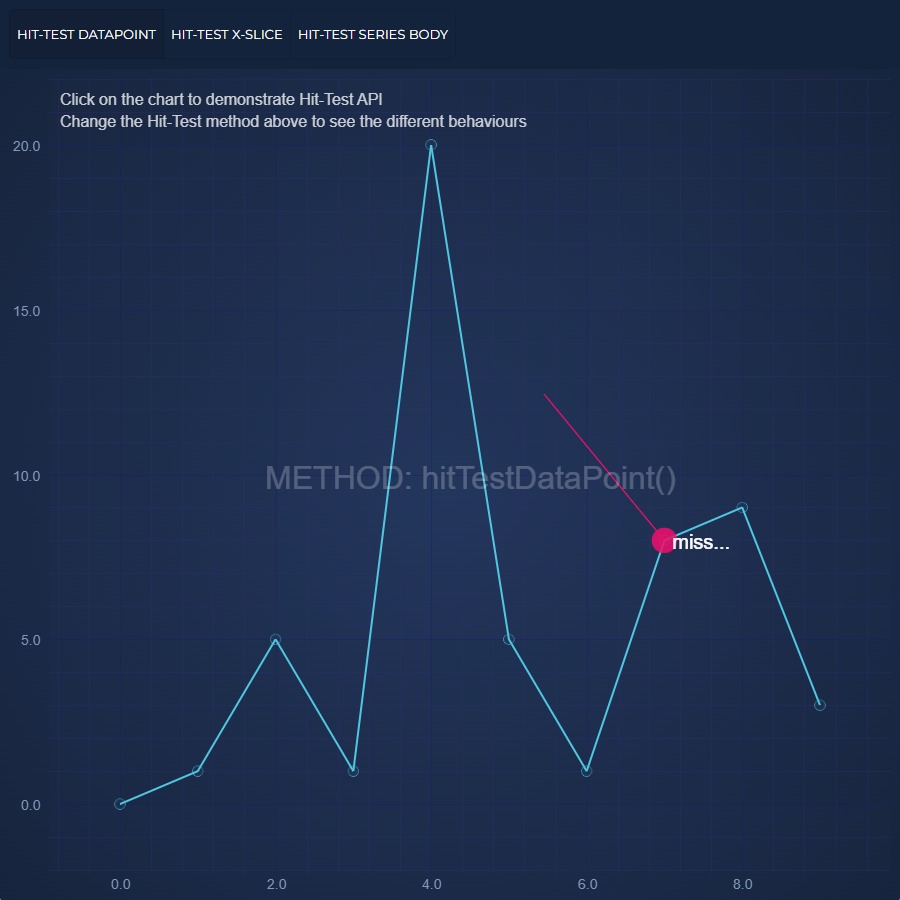
JavaScript Chart Hit-Test API
Demonstrates Hit-Testing a JavaScript Chart - point and click on the chart and get feedback about what data-points were clicked
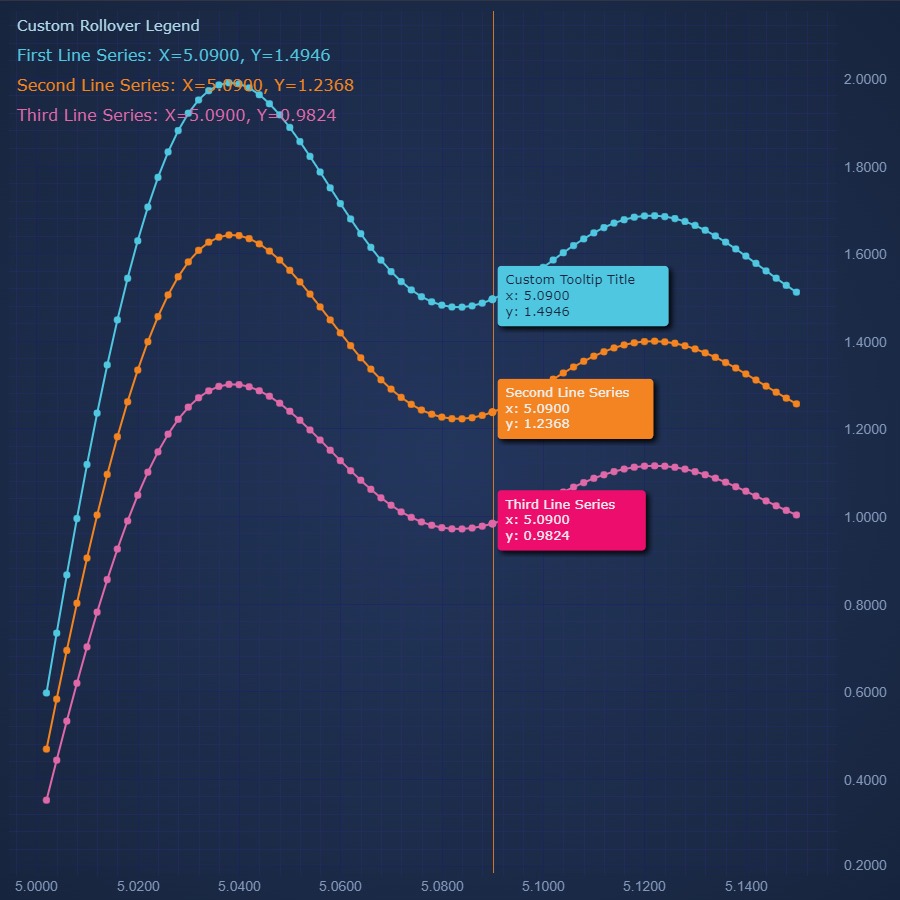
Using Rollover Modifier Tooltips
Demonstrates adding Tooltips on mouse-move to a JavaScript Chart with SciChart.js RolloverModifier
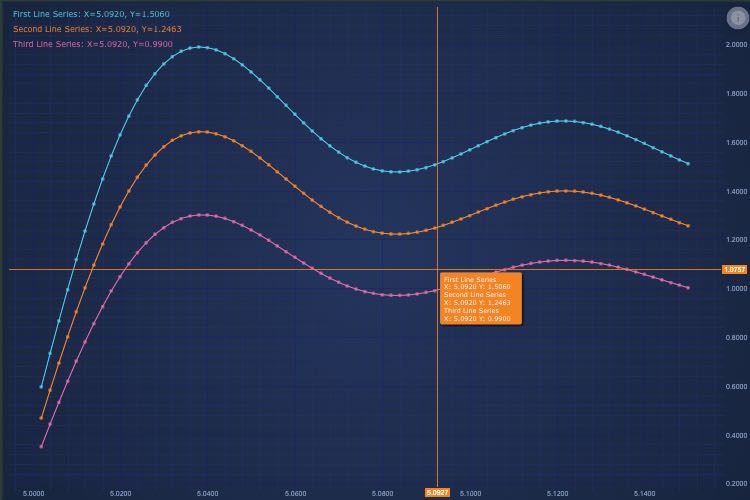
Using CursorModifier Crosshairs
Demonstrates adding a Cursor (Crosshair) to a JavaScript Chart with SciChart.js CursorModifier
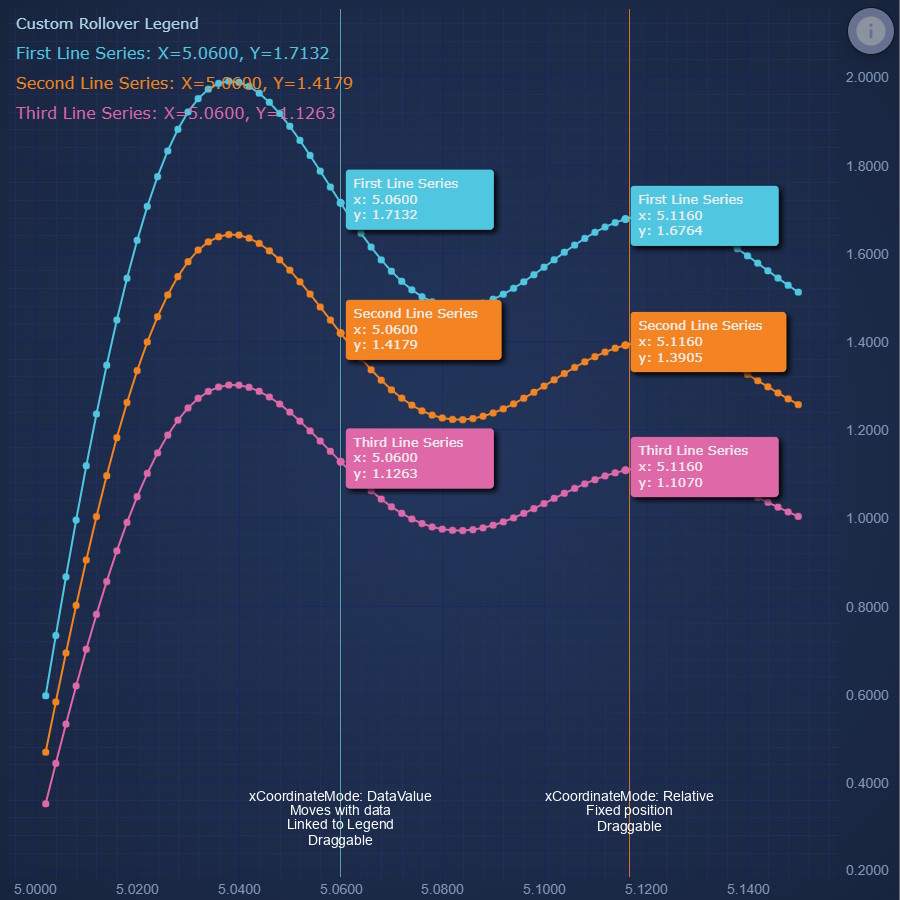
Using VerticalSliceModifier
Demonstrates adding Tooltips at certain positions to a JavaScript Chart with SciChart.js VerticalSliceModifier
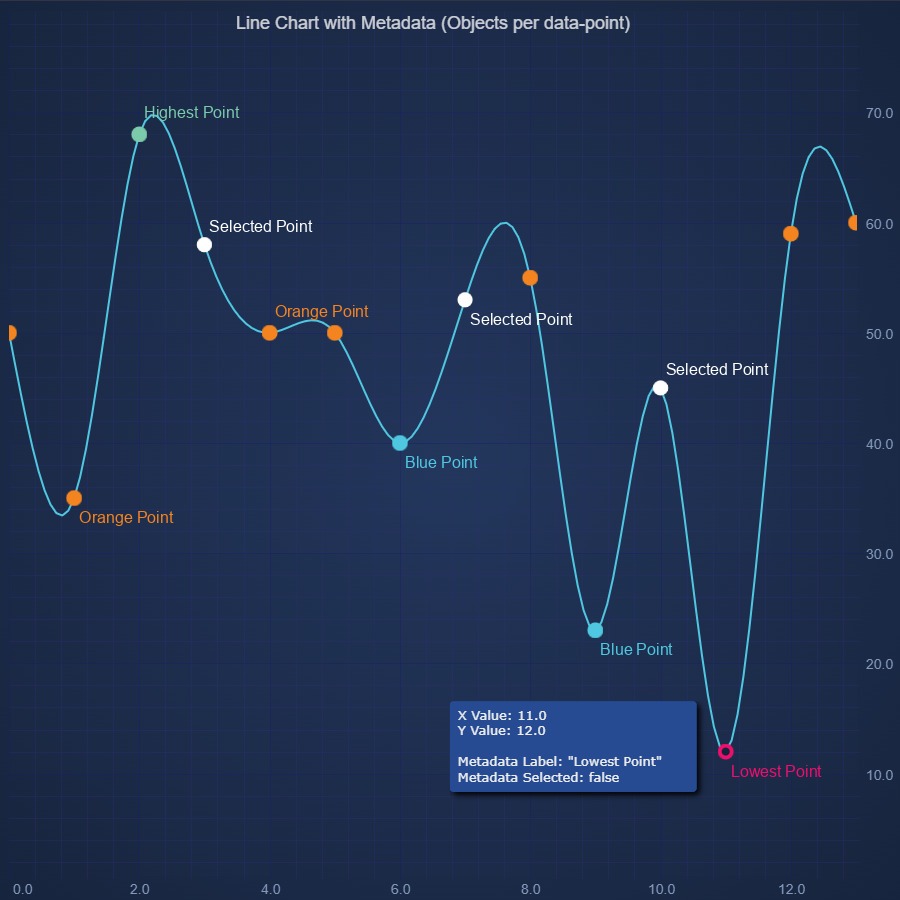
Datapoint Metadata Tooltips on JavaScript Chart
Demonstrates using MetaData in a JavaScript Chart - add custom data to points for display or to drive visual customisation
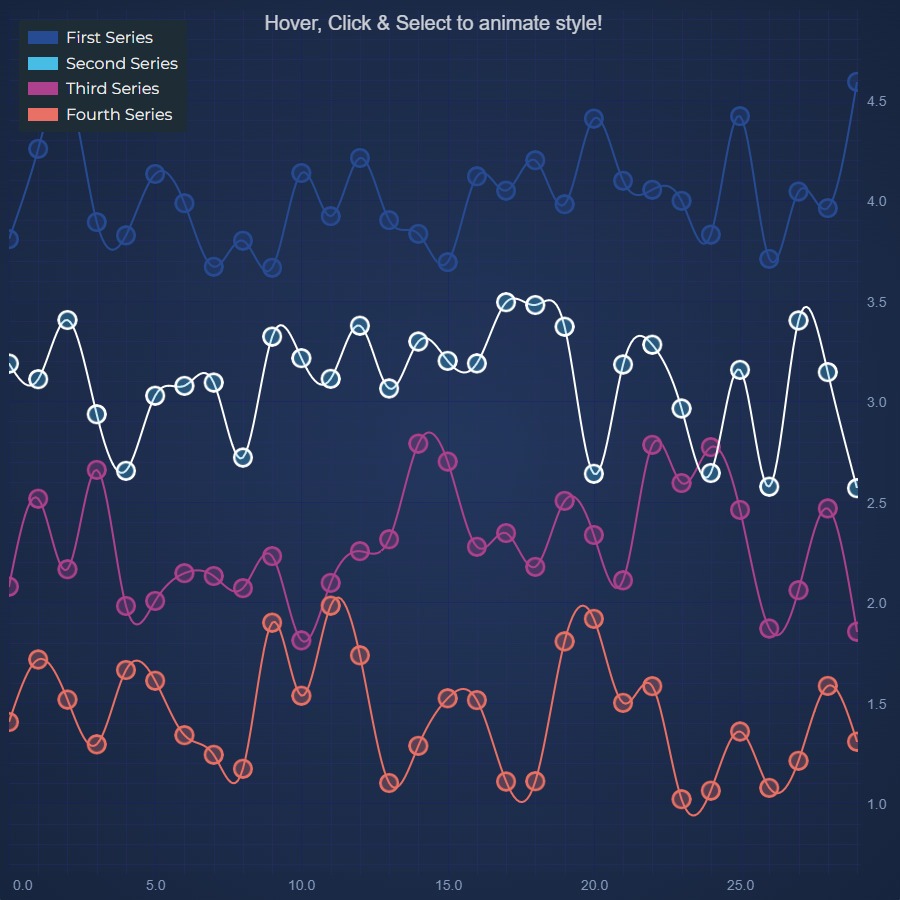
Using Series Selection
Demonstrates Hit-Testing a JavaScript Chart - point and click on the chart and get feedback about what data-points were clicked
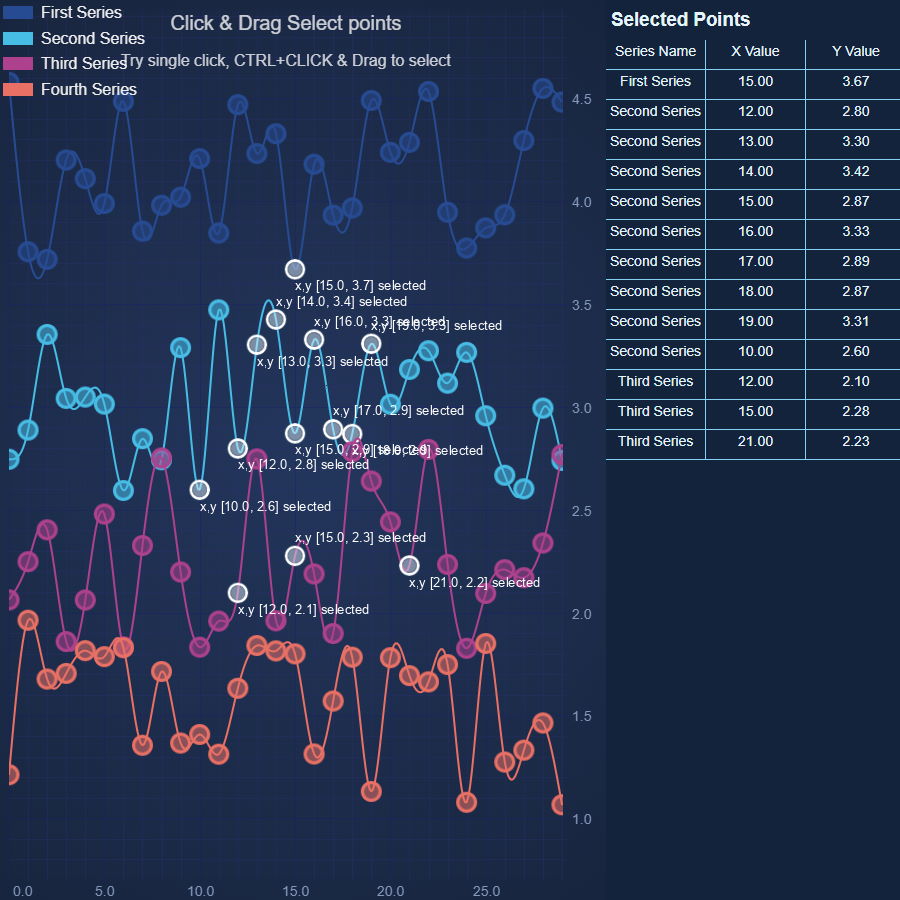
JavaScript Chart Data Point Selection
Demonstrates the DatapointSelectionModifier, which provides a UI to select one or many data points, and works with DataPointSelectionPaletteProvider to change the appearance of selected points
2D Charts: Zoom and Pan a Chart (7 Demos)

JavaScript Chart with Multiple X Axes
Demonstrates Multiple X & Y Axis on a JavaScript Chart using SciChart.js. SciChart supports unlimited left, right, top, bottom X, Y axis with configurable alignment and individual zooming, panning

JavaScript Chart with Secondary Y Axes
Demonstrates Secondary Y Axis on a JavaScript Chart using SciChart.js. SciChart supports unlimited, multiple left, right, top, bottom X, Y axis with configurable alignment and individual zooming, panning
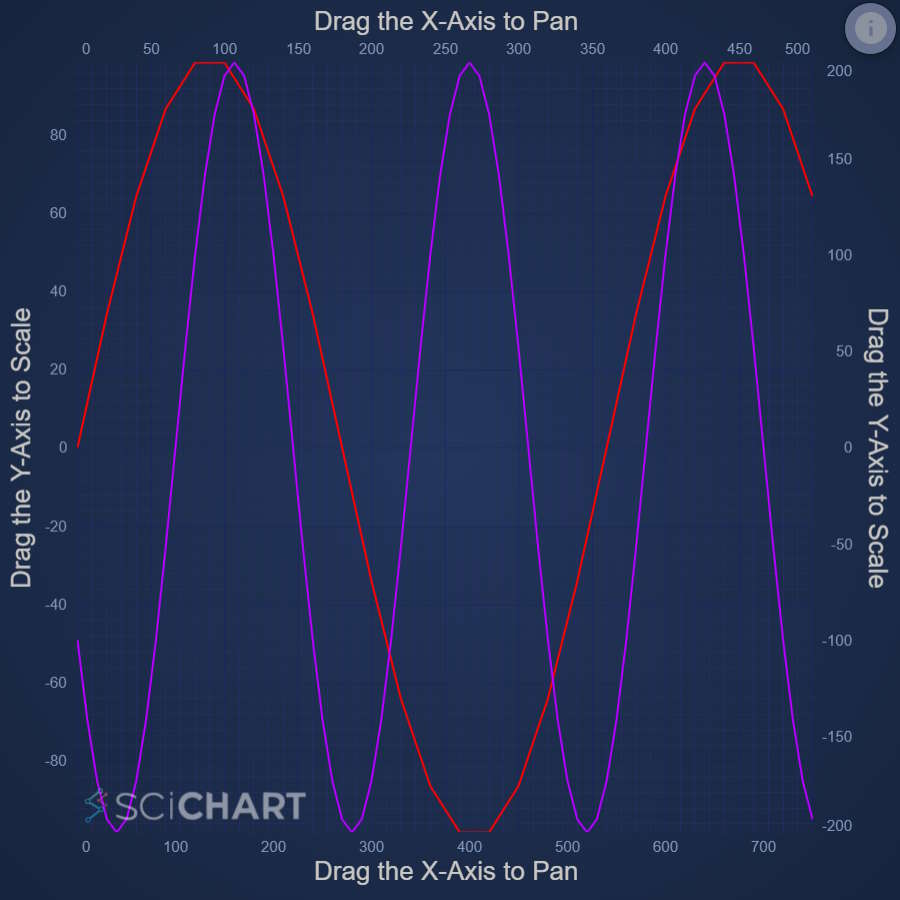
Drag JavaScript Chart Axis to Scale or Pan
Demonstrates how to Zoom, Scale or Pan individual Axis on a JavaScript Chart with SciChart.js AxisDragModifiers

Zoom and Pan a Realtime JavaScript Chart
Demonstrates how to zoom and pan a realtime JavaScript Chart while it is updating, with SciChart.js ZoomState API
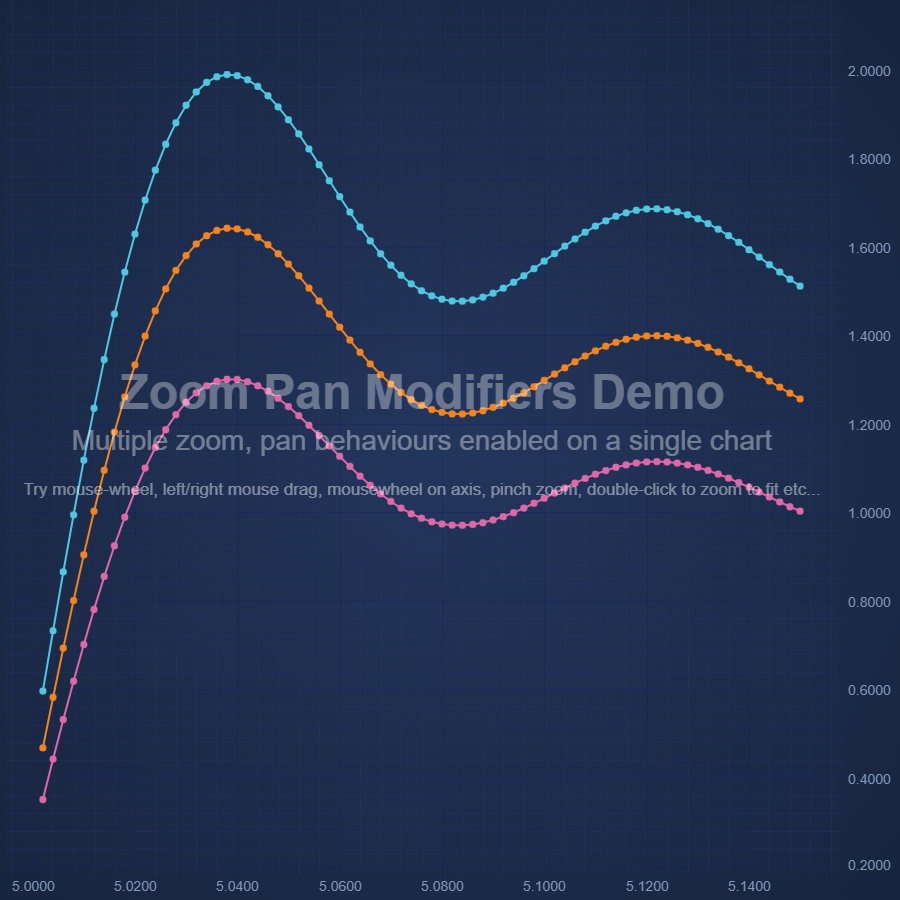
Zoom and Pan with JavaScript Chart multiple Modifiers
Demonstrates how to use multiple Zoom and Pan Modifiers on a JavaScript Chart with SciChart.js
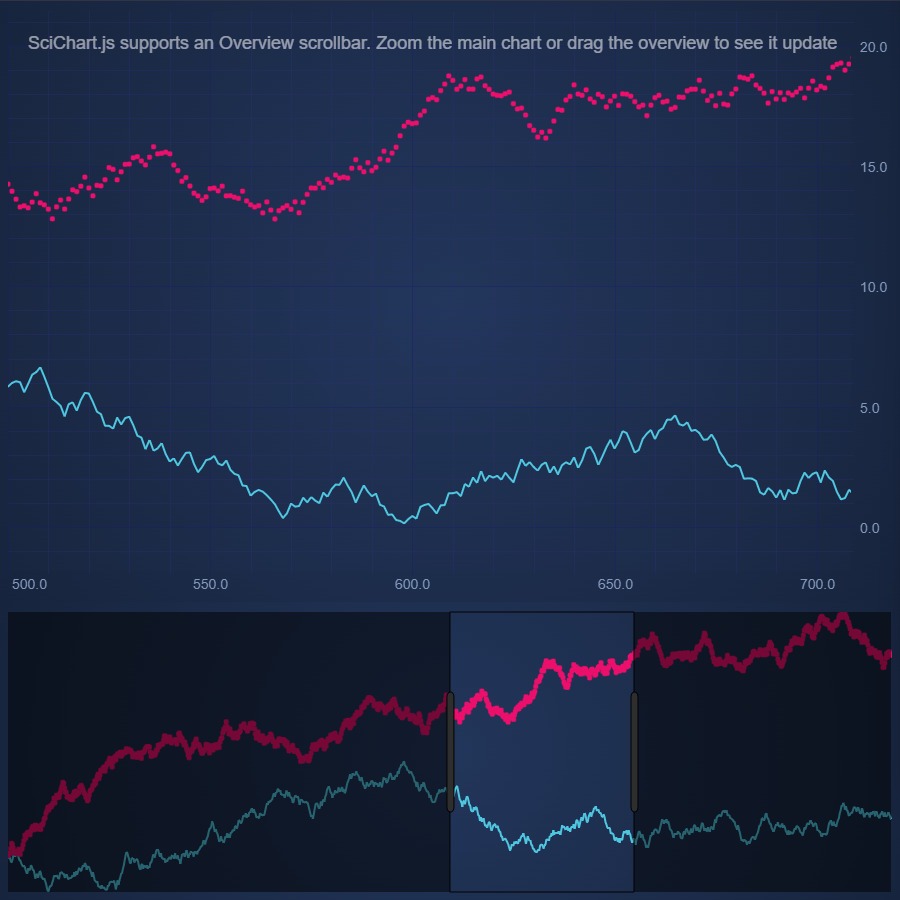
Zoom and Pan with Overview Chart
Demonstrates how to zoom and pan with an Overview Chart
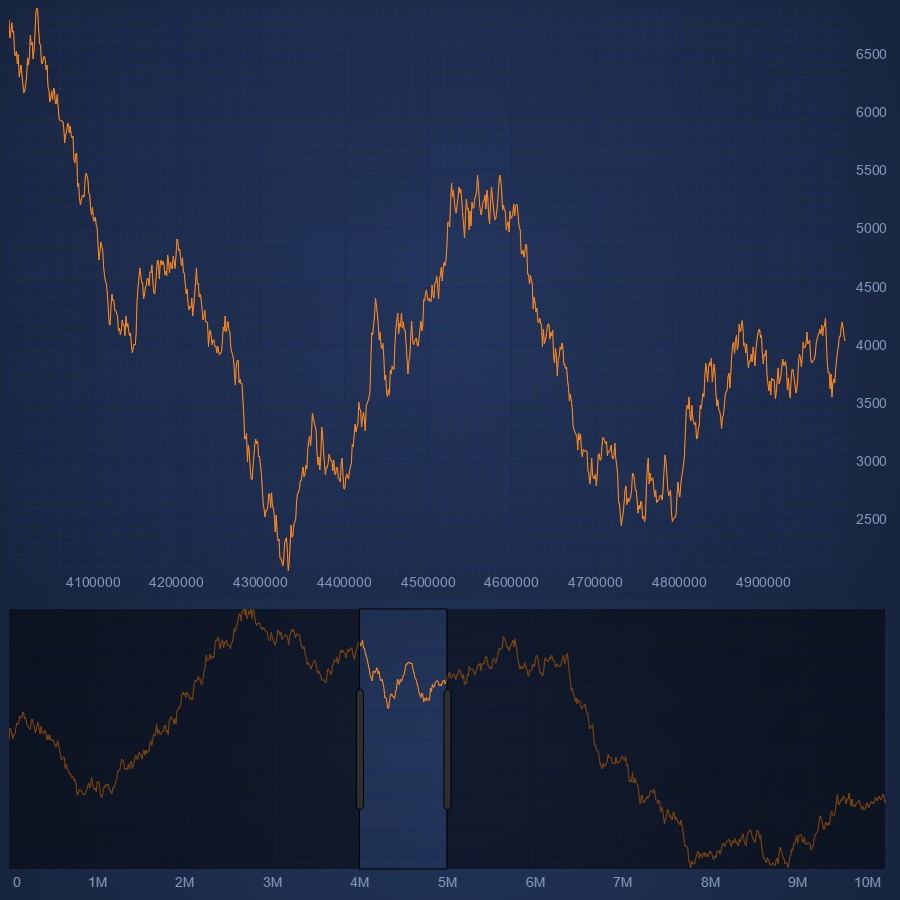
Virtualized JavaScript Charts: Load Data on Zoom/Pan
shows how to load data on zoom/pan and how to create an overview chart for this case.
2D Charts: Transforming Data with Filters (4 Demos)
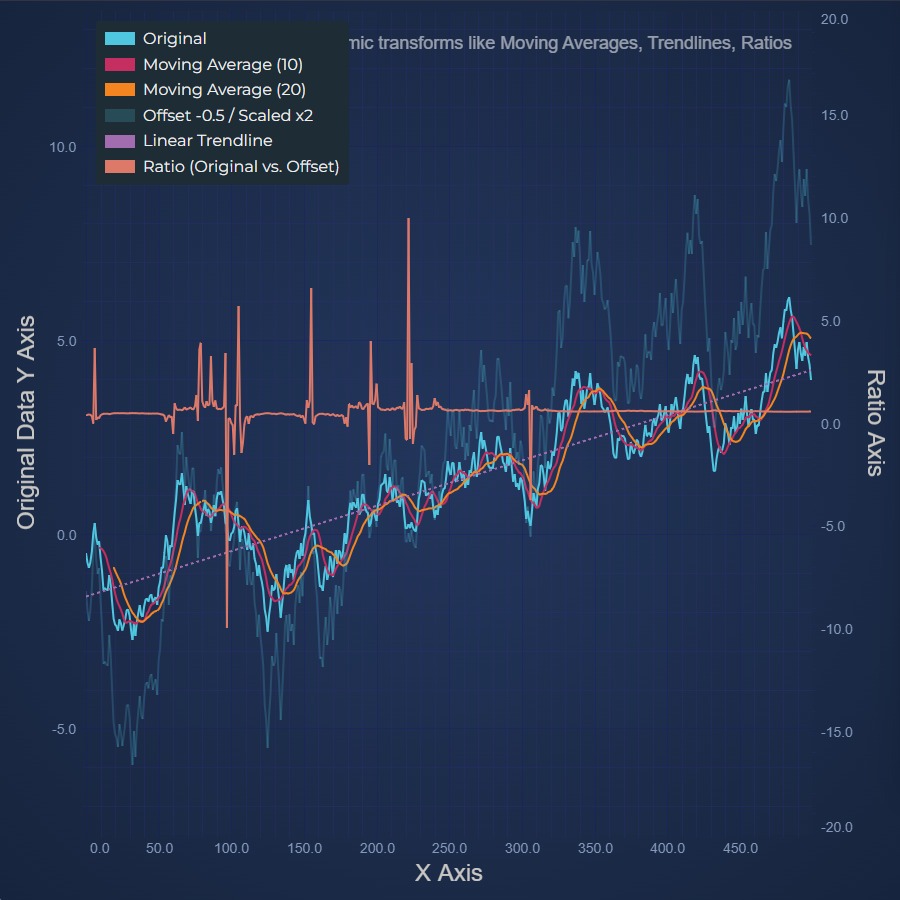
Trendline, Moving Average and Ratio Filters
Chart with Linear Trendline, Moving Average and Ratio Filters with filter chaining
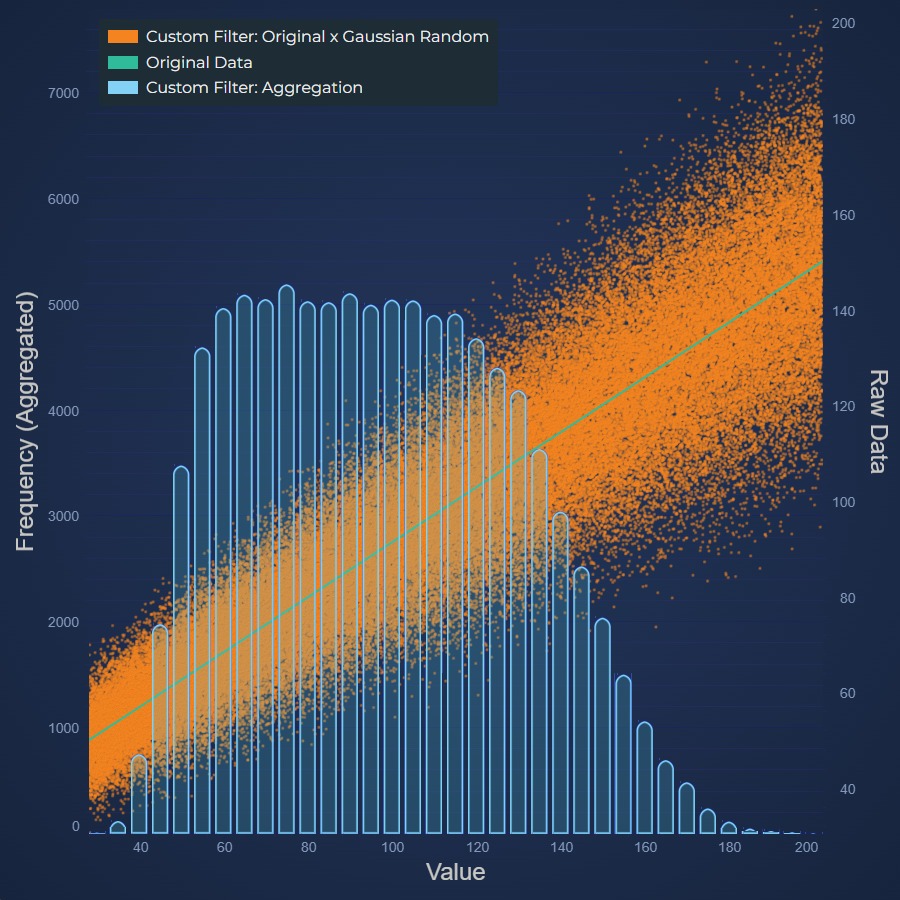
Custom Filters
Demonstrates simple and advanced Custom Filters for data transformation and aggregation, with realtime updates
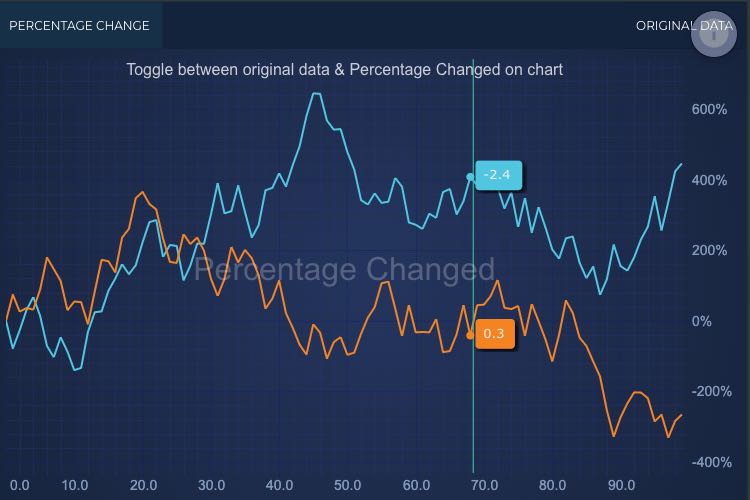
Realtime Percentage Change using Filter
How to use a ScaleOffsetFilter to convert data to a percentage change, with realtime updates, rescale on pan

JavaScript Mountain Chart Draggable Thresholds
Demonstrates how to add draggable thresholds which change the series color in the chart in SciChart.js
2D Charts: Animation API (4 Demos)
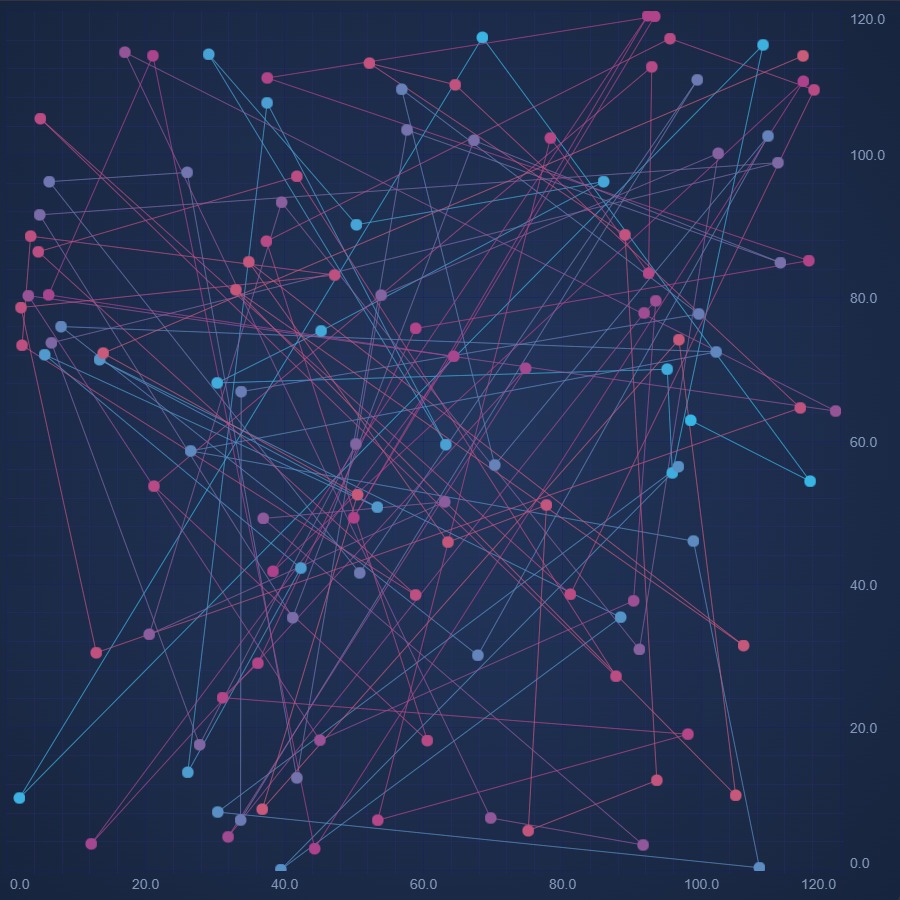
JavaScript Chart Data Animation
Demonstrates how to run Dataset Animations with JavaScript.
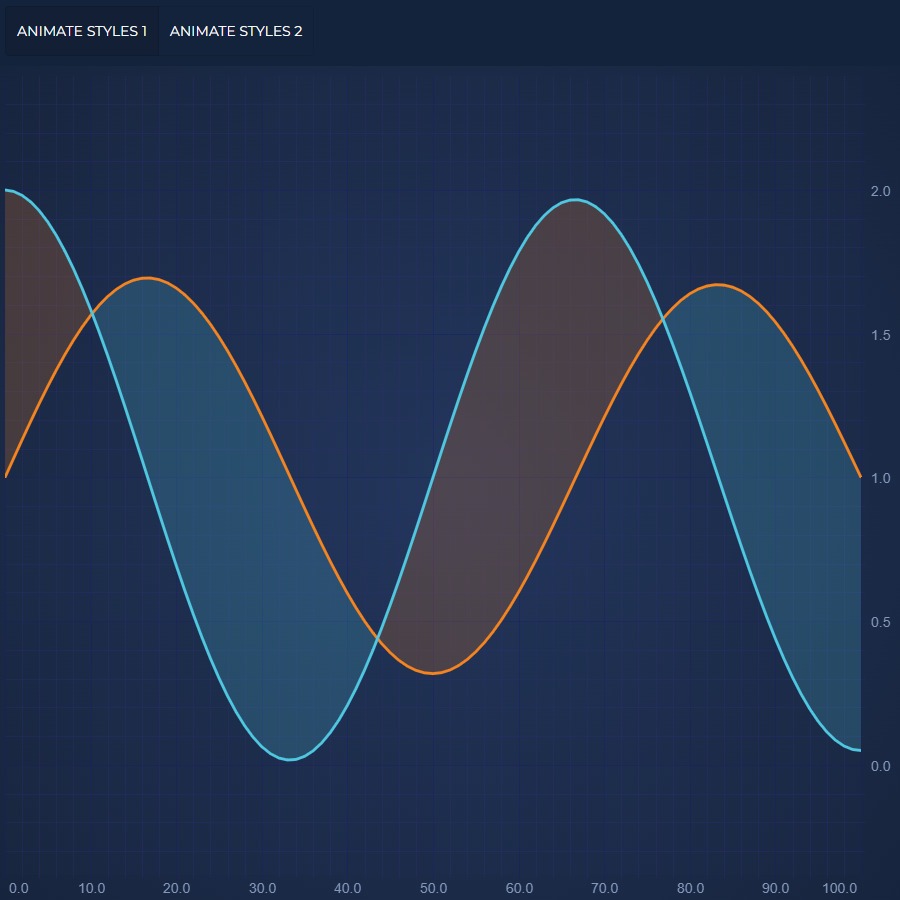
JavaScript Style Animation
Demonstrates how to run Style Transition Animations with JavaScript.
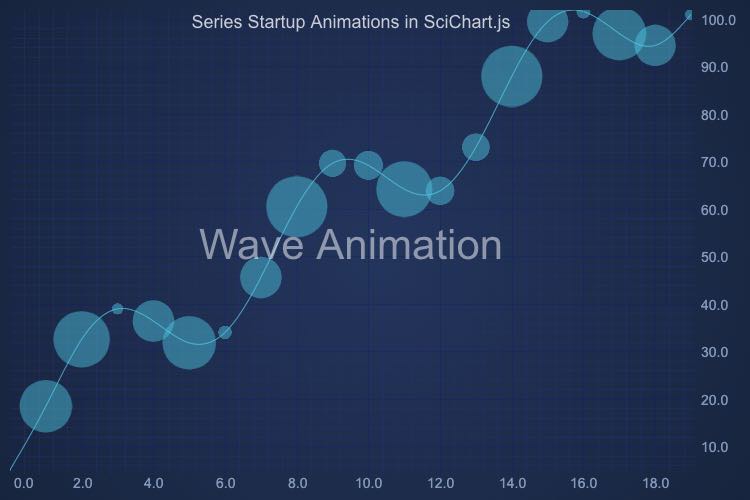
JavaScript Startup Animation
Demonstrates how to run Startup Animations with JavaScript.
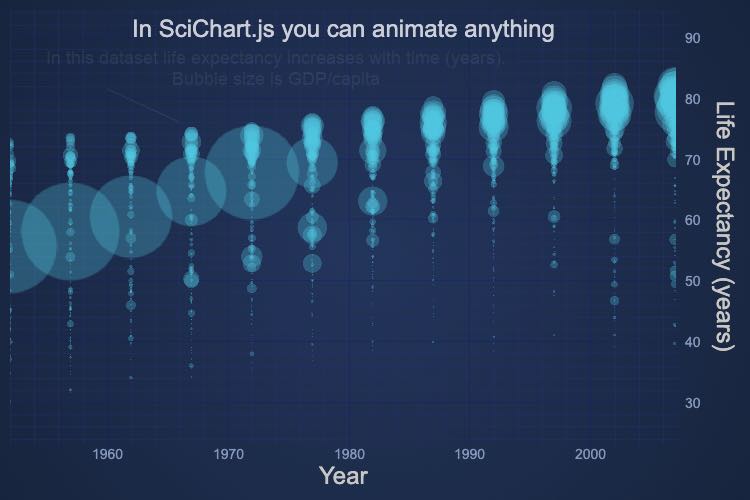
JavaScript Generic Animation
Demonstrates how to run Generic Animation with JavaScript.
2D Charts: Builder (JSON / JS Objects) API (5 Demos)
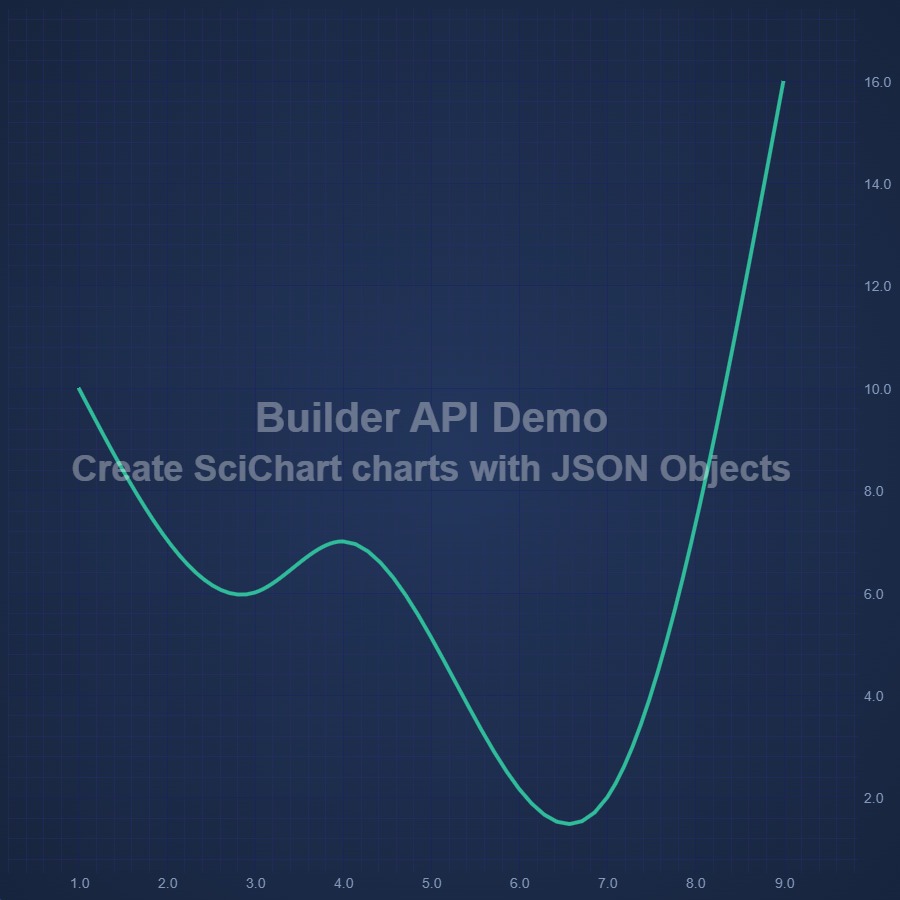
Simple Chart using Builder API
Demonstrates how to use the Builder Api to create a simple chart using a definition object. The builder api is designed to make it easier to discover the types and options available in SciChart JS.
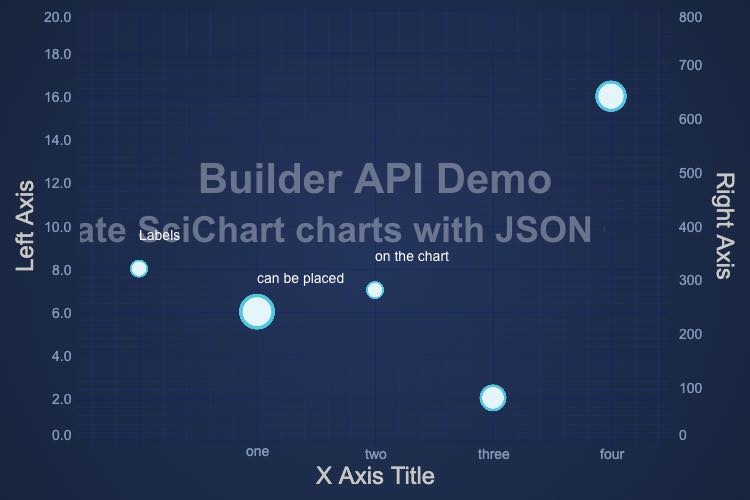
Full Chart using Builder API
Demonstrates how to use the Builder Api to configure axes, series, annotations and modifiers using a definition object. The builder api is designed to make it easier to discover the types and options available in SciChart JS.
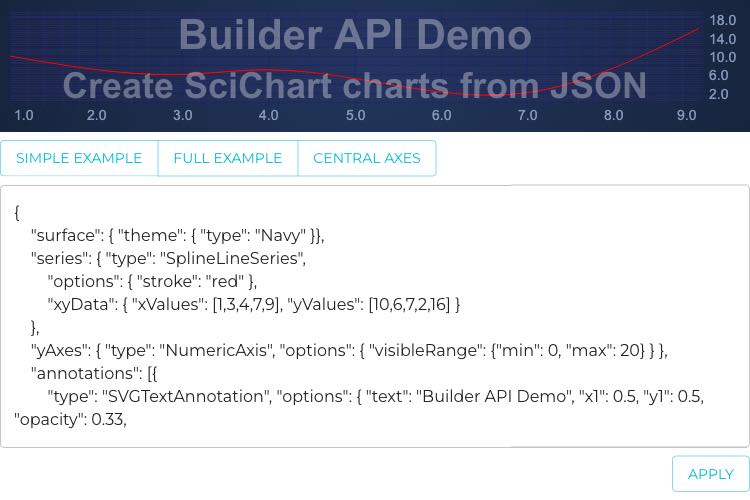
Chart from JSON
Demonstrates how to create a JavaScript Chart from JSON using the builder API.
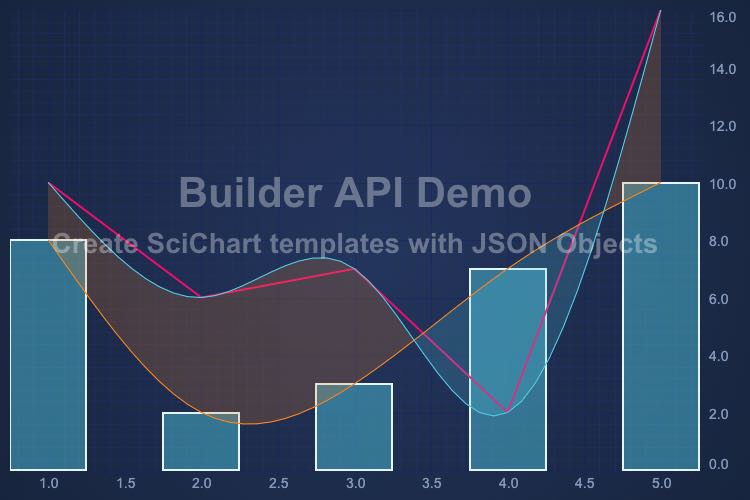
JavaScript Chart with Reusable Templates using Shared Data
Demonstrates how to use the Builder Api to create Reusable Chart Templates.Data can be easily integrated into a definition and shared between series
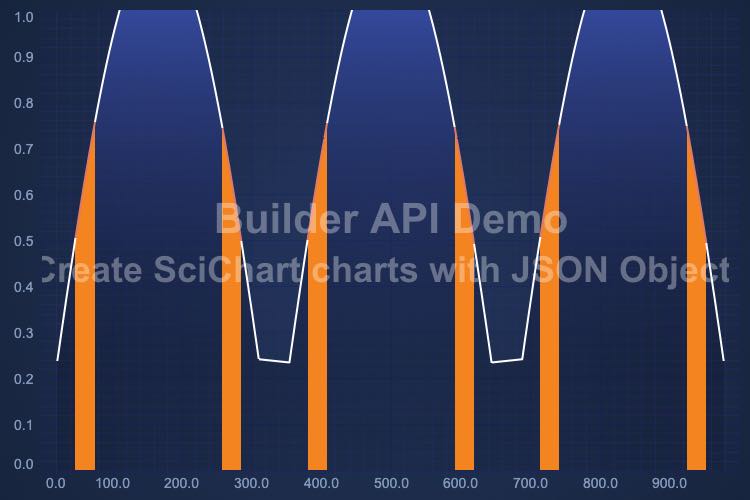
Custom Types with Builder API
Demonstrates how to make a custom type such as a PaletteProvider available for use with the Builder Api.You can call methods within the builder api to get references to the objects being built, so you can update them later.
2D Charts: Subcharts API (2 Demos)
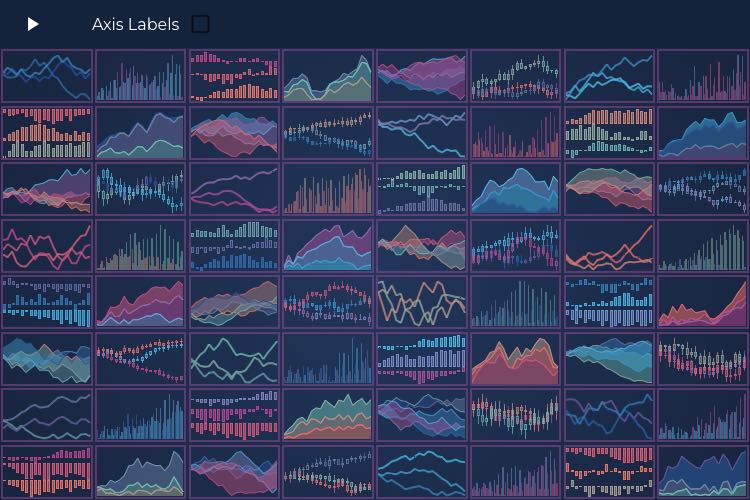
JavaScript 64-Chart Dashboard Performance Demo
Using the SubCharts API as part of SciChart.js, this demo showcases an 8x8 grid of 64 charts updating in realtime in JavaScript

Dynamic Layout Showcase
Demonstrates a custom modifier which can convert from single chart to grid layout and back.
2D Charts: Multiple Charts (3 Demos)
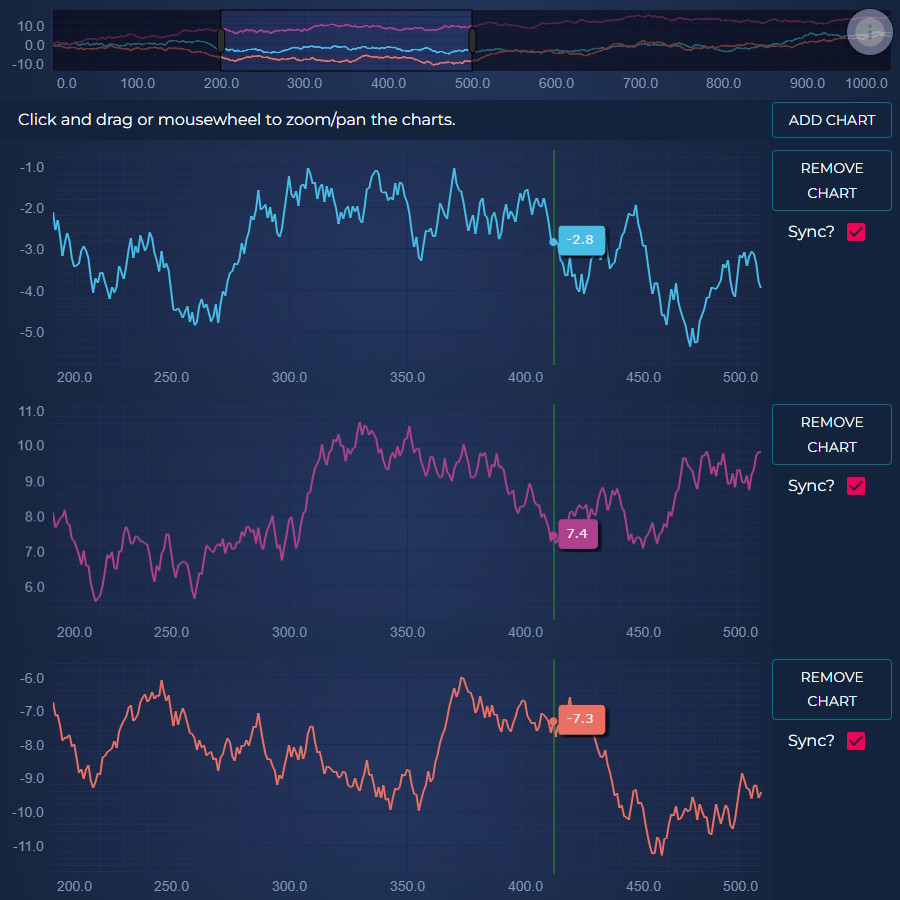
Synchronise Multiple Charts
Synchronise multiple dynamic charts and overview

JavaScript Multi-Pane Stock Charts using Sync Multi-Chart
Create a JavaScript Multi-Pane Candlestick / Stock Chart with indicator panels, synchronized zooming, panning and cursors. Get your free trial of SciChart.js now.

Server Traffic Dashboard
This dashboard demo showcases the incredible realtime performance of our JavaScript charts by updating the series with millions of data-points!
3D Charts: JavaScript 3D Chart Types (7 Demos)
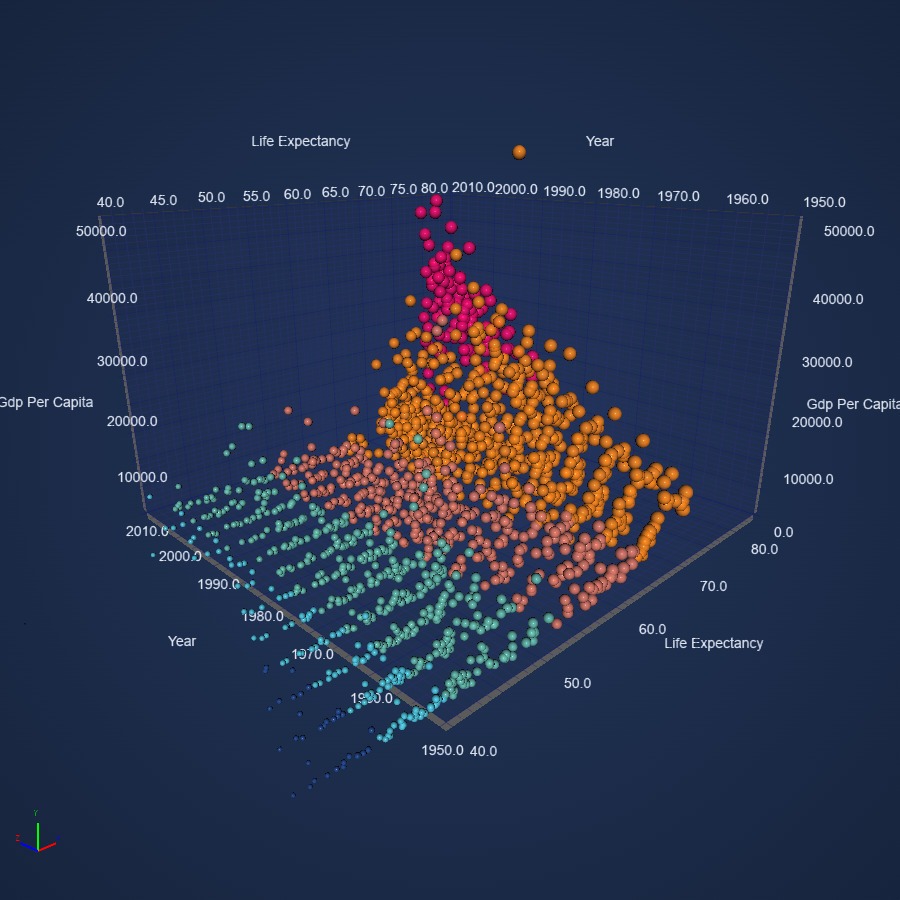
JavaScript 3D Bubble Chart
Create detailed JavaScript 3D Bubble Chart using SciChart's 5-star rated JavaScript chart library. Supports large datasets. Get your free demo now.
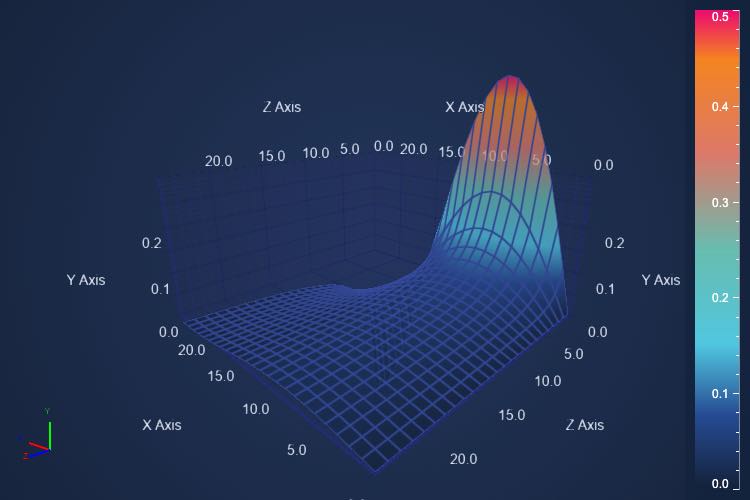
JavaScript Surface Mesh 3D Chart
Design a JavaScript 3D Surface Mesh Chart with SciChart.js - feature-rich JavaScript chart library. Represent 2D data in a 3D map. Get your free demo.
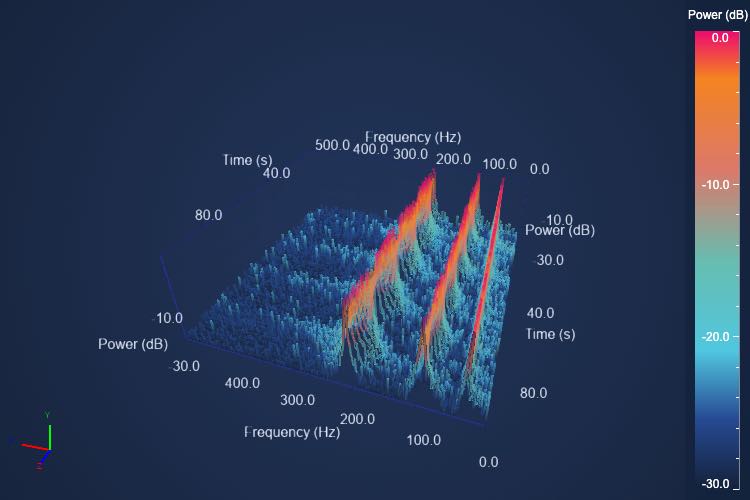
JavaScript Point Line 3D Chart
Create detailed JavaScript 3D Line Chart using SciChart's 5-star rated JavaScript chart library. Supports large datasets. Get your free demo now.

LiDAR 3D Point Cloud of Geospatial Data
Demonstrating the capability of SciChart.js to create JavaScript 3D Point Cloud charts and visualize LiDAR data from the UK Defra Survey.

Tenor Curves Demo
Demonstrating the capability of SciChart.js to create a composite 2D & 3D Chart application. An example like this could be used to visualize Tenor curves in a financial setting, or other 2D/3D data combined on a single screen.
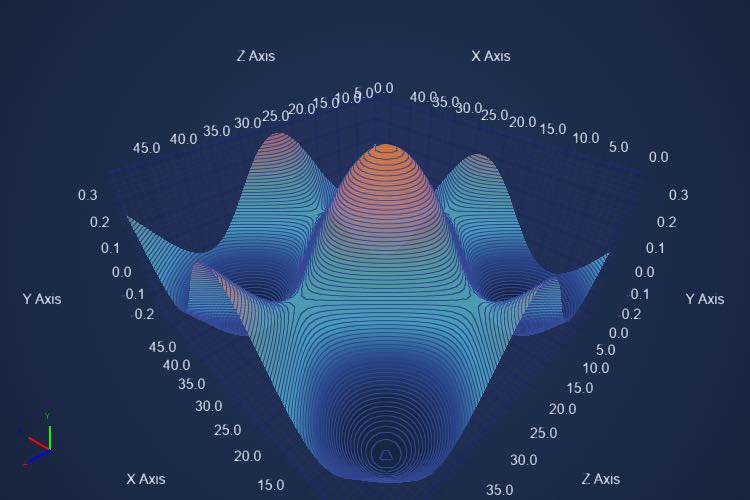
JavaScript Realtime Surface Mesh 3D Chart
Design a JavaScript 3D Surface Mesh Chart with SciChart.js - feature-rich JavaScript chart library. Represent 2D data in a 3D map. Get your free demo.
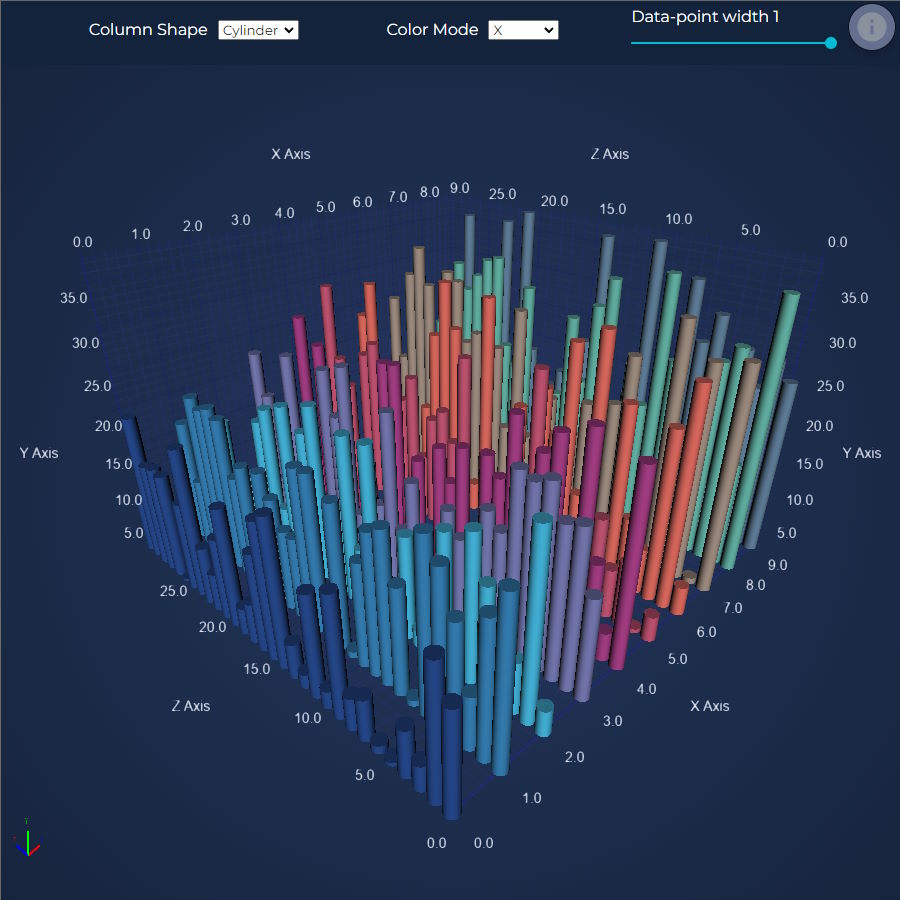
JavaScript Column 3D Chart
Create detailed JavaScript 3D Column Chart using SciChart's 5-star rated JavaScript chart library. Supports large datasets