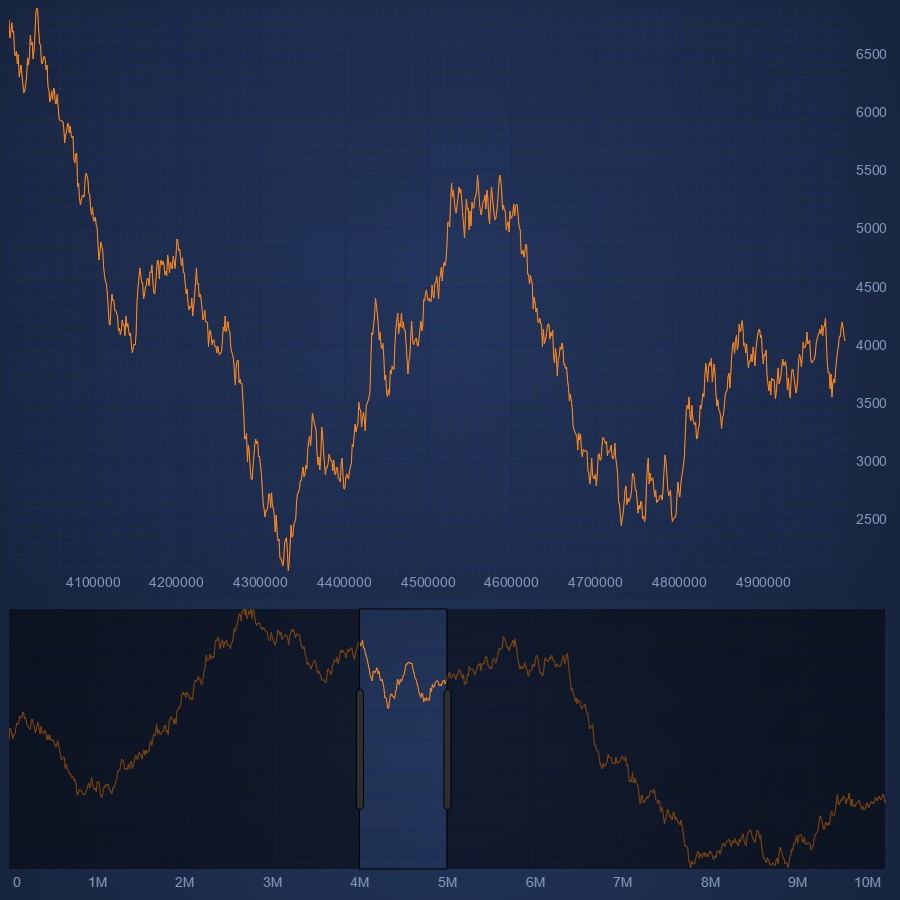
Zoom and Pan with Overview Chart
Demonstrates how to zoom and pan with an Overview Chart using SciChart.js, High Performance JavaScript Charts
drawExample.ts
index.tsx
RandomWalkGenerator.ts
theme.ts
1import {
2    EAutoRange,
3    ECoordinateMode,
4    EExecuteOn,
5    EHorizontalAnchorPoint,
6    EllipsePointMarker,
7    EMultiLineAlignment,
8    EVerticalAnchorPoint,
9    EWrapTo,
10    FastLineRenderableSeries,
11    MouseWheelZoomModifier,
12    NativeTextAnnotation,
13    NumberRange,
14    NumericAxis,
15    RubberBandXyZoomModifier,
16    SciChartSurface,
17    TextAnnotation,
18    XyDataSeries,
19    XyScatterRenderableSeries,
20    ZoomExtentsModifier,
21    ZoomPanModifier,
22} from "scichart";
23import { appTheme } from "../../../theme";
24import { RandomWalkGenerator } from "../../../ExampleData/RandomWalkGenerator";
25
26export const overViewOption = {
27    theme: appTheme.SciChartJsTheme,
28};
29
30export const drawExample = async (rootElement: string | HTMLDivElement) => {
31    const { wasmContext, sciChartSurface } = await SciChartSurface.create(rootElement, {
32        theme: appTheme.SciChartJsTheme,
33    });
34
35    // Create and add an XAxis and YAxis
36    sciChartSurface.xAxes.add(new NumericAxis(wasmContext, { visibleRange: new NumberRange(500, 600) }));
37    sciChartSurface.yAxes.add(
38        new NumericAxis(wasmContext, {
39            autoRange: EAutoRange.Always,
40            growBy: new NumberRange(0.1, 0.1),
41        })
42    );
43
44    const POINTS = 1000;
45
46    const data0 = new RandomWalkGenerator().Seed(1337).getRandomWalkSeries(POINTS);
47
48    // Add a line series to the chart
49    sciChartSurface.renderableSeries.add(
50        new FastLineRenderableSeries(wasmContext, {
51            dataSeries: new XyDataSeries(wasmContext, { xValues: data0.xValues, yValues: data0.yValues }),
52            strokeThickness: 3,
53            stroke: appTheme.VividSkyBlue,
54        })
55    );
56
57    const data1 = new RandomWalkGenerator().Seed(42069).getRandomWalkSeries(POINTS);
58
59    // Add a scatter series to the chart
60    sciChartSurface.renderableSeries.add(
61        new XyScatterRenderableSeries(wasmContext, {
62            dataSeries: new XyDataSeries(wasmContext, { xValues: data1.xValues, yValues: data1.yValues }),
63            pointMarker: new EllipsePointMarker(wasmContext, { fill: appTheme.VividPink, strokeThickness: 0 }),
64            strokeThickness: 3,
65        })
66    );
67
68    // Add an annotation with instructions over the chart
69    sciChartSurface.annotations.add(
70        new NativeTextAnnotation({
71            x1: 0.02,
72            y1: 0.02,
73            xCoordinateMode: ECoordinateMode.Relative,
74            yCoordinateMode: ECoordinateMode.Relative,
75            horizontalAnchorPoint: EHorizontalAnchorPoint.Left,
76            verticalAnchorPoint: EVerticalAnchorPoint.Top,
77            fontSize: 18,
78            opacity: 0.55,
79            textColor: appTheme.ForegroundColor,
80            text: "SciChart.js supports an Overview scrollbar. Zoom the main chart or drag the overview to see it update",
81            wrapTo: EWrapTo.ViewRect,
82            multiLineAlignment: EMultiLineAlignment.Left,
83        })
84    );
85
86    // Add Overview chart. This will automatically bind to the parent surface
87    // displaying its series. Zooming the chart will zoom the overview and vice versa
88    // calling this outside of the function
89    // const overview = await SciChartOverview.create(sciChartSurface, divOverviewId, {
90    //     theme: appTheme.SciChartJsTheme,
91    // });
92
93    // Optional: add some zoom pan interaction
94    sciChartSurface.chartModifiers.add(new ZoomPanModifier({ enableZoom: true }));
95    sciChartSurface.chartModifiers.add(new RubberBandXyZoomModifier({ executeOn: EExecuteOn.MouseRightButton }));
96    sciChartSurface.chartModifiers.add(new ZoomExtentsModifier());
97    sciChartSurface.chartModifiers.add(new MouseWheelZoomModifier());
98
99    return { sciChartSurface };
100};
101
See Also: Zoom and Pan a Chart (6 Demos)
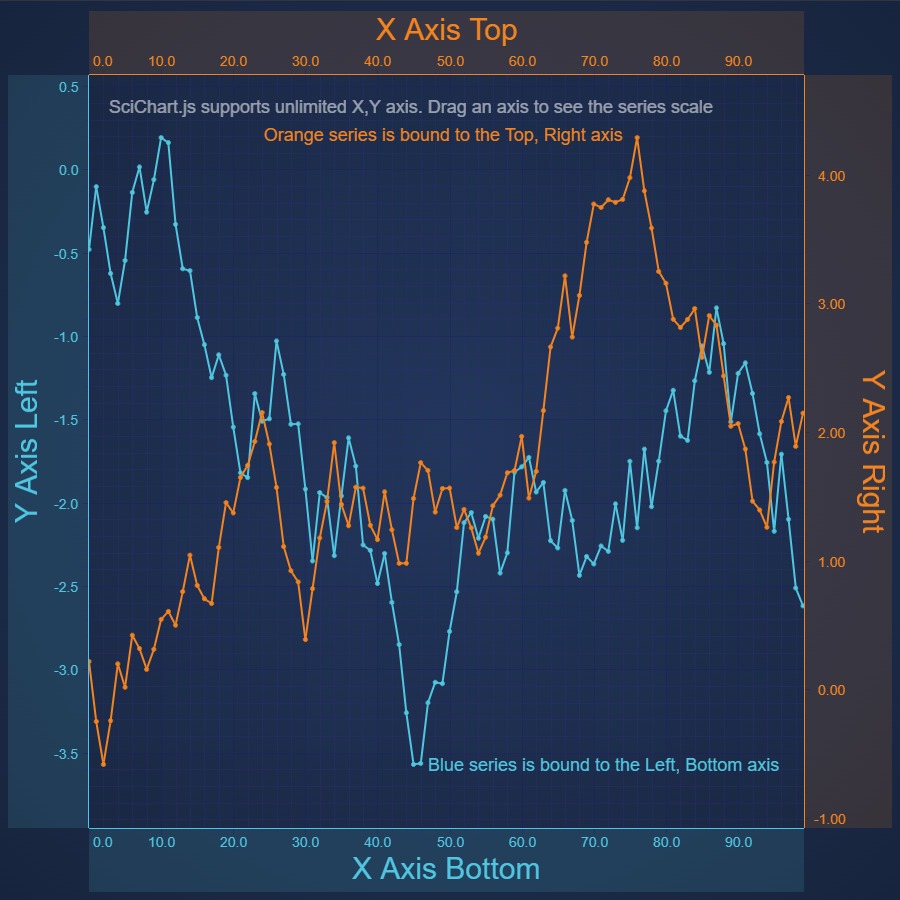
React Chart with Multiple X Axes
Demonstrates Multiple X & Y Axis on a React Chart using SciChart.js. SciChart supports unlimited left, right, top, bottom X, Y axis with configurable alignment and individual zooming, panning
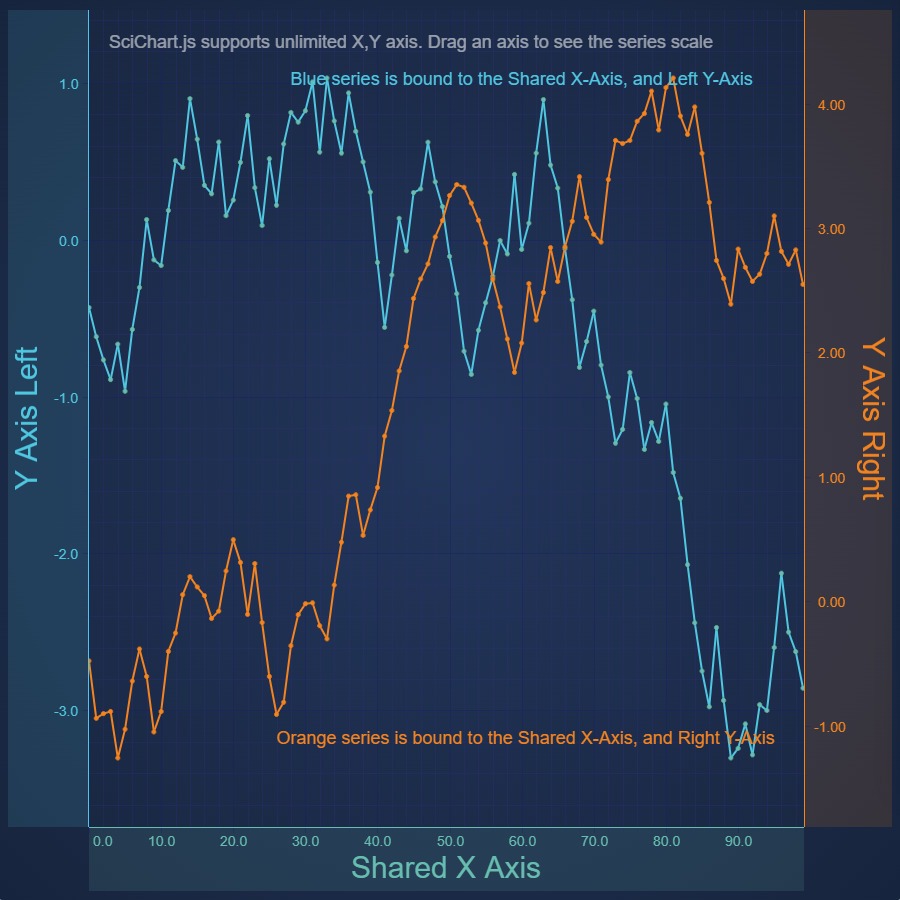
React Chart with Secondary Y Axes
Demonstrates Secondary Y Axis on a React Chart using SciChart.js. SciChart supports unlimited, multiple left, right, top, bottom X, Y axis with configurable alignment and individual zooming, panning
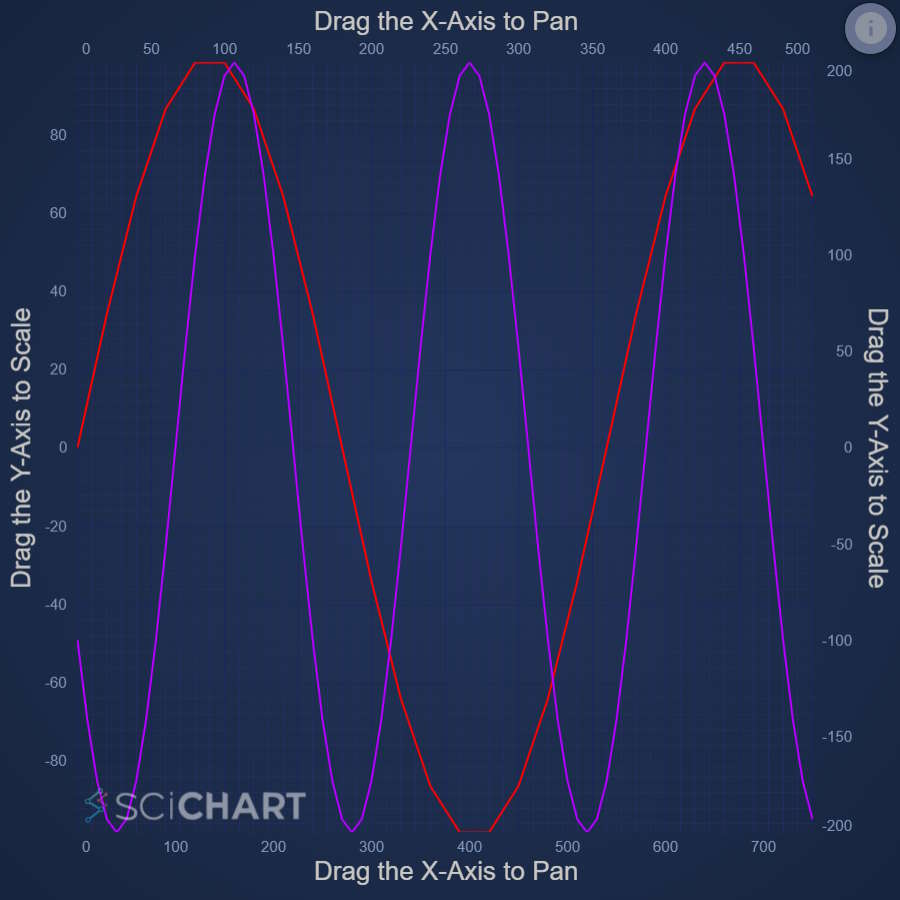
Drag React Chart Axis to Scale or Pan
Demonstrates how to Zoom, Scale or Pan individual Axis on a React Chart with SciChart.js AxisDragModifiers

Zoom and Pan a Realtime React Chart
Demonstrates how to zoom and pan a realtime React Chart while it is updating, with SciChart.js ZoomState API
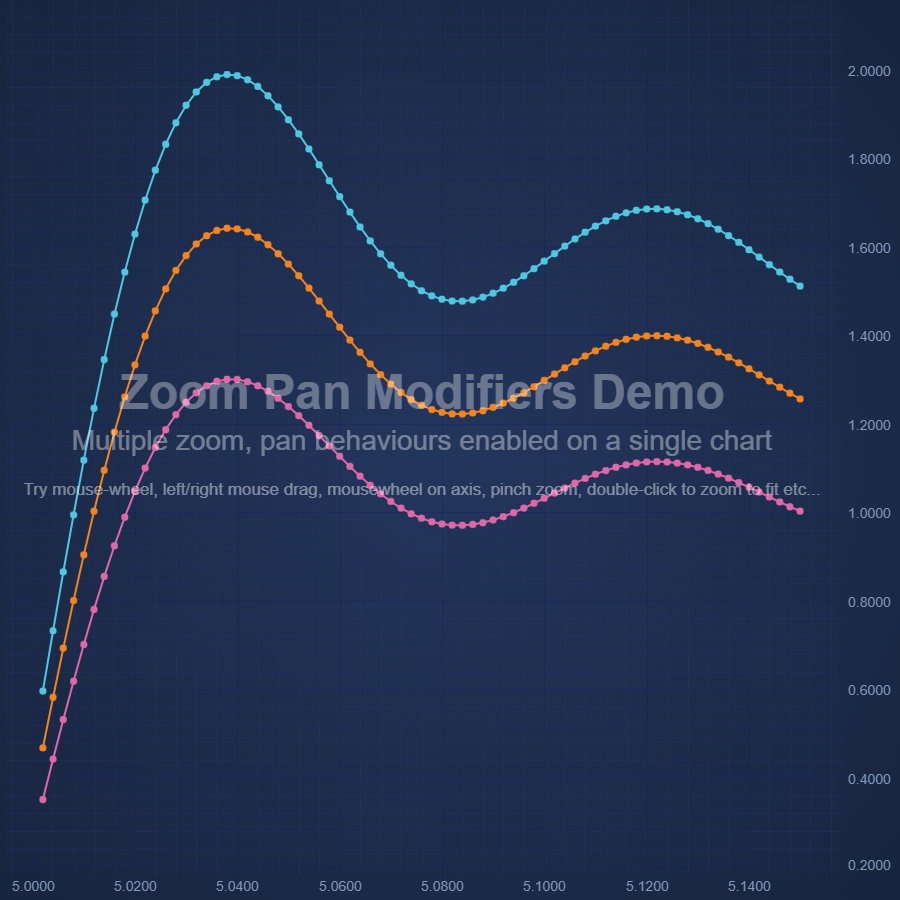
Zoom and Pan with React Chart multiple Modifiers
Demonstrates how to use multiple Zoom and Pan Modifiers on a React Chart with SciChart.js
Virtualized React Charts: Load Data on Zoom/Pan
shows how to load data on zoom/pan and how to create an overview chart for this case.