React Multi-Pane Stock Charts using Sync Multi-Chart
Using the default multi-chart sync APIs, create a multi-pane stock chart example with indicator panels. Zooming, panning, cursors are synchronised between the charts. This is a simpler way to create charts than subcharts, but will have a performance hit on some browsers.
drawExample.ts
index.tsx
ChartGroupLoader.tsx
ExampleDataProvider.ts
theme.ts
1import {
2    SciChartVerticalGroup,
3    CategoryAxis,
4    EAxisAlignment,
5    SciChartSurface,
6    EAutoRange,
7    NumberRange,
8    NumericAxis,
9    OhlcDataSeries,
10    FastCandlestickRenderableSeries,
11    XyDataSeries,
12    calcAverageForArray,
13    FastLineRenderableSeries,
14    ZoomPanModifier,
15    ZoomExtentsModifier,
16    MouseWheelZoomModifier,
17    RolloverModifier,
18    FastBandRenderableSeries,
19    XyyDataSeries,
20    FastColumnRenderableSeries,
21    EXyDirection,
22    EFillPaletteMode,
23    EStrokePaletteMode,
24    IFillPaletteProvider,
25    IStrokePaletteProvider,
26    IRenderableSeries,
27    parseColorToUIntArgb,
28    ENumericFormat,
29    SmartDateLabelProvider,
30    XyMovingAverageFilter,
31    EDataSeriesField,
32    ELabelAlignment,
33    SeriesInfo,
34    EDataSeriesType,
35    OhlcSeriesInfo,
36    RolloverLegendSvgAnnotation,
37    SciChartOverview,
38    ESeriesType,
39    FastMountainRenderableSeries,
40    GradientParams,
41    Point,
42    TextAnnotation,
43    ECoordinateMode,
44    EHorizontalAnchorPoint,
45    EVerticalAnchorPoint,
46    EAnnotationLayer,
47} from "scichart";
48import { fetchMultiPaneData } from "../../../ExampleData/ExampleDataProvider";
49import { appTheme } from "../../../theme";
50
51const getTradingData = async (startPoints?: number, maxPoints?: number) => {
52    const { dateValues, openValues, highValues, lowValues, closeValues, volumeValues } = await fetchMultiPaneData();
53
54    if (maxPoints !== undefined) {
55        return {
56            dateValues: dateValues.slice(startPoints, startPoints + maxPoints),
57            openValues: openValues.slice(startPoints, startPoints + maxPoints),
58            highValues: highValues.slice(startPoints, startPoints + maxPoints),
59            lowValues: lowValues.slice(startPoints, startPoints + maxPoints),
60            closeValues: closeValues.slice(startPoints, startPoints + maxPoints),
61            volumeValues: volumeValues.slice(startPoints, startPoints + maxPoints),
62        };
63    }
64
65    return { dateValues, openValues, highValues, lowValues, closeValues, volumeValues };
66};
67
68// Override the standard legend displayed by RolloverModifier
69const getTooltipLegendTemplate = (seriesInfos: SeriesInfo[], svgAnnotation: RolloverLegendSvgAnnotation) => {
70    let outputSvgString = "";
71
72    // Foreach series there will be a seriesInfo supplied by SciChart. This contains info about the series under the house
73    seriesInfos.forEach((seriesInfo, index) => {
74        const y = 20 + index * 20;
75        const textColor = seriesInfo.stroke;
76        let legendText = seriesInfo.formattedYValue;
77        if (seriesInfo.dataSeriesType === EDataSeriesType.Ohlc) {
78            const o = seriesInfo as OhlcSeriesInfo;
79            legendText = `Open=${o.formattedOpenValue} High=${o.formattedHighValue} Low=${o.formattedLowValue} Close=${o.formattedCloseValue}`;
80        }
81        outputSvgString += `<text x="8" y="${y}" font-size="13" font-family="Verdana" fill="${textColor}">
82            ${seriesInfo.seriesName}: ${legendText}
83        </text>`;
84    });
85
86    return `<svg width="100%" height="100%">
87                ${outputSvgString}
88            </svg>`;
89};
90
91// Override the Renderableseries to display on the scichart overview
92const getOverviewSeries = (defaultSeries: IRenderableSeries) => {
93    if (defaultSeries.type === ESeriesType.CandlestickSeries) {
94        // Swap the default candlestick series on the overview chart for a mountain series. Same data
95        return new FastMountainRenderableSeries(defaultSeries.parentSurface.webAssemblyContext2D, {
96            dataSeries: defaultSeries.dataSeries,
97            fillLinearGradient: new GradientParams(new Point(0, 0), new Point(0, 1), [
98                { color: appTheme.VividSkyBlue + "77", offset: 0 },
99                { color: "Transparent", offset: 1 },
100            ]),
101            stroke: appTheme.VividSkyBlue,
102        });
103    }
104    // hide all other series
105    return undefined;
106};
107
108export const getChartsInitializationAPI = () => {
109    // We can group together charts using VerticalChartGroup type
110    const verticalGroup = new SciChartVerticalGroup();
111
112    const dataPromise = getTradingData();
113
114    let chart1XAxis: CategoryAxis;
115    let chart2XAxis: CategoryAxis;
116    let chart3XAxis: CategoryAxis;
117    const axisAlignment = EAxisAlignment.Right;
118
119    const upCol = appTheme.VividGreen;
120    const downCol = appTheme.MutedRed;
121    const opacity = "AA";
122
123    // CHART 1
124    const drawPriceChart = async (rootElement: string | HTMLDivElement) => {
125        const [chart, data] = await Promise.all([
126            SciChartSurface.create(rootElement, {
127                // prevent default size settings
128                disableAspect: true,
129                theme: appTheme.SciChartJsTheme,
130            }),
131            dataPromise,
132        ]);
133        const { wasmContext, sciChartSurface } = chart;
134        const { dateValues, openValues, highValues, lowValues, closeValues, volumeValues } = data;
135
136        chart1XAxis = new CategoryAxis(wasmContext, {
137            drawLabels: false,
138            drawMajorTickLines: false,
139            drawMinorTickLines: false,
140        });
141        sciChartSurface.xAxes.add(chart1XAxis);
142
143        const yAxis = new NumericAxis(wasmContext, {
144            maxAutoTicks: 5,
145            autoRange: EAutoRange.Always,
146            growBy: new NumberRange(0.3, 0.11),
147            labelFormat: ENumericFormat.Decimal,
148            labelPrecision: 4,
149            cursorLabelFormat: ENumericFormat.Decimal,
150            cursorLabelPrecision: 4,
151            labelPrefix: "$",
152            axisAlignment,
153        });
154        sciChartSurface.yAxes.add(yAxis);
155
156        // OHLC DATA SERIES
157        const usdDataSeries = new OhlcDataSeries(wasmContext, {
158            dataSeriesName: "EUR/USD",
159            xValues: dateValues,
160            openValues,
161            highValues,
162            lowValues,
163            closeValues,
164        });
165        const fcRendSeries = new FastCandlestickRenderableSeries(wasmContext, {
166            dataSeries: usdDataSeries,
167            stroke: appTheme.ForegroundColor, // Used for legend template
168            brushUp: upCol + "77",
169            brushDown: downCol + "77",
170            strokeUp: upCol,
171            strokeDown: downCol,
172        });
173        sciChartSurface.renderableSeries.add(fcRendSeries);
174
175        // MA1 SERIES
176        const maLowDataSeries = new XyMovingAverageFilter(usdDataSeries, {
177            dataSeriesName: "MA 50 Low",
178            length: 50,
179            field: EDataSeriesField.Low,
180        });
181        const maLowRenderableSeries = new FastLineRenderableSeries(wasmContext, {
182            dataSeries: maLowDataSeries,
183        });
184        sciChartSurface.renderableSeries.add(maLowRenderableSeries);
185        maLowRenderableSeries.rolloverModifierProps.tooltipColor = "red";
186        maLowRenderableSeries.rolloverModifierProps.markerColor = "red";
187        maLowRenderableSeries.stroke = appTheme.VividPink;
188        maLowRenderableSeries.strokeThickness = 2;
189
190        // MA2 SERIES
191        const maHighDataSeries = new XyMovingAverageFilter(usdDataSeries, {
192            dataSeriesName: "MA 200 High",
193            length: 200,
194            field: EDataSeriesField.High,
195        });
196        const maHighRenderableSeries = new FastLineRenderableSeries(wasmContext, {
197            dataSeries: maHighDataSeries,
198        });
199        sciChartSurface.renderableSeries.add(maHighRenderableSeries);
200        maHighRenderableSeries.stroke = appTheme.VividSkyBlue;
201        maHighRenderableSeries.strokeThickness = 2;
202
203        // VOLUME SERIES
204        const yAxis2 = new NumericAxis(wasmContext, {
205            id: "yAxis2",
206            isVisible: false,
207            autoRange: EAutoRange.Always,
208            growBy: new NumberRange(0, 3),
209        });
210        sciChartSurface.yAxes.add(yAxis2);
211
212        const volumeRenderableSeries = new FastColumnRenderableSeries(wasmContext, {
213            yAxisId: "yAxis2",
214            dataSeries: new XyDataSeries(wasmContext, {
215                dataSeriesName: "Volume",
216                xValues: dateValues,
217                yValues: volumeValues,
218            }),
219            dataPointWidth: 0.5,
220            strokeThickness: 1,
221            paletteProvider: new VolumePaletteProvider(usdDataSeries, upCol + opacity, downCol + opacity),
222        });
223        sciChartSurface.renderableSeries.add(volumeRenderableSeries);
224
225        // Add a watermark annotation
226        const watermarkAnnotation = new TextAnnotation({
227            x1: 0.5,
228            y1: 0.5,
229            xCoordinateMode: ECoordinateMode.Relative,
230            yCoordinateMode: ECoordinateMode.Relative,
231            horizontalAnchorPoint: EHorizontalAnchorPoint.Center,
232            verticalAnchorPoint: EVerticalAnchorPoint.Center,
233            opacity: 0.17,
234            textColor: appTheme.ForegroundColor,
235            fontSize: 48,
236            fontWeight: "Bold",
237            text: "Euro / U.S. Dollar - Daily",
238        });
239        sciChartSurface.annotations.add(watermarkAnnotation);
240
241        // MODIFIERS
242        sciChartSurface.chartModifiers.add(new ZoomPanModifier({ enableZoom: true }));
243        sciChartSurface.chartModifiers.add(new ZoomExtentsModifier());
244        sciChartSurface.chartModifiers.add(new MouseWheelZoomModifier());
245        sciChartSurface.chartModifiers.add(
246            new RolloverModifier({
247                modifierGroup: "cursorGroup",
248                showTooltip: false,
249                tooltipLegendTemplate: getTooltipLegendTemplate,
250            })
251        );
252
253        verticalGroup.addSurfaceToGroup(sciChartSurface);
254
255        return { wasmContext, sciChartSurface };
256    };
257
258    // CHART 2 - MACD
259    const drawMacdChart = async (rootElement: string | HTMLDivElement) => {
260        const [{ wasmContext, sciChartSurface }, { dateValues, closeValues }] = await Promise.all([
261            SciChartSurface.create(rootElement, {
262                // prevent default size settings
263                disableAspect: true,
264                theme: appTheme.SciChartJsTheme,
265            }),
266            dataPromise,
267        ]);
268
269        chart2XAxis = new CategoryAxis(wasmContext, {
270            drawLabels: false,
271            drawMajorTickLines: false,
272            drawMinorTickLines: false,
273        });
274        sciChartSurface.xAxes.add(chart2XAxis);
275
276        const yAxis = new NumericAxis(wasmContext, {
277            autoRange: EAutoRange.Always,
278            growBy: new NumberRange(0.1, 0.1),
279            axisAlignment,
280            labelPrecision: 2,
281            cursorLabelPrecision: 2,
282            labelStyle: { alignment: ELabelAlignment.Right },
283        });
284        yAxis.labelProvider.numericFormat = ENumericFormat.Decimal;
285        sciChartSurface.yAxes.add(yAxis);
286
287        const macdArray: number[] = [];
288        const signalArray: number[] = [];
289        const divergenceArray: number[] = [];
290        for (let i = 0; i < dateValues.length; i++) {
291            const maSlow = calcAverageForArray(closeValues, 12, i);
292            const maFast = calcAverageForArray(closeValues, 25, i);
293            const macd = maSlow - maFast;
294            macdArray.push(macd);
295            const signal = calcAverageForArray(macdArray, 9, i);
296            signalArray.push(signal);
297            const divergence = macd - signal;
298            divergenceArray.push(divergence);
299        }
300
301        const bandSeries = new FastBandRenderableSeries(wasmContext, {
302            dataSeries: new XyyDataSeries(wasmContext, {
303                dataSeriesName: "MACD",
304                xValues: dateValues,
305                yValues: signalArray,
306                y1Values: macdArray,
307            }),
308            stroke: downCol,
309            strokeY1: upCol,
310            fill: upCol + "77",
311            fillY1: downCol + "77",
312        });
313        sciChartSurface.renderableSeries.add(bandSeries);
314
315        const columnSeries = new FastColumnRenderableSeries(wasmContext, {
316            dataSeries: new XyDataSeries(wasmContext, {
317                dataSeriesName: "Divergence",
318                xValues: dateValues,
319                yValues: divergenceArray,
320            }),
321            paletteProvider: new MacdHistogramPaletteProvider(upCol + "AA", downCol + "AA"),
322            dataPointWidth: 0.5,
323        });
324        sciChartSurface.renderableSeries.add(columnSeries);
325
326        sciChartSurface.chartModifiers.add(
327            new ZoomPanModifier({ enableZoom: true, xyDirection: EXyDirection.XDirection })
328        );
329        sciChartSurface.chartModifiers.add(new ZoomExtentsModifier({ xyDirection: EXyDirection.XDirection }));
330        sciChartSurface.chartModifiers.add(new MouseWheelZoomModifier({ xyDirection: EXyDirection.XDirection }));
331        sciChartSurface.chartModifiers.add(
332            new RolloverModifier({
333                modifierGroup: "cursorGroup",
334                showTooltip: false,
335                tooltipLegendTemplate: getTooltipLegendTemplate,
336            })
337        );
338
339        verticalGroup.addSurfaceToGroup(sciChartSurface);
340
341        return { wasmContext, sciChartSurface };
342    };
343
344    // CHART 3 - RSI
345    const drawRsiChart = async (rootElement: string | HTMLDivElement) => {
346        const [{ wasmContext, sciChartSurface }, { dateValues, closeValues }] = await Promise.all([
347            SciChartSurface.create(rootElement, {
348                // prevent default size settings
349                disableAspect: true,
350                theme: appTheme.SciChartJsTheme,
351            }),
352            dataPromise,
353        ]);
354
355        chart3XAxis = new CategoryAxis(wasmContext, {
356            autoRange: EAutoRange.Once,
357            labelProvider: new SmartDateLabelProvider(),
358        });
359        sciChartSurface.xAxes.add(chart3XAxis);
360
361        const yAxis = new NumericAxis(wasmContext, {
362            autoRange: EAutoRange.Always,
363            growBy: new NumberRange(0.1, 0.1),
364            labelPrecision: 0,
365            cursorLabelPrecision: 0,
366            axisAlignment,
367            labelStyle: { alignment: ELabelAlignment.Right },
368        });
369        yAxis.labelProvider.numericFormat = ENumericFormat.Decimal;
370        sciChartSurface.yAxes.add(yAxis);
371
372        const RSI_PERIOD = 14;
373        const rsiArray: number[] = [];
374        const gainArray: number[] = [];
375        const lossArray: number[] = [];
376        rsiArray.push(NaN);
377        gainArray.push(NaN);
378        lossArray.push(NaN);
379        for (let i = 1; i < dateValues.length; i++) {
380            const previousClose = closeValues[i - 1];
381            const currentClose = closeValues[i];
382            const gain = currentClose > previousClose ? currentClose - previousClose : 0;
383            gainArray.push(gain);
384            const loss = previousClose > currentClose ? previousClose - currentClose : 0;
385            lossArray.push(loss);
386            const relativeStrength =
387                calcAverageForArray(gainArray, RSI_PERIOD) / calcAverageForArray(lossArray, RSI_PERIOD);
388            const rsi = 100 - 100 / (1 + relativeStrength);
389            rsiArray.push(rsi);
390        }
391        const rsiRenderableSeries = new FastLineRenderableSeries(wasmContext, {
392            dataSeries: new XyDataSeries(wasmContext, {
393                dataSeriesName: "RSI",
394                xValues: dateValues,
395                yValues: rsiArray,
396            }),
397            stroke: appTheme.MutedBlue,
398            strokeThickness: 2,
399        });
400        sciChartSurface.renderableSeries.add(rsiRenderableSeries);
401
402        sciChartSurface.chartModifiers.add(
403            new ZoomPanModifier({ enableZoom: true, xyDirection: EXyDirection.XDirection })
404        );
405        sciChartSurface.chartModifiers.add(new ZoomExtentsModifier({ xyDirection: EXyDirection.XDirection }));
406        sciChartSurface.chartModifiers.add(new MouseWheelZoomModifier({ xyDirection: EXyDirection.XDirection }));
407        sciChartSurface.chartModifiers.add(
408            new RolloverModifier({
409                modifierGroup: "cursorGroup",
410                showTooltip: false,
411                tooltipLegendTemplate: getTooltipLegendTemplate,
412            })
413        );
414
415        verticalGroup.addSurfaceToGroup(sciChartSurface);
416
417        return { wasmContext, sciChartSurface };
418    };
419
420    // DRAW OVERVIEW
421    // Must be done after main chart creation
422    const drawOverview = (mainSurface: SciChartSurface) => async (rootElement: string | HTMLDivElement) => {
423        const overview = await SciChartOverview.create(mainSurface, rootElement, {
424            // prevent default size settings
425            disableAspect: true,
426            theme: appTheme.SciChartJsTheme,
427            transformRenderableSeries: getOverviewSeries,
428        });
429
430        return { sciChartSurface: overview.overviewSciChartSurface };
431    };
432
433    const configureAfterInit = () => {
434        const synchronizeAxes = () => {
435            // TODO refactor using AxisSynchroniser
436
437            // SYNCHRONIZE VISIBLE RANGES
438            chart1XAxis.visibleRangeChanged.subscribe((data1) => {
439                chart2XAxis.visibleRange = data1.visibleRange;
440                chart3XAxis.visibleRange = data1.visibleRange;
441            });
442            chart2XAxis.visibleRangeChanged.subscribe((data1) => {
443                chart1XAxis.visibleRange = data1.visibleRange;
444                chart3XAxis.visibleRange = data1.visibleRange;
445            });
446            chart3XAxis.visibleRangeChanged.subscribe((data1) => {
447                chart1XAxis.visibleRange = data1.visibleRange;
448                chart2XAxis.visibleRange = data1.visibleRange;
449            });
450        };
451
452        synchronizeAxes();
453
454        // Force showing the latest 200 bars
455        const oneDay = 600; // One day in javascript Date() has a value of 600
456        const twoHundredDays = oneDay * 200; // 200 days in JS date
457        const twoHundredDaysSciChartFormat = twoHundredDays / 1000; // SciChart expects date.getTime() / 1000
458        chart1XAxis.visibleRange = new NumberRange(
459            chart1XAxis.visibleRange.max - twoHundredDaysSciChartFormat,
460            chart1XAxis.visibleRange.max
461        );
462    };
463
464    return { drawPriceChart, drawMacdChart, drawRsiChart, drawOverview, configureAfterInit };
465};
466
467/**
468 * An example PaletteProvider applied to the volume column series. It will return green / red
469 * fills and strokes when the main price data bar is up or down
470 */
471class VolumePaletteProvider implements IStrokePaletteProvider, IFillPaletteProvider {
472    public readonly strokePaletteMode: EStrokePaletteMode = EStrokePaletteMode.SOLID;
473    public readonly fillPaletteMode: EFillPaletteMode = EFillPaletteMode.SOLID;
474    private priceData: OhlcDataSeries;
475    private volumeUpArgb: number;
476    private volumnDownArgb: number;
477
478    constructor(priceData: OhlcDataSeries, volumeUpColor: string, volumeDownColor: string) {
479        this.priceData = priceData;
480        this.volumeUpArgb = parseColorToUIntArgb(volumeUpColor);
481        this.volumnDownArgb = parseColorToUIntArgb(volumeDownColor);
482    }
483
484    onAttached(parentSeries: IRenderableSeries): void {}
485
486    onDetached(): void {}
487
488    overrideFillArgb(xValue: number, yValue: number, index: number): number {
489        const open = this.priceData.getNativeOpenValues().get(index);
490        const close = this.priceData.getNativeCloseValues().get(index);
491
492        return close >= open ? this.volumeUpArgb : this.volumnDownArgb;
493    }
494
495    overrideStrokeArgb(xValue: number, yValue: number, index: number): number {
496        return this.overrideFillArgb(xValue, yValue, index);
497    }
498}
499
500// tslint:disable-next-line:max-classes-per-file
501class MacdHistogramPaletteProvider implements IStrokePaletteProvider, IFillPaletteProvider {
502    public readonly strokePaletteMode: EStrokePaletteMode = EStrokePaletteMode.SOLID;
503    public readonly fillPaletteMode: EFillPaletteMode = EFillPaletteMode.SOLID;
504    private aboveZeroArgb: number;
505    private belowZeroArgb: number;
506
507    constructor(aboveZeroColor: string, belowZeroColor: string) {
508        this.aboveZeroArgb = parseColorToUIntArgb(aboveZeroColor);
509        this.belowZeroArgb = parseColorToUIntArgb(belowZeroColor);
510    }
511
512    onAttached(parentSeries: IRenderableSeries): void {}
513
514    onDetached(): void {}
515
516    overrideFillArgb(xValue: number, yValue: number, index: number): number {
517        return yValue >= 0 ? this.aboveZeroArgb : this.belowZeroArgb;
518    }
519
520    overrideStrokeArgb(xValue: number, yValue: number, index: number): number {
521        return this.overrideFillArgb(xValue, yValue, index);
522    }
523}
524
See Also: Financial Charts (8 Demos)

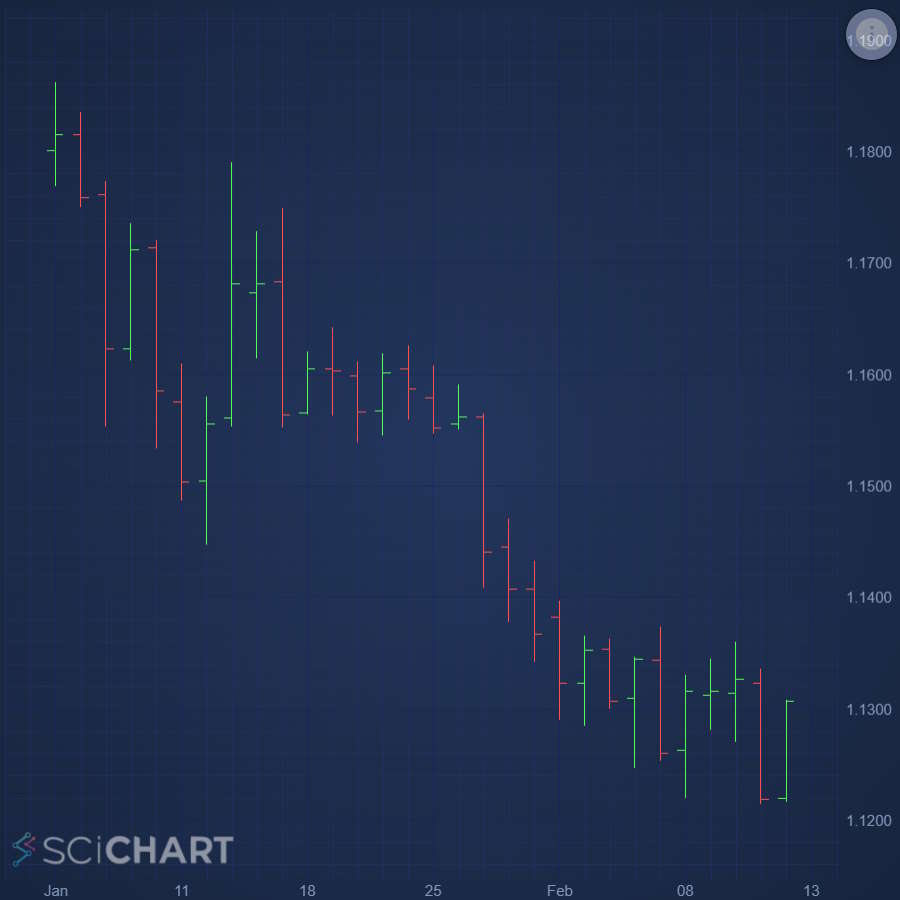
React Candlestick Chart
Discover how to create a React Candlestick Chart or Stock Chart using SciChart.js. For high Performance JavaScript Charts, get your free demo now.
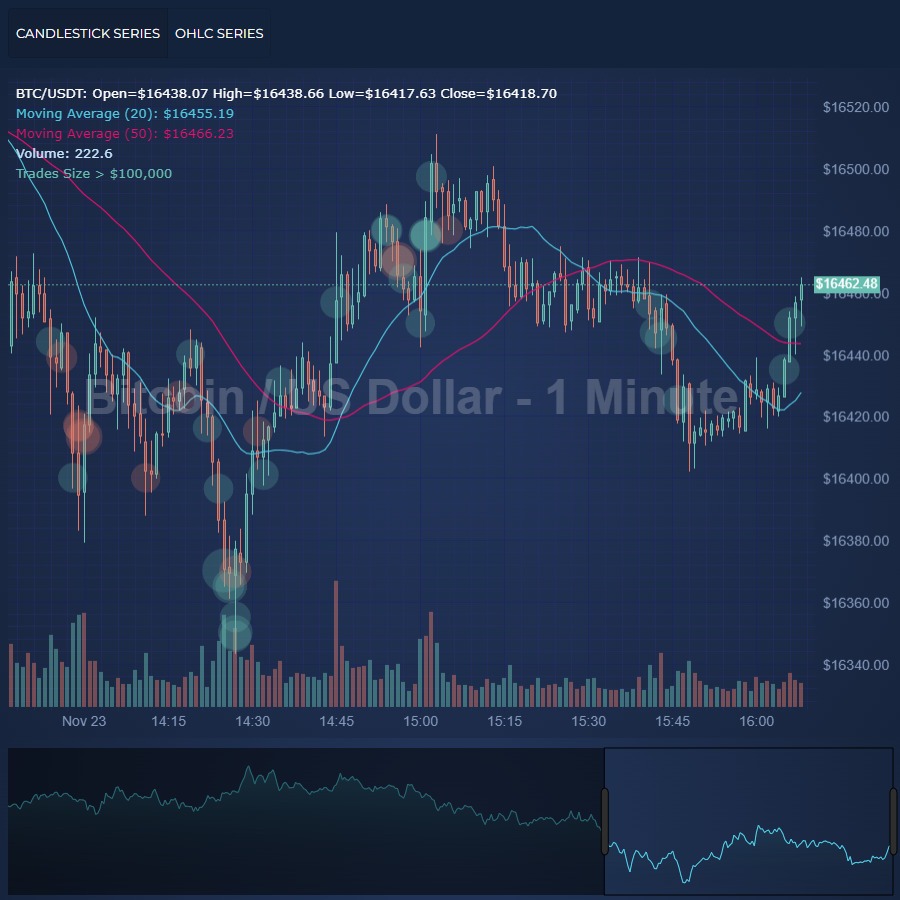
React OHLC Chart
Easily create React OHLC Chart or Stock Chart using feature-rich SciChart.js chart library. Supports custom colors. Get your free trial now.
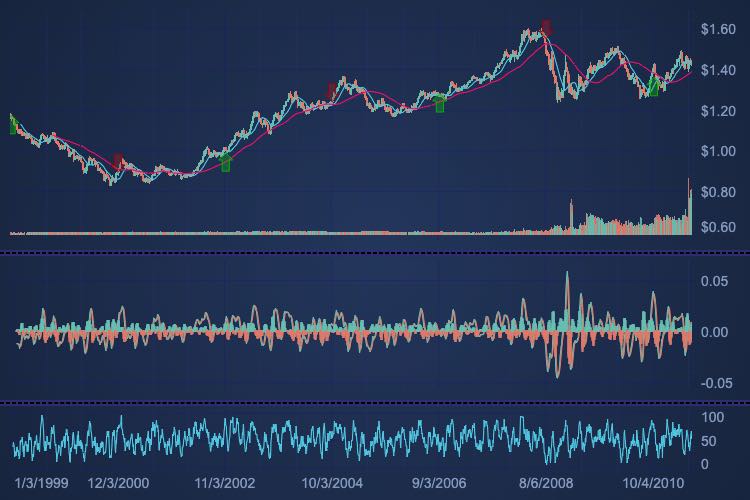
React Realtime Ticking Stock Charts
Create a React Realtime Ticking Candlestick / Stock Chart with live ticking and updating, using the high performance SciChart.js chart library. Get free demo now.
React Multi-Pane Stock Charts using Subcharts
Create a React Multi-Pane Candlestick / Stock Chart with indicator panels, synchronized zooming, panning and cursors. Get your free trial of SciChart.js now.

Tenor Curves Demo
Demonstrating the capability of SciChart.js to create a composite 2D & 3D Chart application. An example like this could be used to visualize Tenor curves in a financial setting, or other 2D/3D data combined on a single screen.
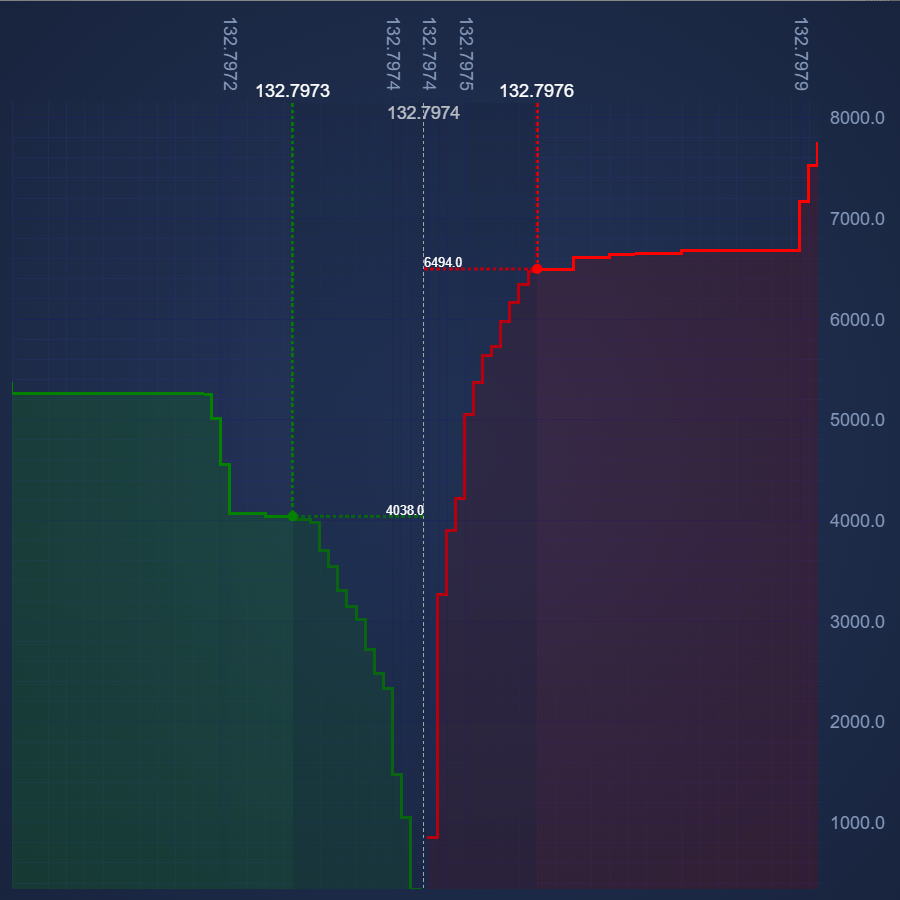
React Market Depth Chart
Create a React Depth Chart, using the high performance SciChart.js chart library. Get free demo now.
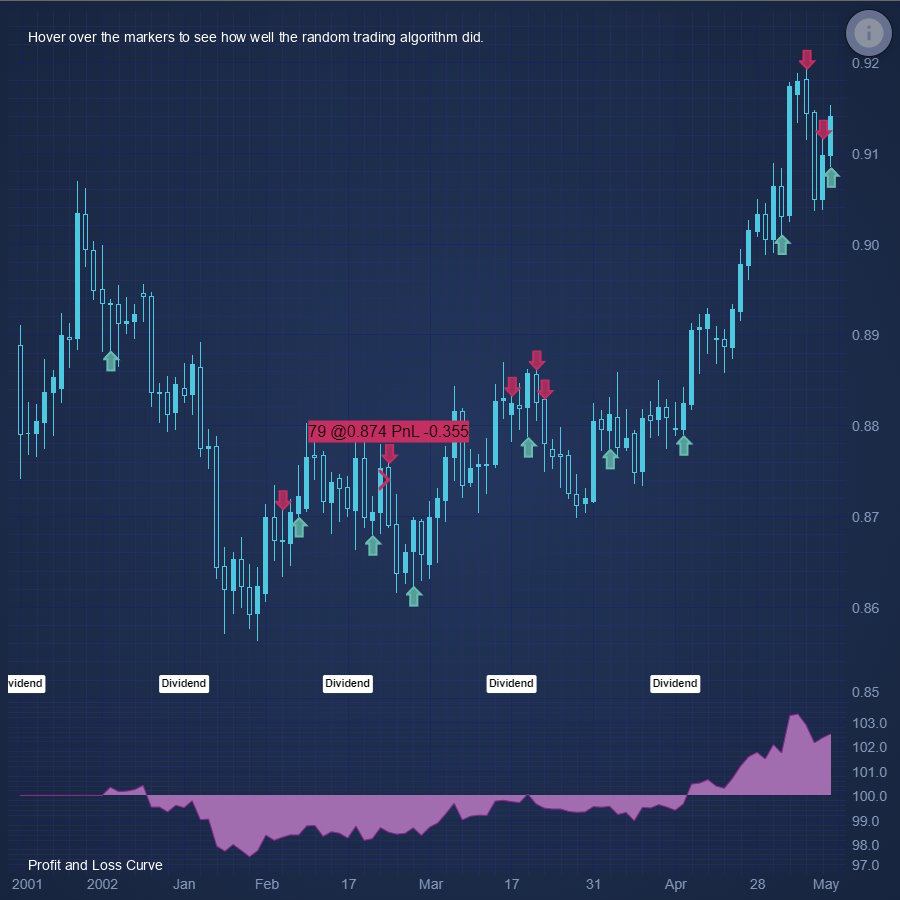
React Chart Hoverable Buy Sell Marker Annotations
Demonstrates how to place Buy/Sell arrow markers on a React Stock Chart using SciChart.js - Annotations API
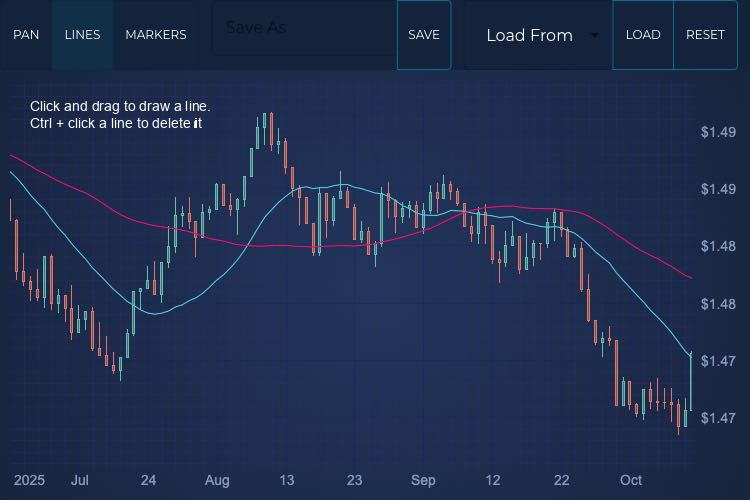
React User Annotated Stock Chart
This demo shows you how to create a <strong>{frameworkName} User Annotated Stock Chart</strong> using SciChart.js. Custom modifiers allow you to add lines and markers, then use the built in serialisation functions to save and reload the chart, including the data and all your custom annotations.