JavaScript Multi-Pane Stock Charts using Subcharts
Using the new Sub-Charts API, create a multi-pane stock chart example with indicator panels on a single WebGL chart surface. This allows for higher-performance since the WebGL context is shared. Zooming, panning, cursors are synchronised between the charts.
index.tsx
ExampleDataProvider.ts
theme.ts
FinChartLegendAnnotation.ts
FinChartLegendModifier.ts
1import {
2    SciChartSurface,
3    EDataSeriesType,
4    OhlcDataSeries,
5    XyyDataSeries,
6    CoordinateCalculatorBase,
7    EAnnotationType,
8    ISvgAnnotationBaseOptions,
9    SvgAnnotationBase,
10} from "scichart";
11
12export type TFinanceLegendTemplate = (legendAnnotation: FinChartLegendAnnotation) => string;
13
14export interface IFinChartLegendAnnotationOptions extends ISvgAnnotationBaseOptions {
15    template?: TFinanceLegendTemplate;
16    xIndex?: number;
17    paneId?: string;
18    offsetX?: number;
19    offsetY?: number;
20    title?: string;
21}
22
23/**
24 * A Tooltip Annotation which provides an SVG tooltip over the chart. Used by the {@link RolloverModifier}
25 */
26export class FinChartLegendAnnotation extends SvgAnnotationBase {
27    /** @inheritDoc */
28    public readonly type = EAnnotationType.SVG;
29    public readonly sciFinanceChart: SciChartSurface;
30    private templateProperty: TFinanceLegendTemplate = defaultFinanceLegendTemplate;
31    private xIndexProperty: number;
32    private paneIdProperty: string;
33    private offsetXProperty: number;
34    private offsetYProperty: number;
35    private activeSciChartSurfaceProperty: SciChartSurface;
36    private titleProperty: string = "Default Title";
37
38    /**
39     * Creates an instance of the {@link FinChartLegendAnnotation}
40     * @param sciFinanceChart
41     * @param options
42     */
43    constructor(sciFinanceChart: SciChartSurface, options?: IFinChartLegendAnnotationOptions) {
44        super(options);
45        this.sciFinanceChart = sciFinanceChart;
46        this.isHidden = true;
47        this.templateProperty = options?.template ?? this.templateProperty;
48        this.xIndexProperty = options?.xIndex ?? this.xIndexProperty;
49        this.paneIdProperty = options?.paneId ?? this.paneIdProperty;
50        this.offsetXProperty = options?.offsetX ?? this.offsetXProperty;
51        this.offsetYProperty = options?.offsetY ?? this.offsetYProperty;
52        this.titleProperty = options?.title ?? this.titleProperty;
53    }
54
55    public get template() {
56        return this.templateProperty;
57    }
58
59    public set template(value) {
60        this.templateProperty = value;
61    }
62
63    public get xIndex() {
64        return this.xIndexProperty;
65    }
66
67    public set xIndex(value) {
68        this.xIndexProperty = value;
69    }
70
71    public get paneId() {
72        return this.paneIdProperty;
73    }
74
75    public set paneId(value) {
76        this.paneIdProperty = value;
77    }
78
79    public get offsetX() {
80        return this.offsetXProperty;
81    }
82
83    public set offsetX(value) {
84        this.offsetXProperty = value;
85    }
86
87    public get offsetY() {
88        return this.offsetYProperty;
89    }
90
91    public set offsetY(value) {
92        this.offsetYProperty = value;
93    }
94
95    public get activeSciChartSurface() {
96        return this.activeSciChartSurfaceProperty;
97    }
98
99    public set activeSciChartSurface(value) {
100        this.activeSciChartSurfaceProperty = value;
101    }
102
103    public get title() {
104        return this.titleProperty;
105    }
106
107    public set title(value) {
108        this.titleProperty = value;
109    }
110
111    public update(xCalc: CoordinateCalculatorBase, yCalc: CoordinateCalculatorBase): void {
112        if (this.svg) {
113            this.delete();
114        }
115        this.create(xCalc, yCalc);
116    }
117
118    protected create(xCalc: CoordinateCalculatorBase, yCalc: CoordinateCalculatorBase) {
119        if (this.template) {
120            this.xIndex = this.isMouseOverSeriesArea ? Math.round(xCalc.getDataValue(this.x1)) : undefined;
121            if (this.xIndex === undefined) {
122                return;
123            }
124            const svgString = this.template(this);
125            const svgNode = document.createRange().createContextualFragment(svgString);
126            this.svgRoot.appendChild(svgNode);
127            this.setSvg(this.svgRoot.lastChild as SVGElement);
128            this.svg.setAttribute("x", this.offsetX.toString());
129            this.svg.setAttribute("y", this.offsetY.toString());
130        }
131    }
132
133    private get isMouseOverSeriesArea() {
134        return this.activeSciChartSurface;
135    }
136}
137
138/** @ignore */
139const defaultFinanceLegendTemplate: TFinanceLegendTemplate = (la: FinChartLegendAnnotation): string => {
140    const outputStrings: string[] = [];
141    const subSurface = la.sciFinanceChart.subCharts.find((study) => study.id === la.paneId);
142    let outputStr = "";
143    subSurface.renderableSeries.asArray().forEach(({ dataSeries }) => {
144        switch (dataSeries.type) {
145            case EDataSeriesType.Ohlc: {
146                const openValues = (dataSeries as OhlcDataSeries).getNativeOpenValues();
147                const highValues = (dataSeries as OhlcDataSeries).getNativeHighValues();
148                const lowValues = (dataSeries as OhlcDataSeries).getNativeLowValues();
149                const closeValues = (dataSeries as OhlcDataSeries).getNativeCloseValues();
150
151                const openValue = openValues.get(la.xIndex);
152                const highValue = highValues.get(la.xIndex);
153                const lowValue = lowValues.get(la.xIndex);
154                const closeValue = closeValues.get(la.xIndex);
155
156                outputStr += `${dataSeries.dataSeriesName} O: ${openValue} H: ${highValue} L: ${lowValue} C: ${closeValue}`;
157                break;
158            }
159
160            case EDataSeriesType.Xyy: {
161                const yValues = dataSeries.getNativeYValues();
162                const y1Values = (dataSeries as XyyDataSeries).getNativeY1Values();
163                const yValue = yValues.get(la.xIndex).toFixed(4);
164                const y1Value = y1Values.get(la.xIndex).toFixed(4);
165                outputStr += `${dataSeries.dataSeriesName} Y: ${yValue} Y1: ${y1Value}`;
166
167                break;
168            }
169
170            default: {
171                const yValues = dataSeries.getNativeYValues();
172                const yValue = yValues.get(la.xIndex).toFixed(4);
173                outputStr += `${dataSeries.dataSeriesName}: ${yValue}`;
174            }
175        }
176
177        if (outputStr) {
178            outputStrings.push(outputStr);
179            outputStr = "";
180        }
181    });
182
183    let outputSvgString = "";
184    outputStrings.forEach((outputStr, index) => {
185        const y = 30 + index * 20;
186        outputSvgString += `<text x="8" y="${y}" font-size="13" font-family="Verdana" fill="lightblue">${outputStr}</text>`;
187    });
188    return `<svg width="800" height="200">
189        <rect width="100%" height="100%" fill="#00000000" stroke="#00000000" stroke-width="2" />
190        <svg width="100%">
191            ${outputSvgString}
192        </svg>
193    </svg>`;
194};
195
See Also: Financial Charts (8 Demos)

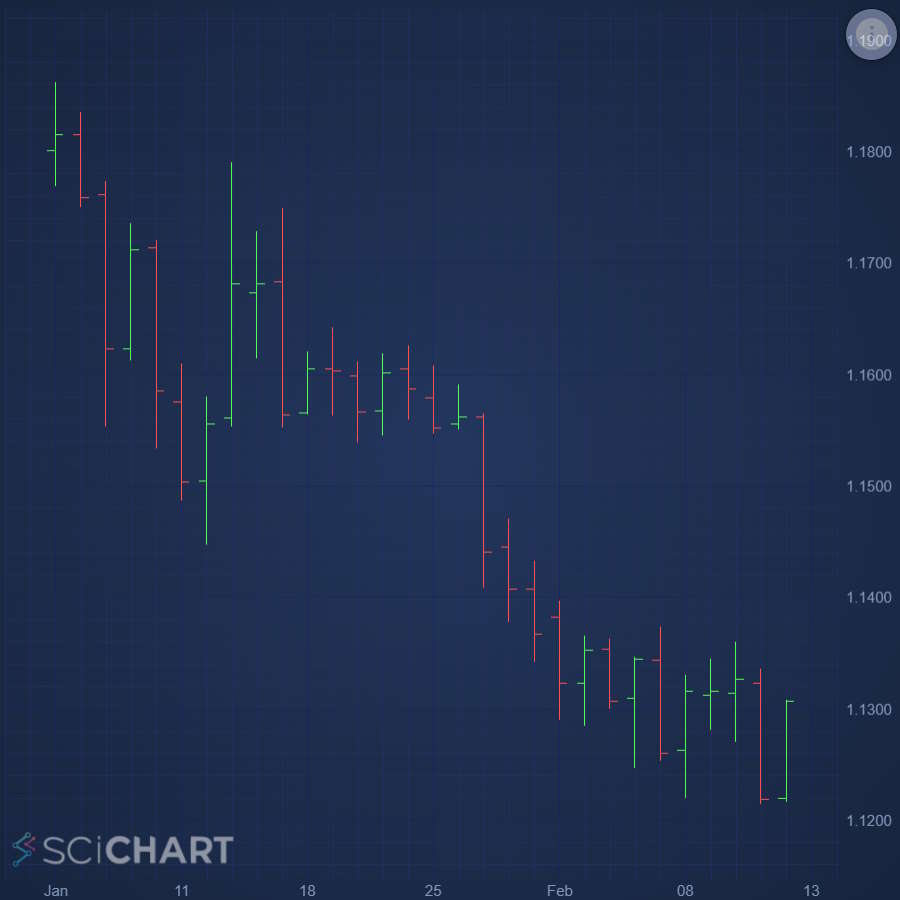
JavaScript Candlestick Chart
Discover how to create a JavaScript Candlestick Chart or Stock Chart using SciChart.js. For high Performance JavaScript Charts, get your free demo now.
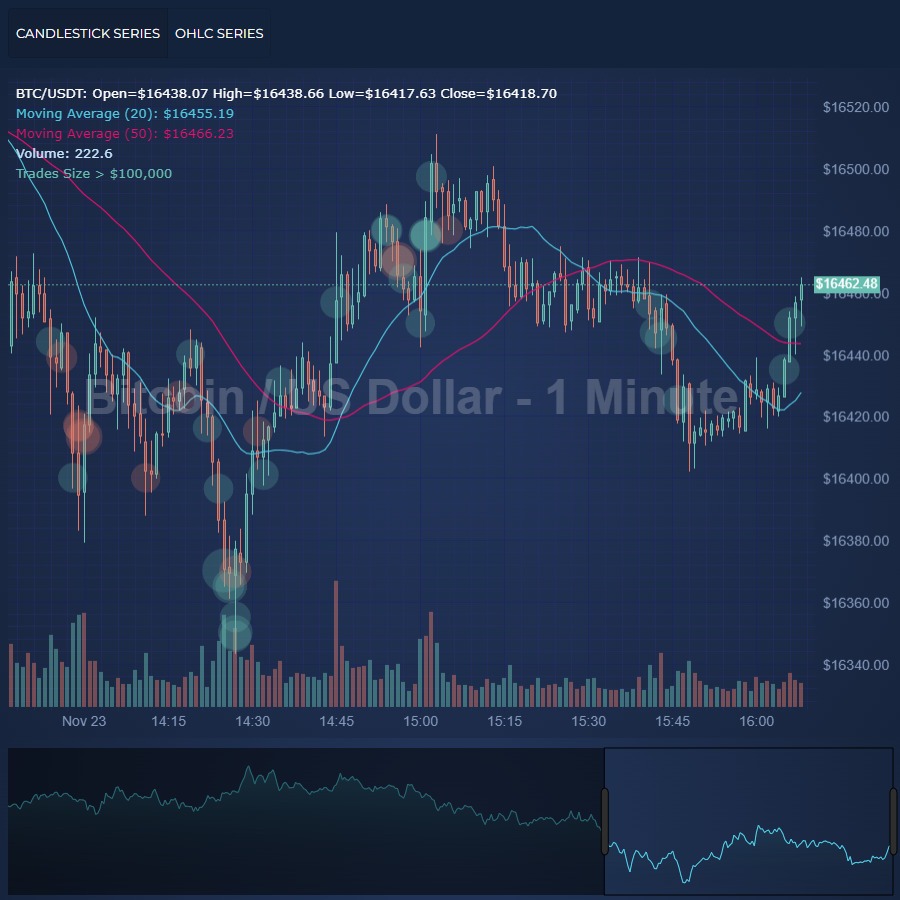
JavaScript OHLC Chart
Easily create JavaScript OHLC Chart or Stock Chart using feature-rich SciChart.js chart library. Supports custom colors. Get your free trial now.
JavaScript Realtime Ticking Stock Charts
Create a JavaScript Realtime Ticking Candlestick / Stock Chart with live ticking and updating, using the high performance SciChart.js chart library. Get free demo now.

Tenor Curves Demo
Demonstrating the capability of SciChart.js to create a composite 2D & 3D Chart application. An example like this could be used to visualize Tenor curves in a financial setting, or other 2D/3D data combined on a single screen.
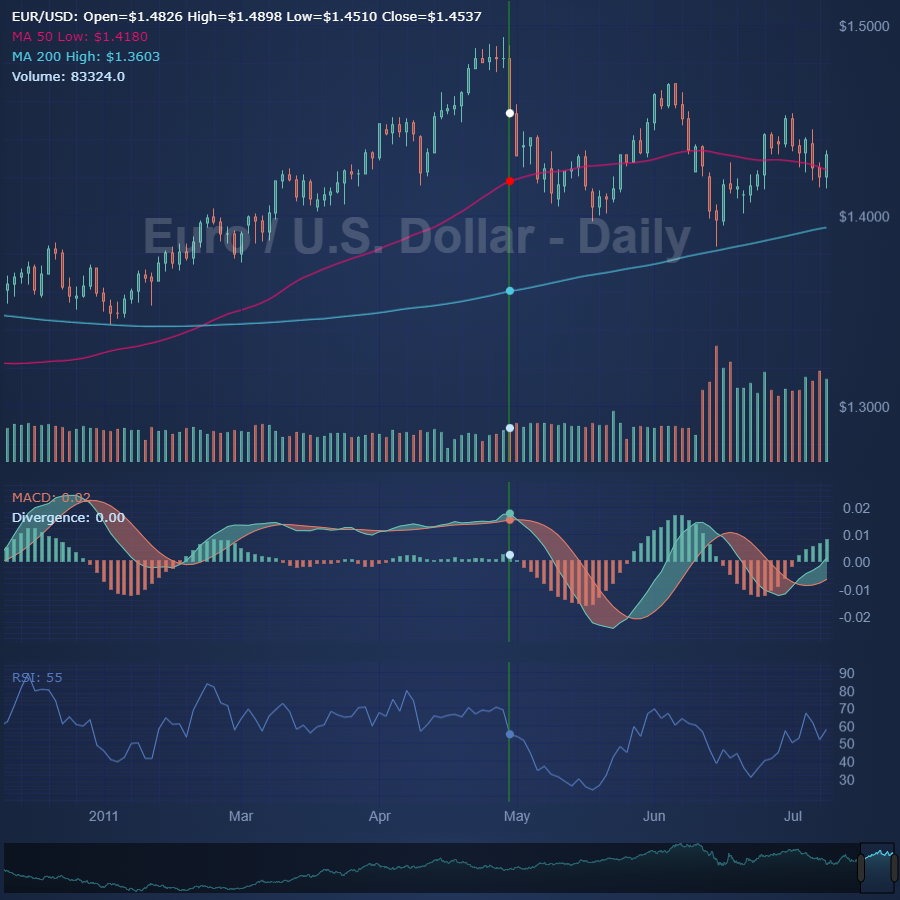
JavaScript Multi-Pane Stock Charts using Sync Multi-Chart
Create a JavaScript Multi-Pane Candlestick / Stock Chart with indicator panels, synchronized zooming, panning and cursors. Get your free trial of SciChart.js now.
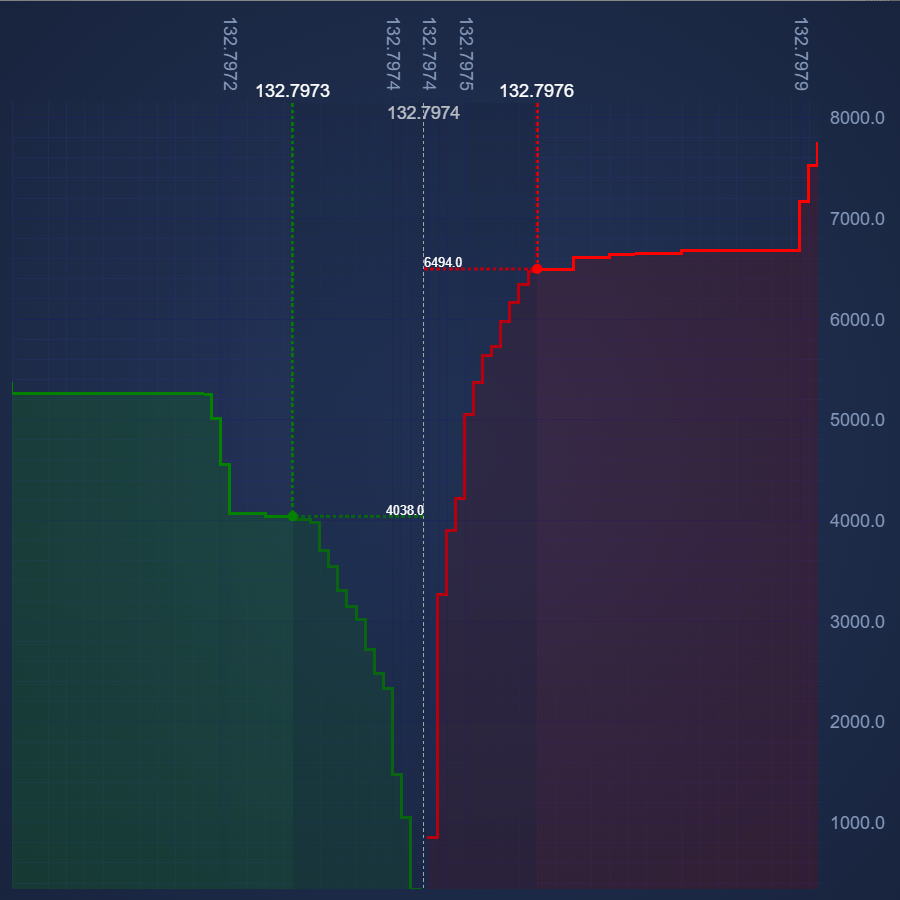
JavaScript Market Depth Chart
Create a JavaScript Depth Chart, using the high performance SciChart.js chart library. Get free demo now.
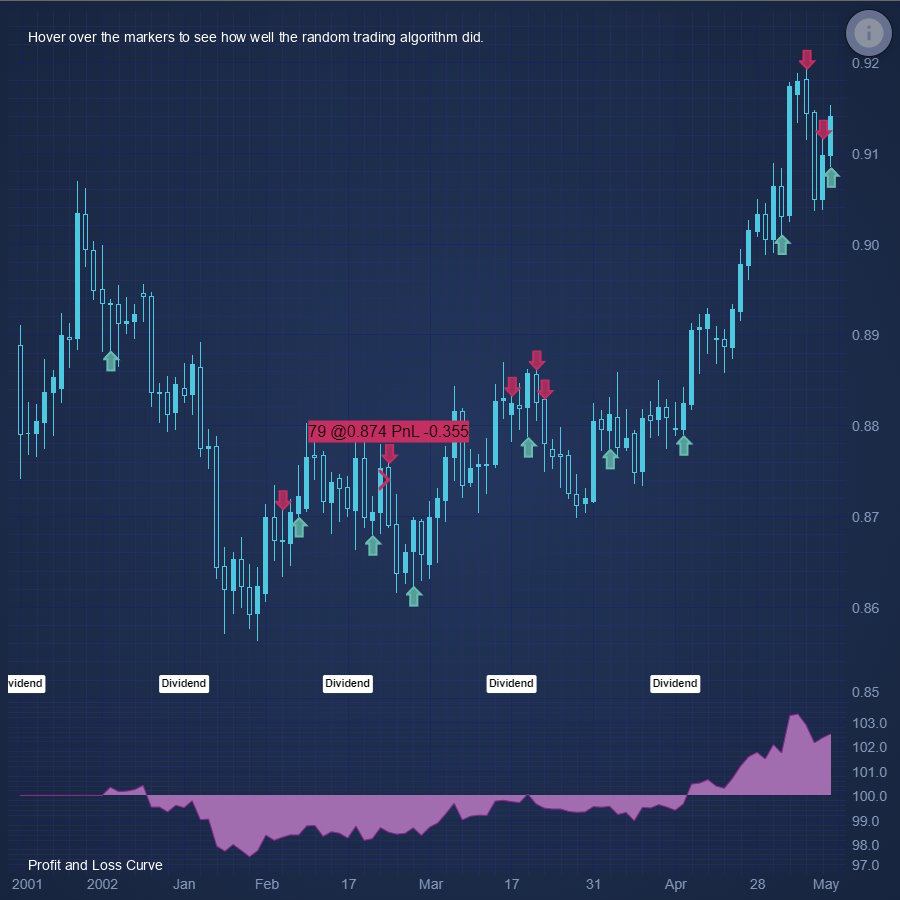
JavaScript Chart Hoverable Buy Sell Marker Annotations
Demonstrates how to place Buy/Sell arrow markers on a JavaScript Stock Chart using SciChart.js - Annotations API
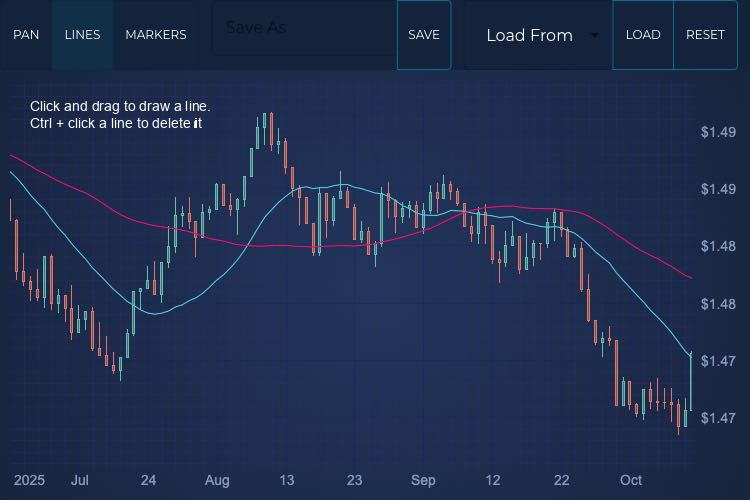
JavaScript User Annotated Stock Chart
This demo shows you how to create a <strong>{frameworkName} User Annotated Stock Chart</strong> using SciChart.js. Custom modifiers allow you to add lines and markers, then use the built in serialisation functions to save and reload the chart, including the data and all your custom annotations.