JavaScript Candlestick Chart
This demo shows you how to create a JavaScript Candlestick Chart or Stock Chart using SciChart.js. Data is fetched from Binance and placed on the chart. Two moving averages are added. Zooming, panning and tooltips as well. Switch between Candlestick or Ohlc, or see the Realtime Ticking Stock Charts demo which shows how to add live updates.
drawExample.ts
index.tsx
binanceRestClient.ts
ExampleDataProvider.ts
theme.ts
1// SCICHART EXAMPLE
2import {
3    CursorModifier,
4    CursorTooltipSvgAnnotation,
5    DateTimeNumericAxis,
6    EAutoRange,
7    EDataSeriesType,
8    EFillPaletteMode,
9    ENumericFormat,
10    ESeriesType,
11    FastCandlestickRenderableSeries,
12    FastColumnRenderableSeries,
13    FastLineRenderableSeries,
14    FastMountainRenderableSeries,
15    FastOhlcRenderableSeries,
16    GradientParams,
17    IFillPaletteProvider,
18    IPointMetadata,
19    IRenderableSeries,
20    MouseWheelZoomModifier,
21    NumberRange,
22    NumericAxis,
23    OhlcDataSeries,
24    OhlcSeriesInfo,
25    parseColorToUIntArgb,
26    Point,
27    SciChartOverview,
28    SciChartSurface,
29    SeriesInfo,
30    XyDataSeries,
31    XyMovingAverageFilter,
32    ZoomExtentsModifier,
33    ZoomPanModifier,
34} from "scichart";
35import { appTheme } from "../../../theme";
36import { simpleBinanceRestClient } from "../../../ExampleData/binanceRestClient";
37import { ExampleDataProvider, TPriceBar } from "../../../ExampleData/ExampleDataProvider";
38
39const Y_AXIS_VOLUME_ID = "Y_AXIS_VOLUME_ID";
40
41export const drawExample = (dataSource: string) => async (rootElement: string | HTMLDivElement) => {
42    // Create a SciChartSurface
43    const { sciChartSurface, wasmContext } = await SciChartSurface.create(rootElement, {
44        theme: appTheme.SciChartJsTheme,
45    });
46
47    // Add an XAxis of type DateTimeAxis
48    // Note for crypto data this is fine, but for stocks/forex you will need to use CategoryAxis which collapses gaps at weekends
49    // In future we have a hybrid IndexDateAxis which 'magically' solves problems of different # of points in stock market datasetd with gaps
50    const xAxis = new DateTimeNumericAxis(wasmContext, {
51        // autoRange.never as we're setting visibleRange explicitly below. If you dont do this, leave this flag default
52        autoRange: EAutoRange.Never,
53    });
54    sciChartSurface.xAxes.add(xAxis);
55
56    // Create a NumericAxis on the YAxis with 2 Decimal Places
57    sciChartSurface.yAxes.add(
58        new NumericAxis(wasmContext, {
59            growBy: new NumberRange(0.1, 0.1),
60            labelFormat: ENumericFormat.Decimal,
61            labelPrecision: 2,
62            labelPrefix: "$",
63            autoRange: EAutoRange.Always,
64        })
65    );
66
67    // Create a secondary YAxis to host volume data on its own scale
68    sciChartSurface.yAxes.add(
69        new NumericAxis(wasmContext, {
70            id: Y_AXIS_VOLUME_ID,
71            growBy: new NumberRange(0, 4),
72            isVisible: false,
73            autoRange: EAutoRange.Always,
74        })
75    );
76
77    const xValues: number[] = [];
78    const openValues: number[] = [];
79    const highValues: number[] = [];
80    const lowValues: number[] = [];
81    const closeValues: number[] = [];
82    const volumeValues: number[] = [];
83
84    // Fetch data from now to 300 1hr candles ago
85    const endDate = new Date(Date.now());
86    const startDate = new Date();
87    startDate.setHours(endDate.getHours() - 300);
88    let priceBars: TPriceBar[];
89    if (dataSource !== "Random") {
90        priceBars = await simpleBinanceRestClient.getCandles("BTCUSDT", "1h", startDate, endDate, 500, dataSource);
91    } else {
92        priceBars = ExampleDataProvider.getRandomCandles(300, 60000, startDate, 60 * 60);
93    }
94    // Maps PriceBar { date, open, high, low, close, volume } to structure-of-arrays expected by scichart
95    priceBars.forEach((priceBar: any) => {
96        xValues.push(priceBar.date);
97        openValues.push(priceBar.open);
98        highValues.push(priceBar.high);
99        lowValues.push(priceBar.low);
100        closeValues.push(priceBar.close);
101        volumeValues.push(priceBar.volume);
102    });
103    // Zoom to the latest 100 candles
104    const startViewportRange = new Date();
105    startViewportRange.setHours(startDate.getHours() - 100);
106    xAxis.visibleRange = new NumberRange(startViewportRange.getTime() / 1000, endDate.getTime() / 1000);
107
108    // Create and add the Candlestick series
109    // The Candlestick Series requires a special dataseries type called OhlcDataSeries with o,h,l,c and date values
110    const candleDataSeries = new OhlcDataSeries(wasmContext, {
111        xValues,
112        openValues,
113        highValues,
114        lowValues,
115        closeValues,
116        dataSeriesName: dataSource === "Random" ? "Random" : "BTC/USDT",
117    });
118    const candlestickSeries = new FastCandlestickRenderableSeries(wasmContext, {
119        dataSeries: candleDataSeries,
120        stroke: appTheme.ForegroundColor, // used by cursorModifier below
121        strokeThickness: 1,
122        brushUp: appTheme.VividGreen + "77",
123        brushDown: appTheme.MutedRed + "77",
124        strokeUp: appTheme.VividGreen,
125        strokeDown: appTheme.MutedRed,
126    });
127    sciChartSurface.renderableSeries.add(candlestickSeries);
128
129    // Add an Ohlcseries. this will be invisible to begin with
130    const ohlcSeries = new FastOhlcRenderableSeries(wasmContext, {
131        dataSeries: candleDataSeries,
132        stroke: appTheme.ForegroundColor, // used by cursorModifier below
133        strokeThickness: 1,
134        dataPointWidth: 0.9,
135        strokeUp: appTheme.VividGreen,
136        strokeDown: appTheme.MutedRed,
137        isVisible: false,
138    });
139    sciChartSurface.renderableSeries.add(ohlcSeries);
140
141    // Add some moving averages using SciChart's filters/transforms API
142    // when candleDataSeries updates, XyMovingAverageFilter automatically recomputes
143    sciChartSurface.renderableSeries.add(
144        new FastLineRenderableSeries(wasmContext, {
145            dataSeries: new XyMovingAverageFilter(candleDataSeries, {
146                dataSeriesName: "Moving Average (20)",
147                length: 20,
148            }),
149            stroke: appTheme.VividSkyBlue,
150        })
151    );
152
153    sciChartSurface.renderableSeries.add(
154        new FastLineRenderableSeries(wasmContext, {
155            dataSeries: new XyMovingAverageFilter(candleDataSeries, {
156                dataSeriesName: "Moving Average (50)",
157                length: 50,
158            }),
159            stroke: appTheme.VividPink,
160        })
161    );
162
163    // Add volume data onto the chart
164    sciChartSurface.renderableSeries.add(
165        new FastColumnRenderableSeries(wasmContext, {
166            dataSeries: new XyDataSeries(wasmContext, { xValues, yValues: volumeValues, dataSeriesName: "Volume" }),
167            strokeThickness: 0,
168            // This is how we get volume to scale - on a hidden YAxis
169            yAxisId: Y_AXIS_VOLUME_ID,
170            // This is how we colour volume bars red or green
171            paletteProvider: new VolumePaletteProvider(
172                candleDataSeries,
173                appTheme.VividGreen + "77",
174                appTheme.MutedRed + "77"
175            ),
176        })
177    );
178
179    // Optional: Add some interactivity modifiers
180    sciChartSurface.chartModifiers.add(
181        new ZoomExtentsModifier(),
182        new ZoomPanModifier({ enableZoom: true }),
183        new MouseWheelZoomModifier(),
184        new CursorModifier({
185            crosshairStroke: appTheme.VividOrange,
186            axisLabelFill: appTheme.VividOrange,
187            tooltipLegendTemplate: getTooltipLegendTemplate,
188        })
189    );
190
191    // Add Overview chart. This will automatically bind to the parent surface
192    // displaying its series. Zooming the chart will zoom the overview and vice versa
193
194    //Exporting at the bottom by an object-
195    // const overview = await SciChartOverview.create(sciChartSurface, divOverviewId, {
196    //     theme: appTheme.SciChartJsTheme,
197    //     transformRenderableSeries: getOverviewSeries,
198    // });
199
200    return { sciChartSurface, candlestickSeries, ohlcSeries };
201};
202
203class VolumePaletteProvider implements IFillPaletteProvider {
204    fillPaletteMode: EFillPaletteMode = EFillPaletteMode.SOLID;
205    private ohlcDataSeries: OhlcDataSeries;
206    private upColorArgb: number;
207    private downColorArgb: number;
208
209    constructor(masterData: OhlcDataSeries, upColor: string, downColor: string) {
210        this.upColorArgb = parseColorToUIntArgb(upColor);
211        this.downColorArgb = parseColorToUIntArgb(downColor);
212        this.ohlcDataSeries = masterData;
213    }
214    onAttached(parentSeries: IRenderableSeries): void {}
215    onDetached(): void {}
216
217    // Return up or down color for the volume bars depending on Ohlc data
218    overrideFillArgb(
219        xValue: number,
220        yValue: number,
221        index: number,
222        opacity?: number,
223        metadata?: IPointMetadata
224    ): number {
225        const isUpCandle =
226            this.ohlcDataSeries.getNativeOpenValues().get(index) >=
227            this.ohlcDataSeries.getNativeCloseValues().get(index);
228        return isUpCandle ? this.upColorArgb : this.downColorArgb;
229    }
230
231    // Override stroke as well, even though strokethickness is 0, because stroke is used if column thickness goes to 0.
232    overrideStrokeArgb(
233        xValue: number,
234        yValue: number,
235        index: number,
236        opacity?: number,
237        metadata?: IPointMetadata
238    ): number {
239        return this.overrideFillArgb(xValue, yValue, index, opacity, metadata);
240    }
241}
242
243// Override the standard tooltip displayed by CursorModifier
244const getTooltipLegendTemplate = (seriesInfos: SeriesInfo[], svgAnnotation: CursorTooltipSvgAnnotation) => {
245    let outputSvgString = "";
246
247    // Foreach series there will be a seriesInfo supplied by SciChart. This contains info about the series under the house
248    seriesInfos.forEach((seriesInfo, index) => {
249        const y = 20 + index * 20;
250        const textColor = seriesInfo.stroke;
251        let legendText = seriesInfo.formattedYValue;
252        if (seriesInfo.dataSeriesType === EDataSeriesType.Ohlc) {
253            const o = seriesInfo as OhlcSeriesInfo;
254            legendText = `Open=${o.formattedOpenValue} High=${o.formattedHighValue} Low=${o.formattedLowValue} Close=${o.formattedCloseValue}`;
255        }
256        outputSvgString += `<text x="8" y="${y}" font-size="13" font-family="Verdana" fill="${textColor}">
257            ${seriesInfo.seriesName}: ${legendText}
258        </text>`;
259    });
260
261    return `<svg width="100%" height="100%">
262                ${outputSvgString}
263            </svg>`;
264};
265
266// Override the Renderableseries to display on the scichart overview
267const getOverviewSeries = (defaultSeries: IRenderableSeries) => {
268    if (defaultSeries.type === ESeriesType.CandlestickSeries) {
269        // Swap the default candlestick series on the overview chart for a mountain series. Same data
270        return new FastMountainRenderableSeries(defaultSeries.parentSurface.webAssemblyContext2D, {
271            dataSeries: defaultSeries.dataSeries,
272            fillLinearGradient: new GradientParams(new Point(0, 0), new Point(0, 1), [
273                { color: appTheme.VividSkyBlue + "77", offset: 0 },
274                { color: "Transparent", offset: 1 },
275            ]),
276            stroke: appTheme.VividSkyBlue,
277        });
278    }
279    // hide all other series
280    return undefined;
281};
282
283export const overviewOptions = {
284    theme: appTheme.SciChartJsTheme,
285    transformRenderableSeries: getOverviewSeries,
286};
287
See Also: Financial Charts (8 Demos)
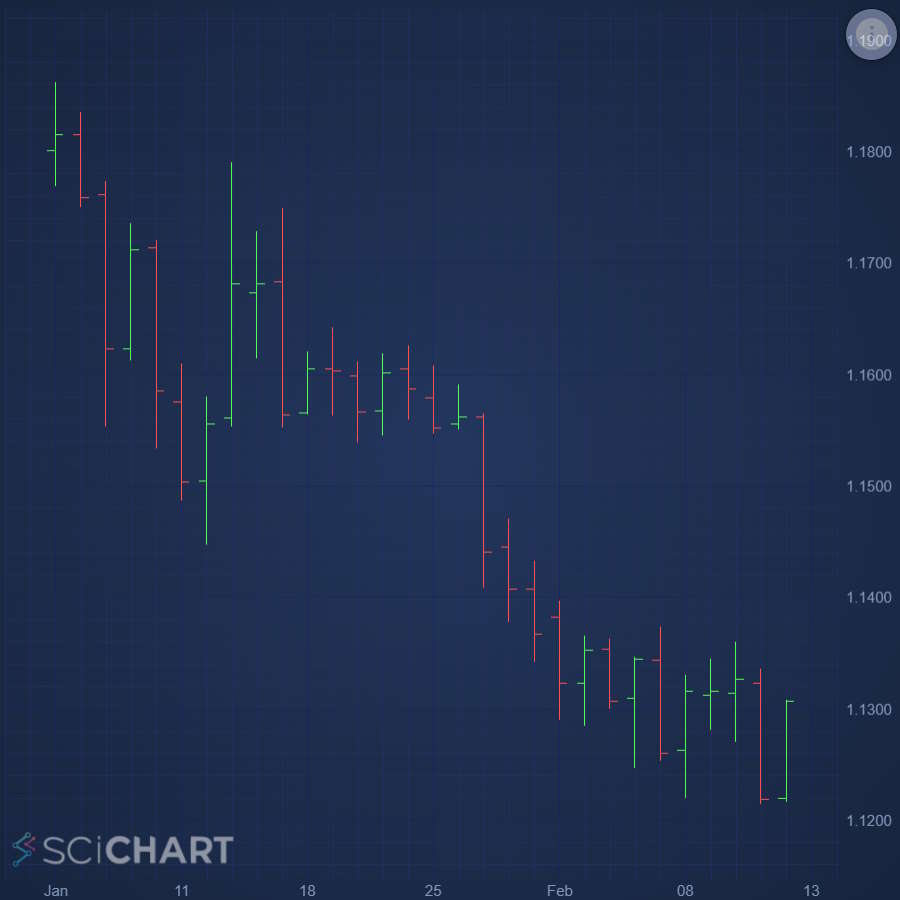
JavaScript OHLC Chart
Easily create JavaScript OHLC Chart or Stock Chart using feature-rich SciChart.js chart library. Supports custom colors. Get your free trial now.
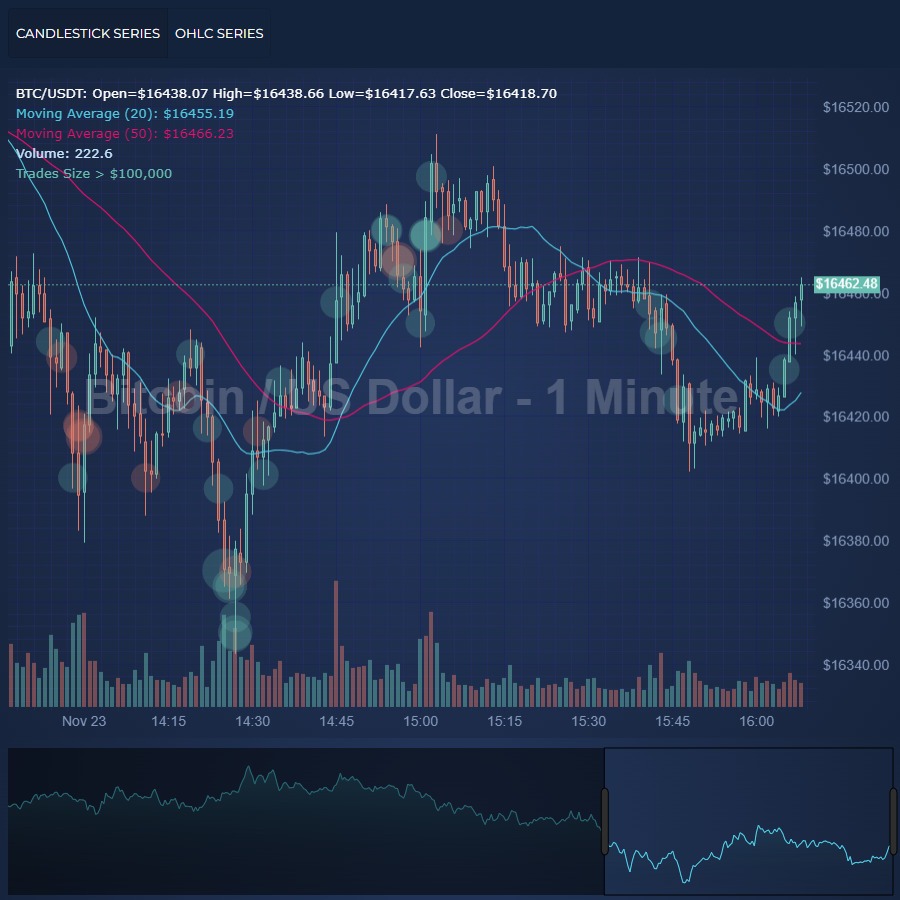
JavaScript Realtime Ticking Stock Charts
Create a JavaScript Realtime Ticking Candlestick / Stock Chart with live ticking and updating, using the high performance SciChart.js chart library. Get free demo now.
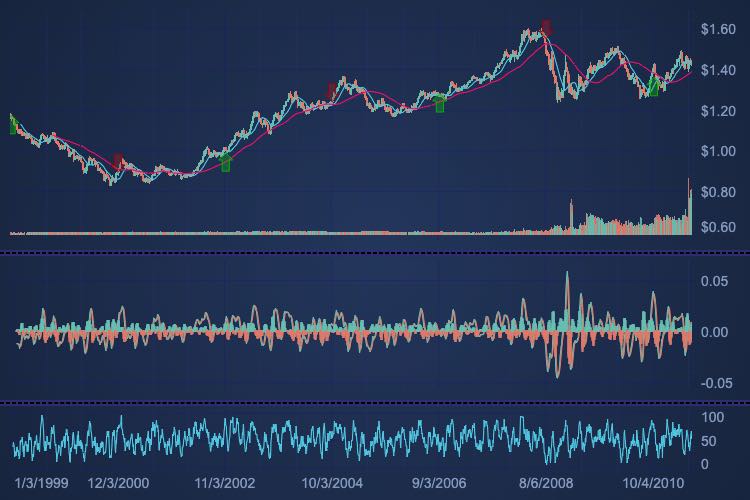
JavaScript Multi-Pane Stock Charts using Subcharts
Create a JavaScript Multi-Pane Candlestick / Stock Chart with indicator panels, synchronized zooming, panning and cursors. Get your free trial of SciChart.js now.

Tenor Curves Demo
Demonstrating the capability of SciChart.js to create a composite 2D & 3D Chart application. An example like this could be used to visualize Tenor curves in a financial setting, or other 2D/3D data combined on a single screen.
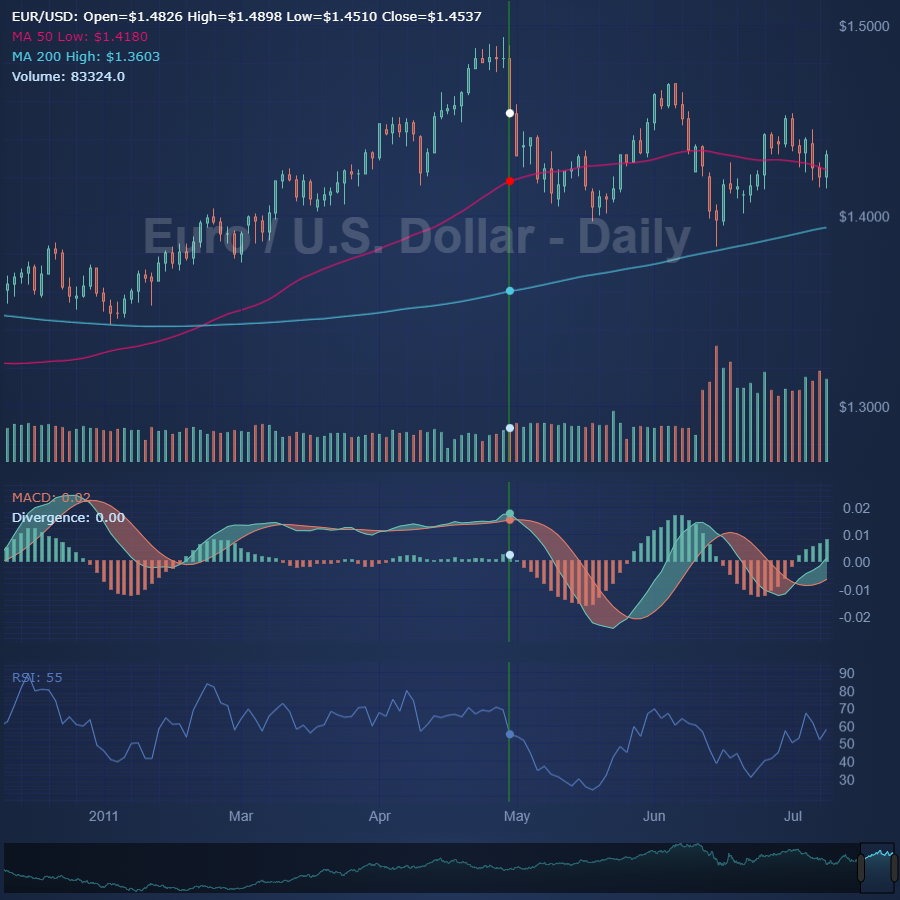
JavaScript Multi-Pane Stock Charts using Sync Multi-Chart
Create a JavaScript Multi-Pane Candlestick / Stock Chart with indicator panels, synchronized zooming, panning and cursors. Get your free trial of SciChart.js now.
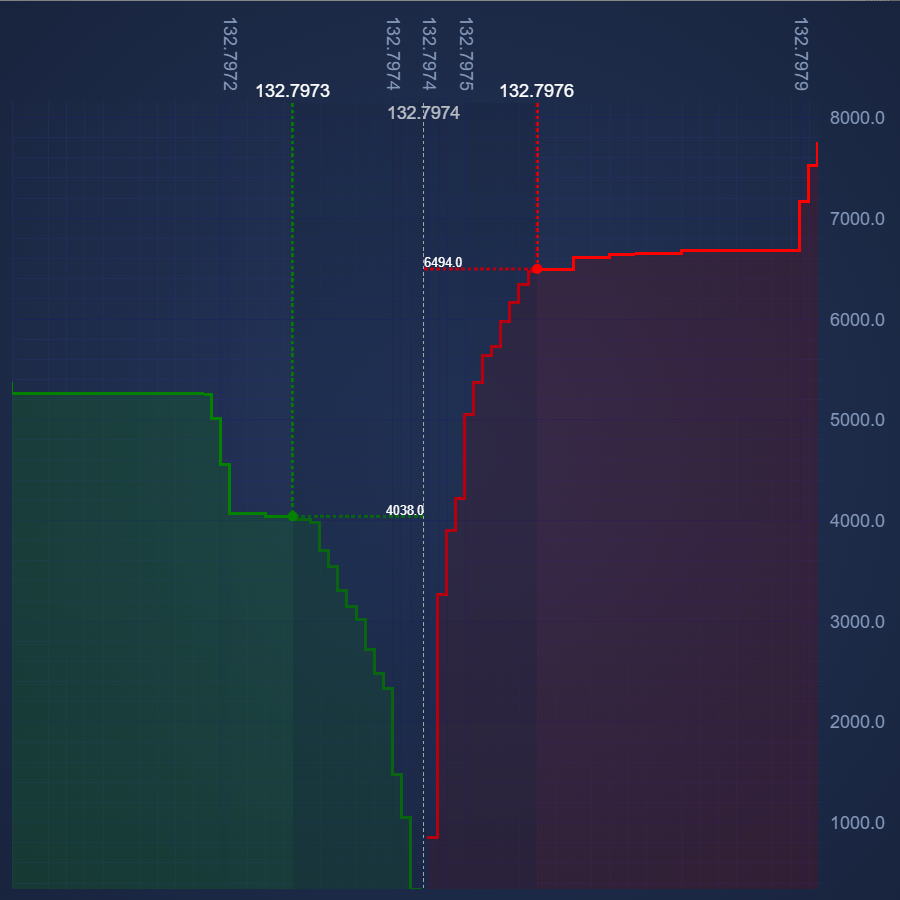
JavaScript Market Depth Chart
Create a JavaScript Depth Chart, using the high performance SciChart.js chart library. Get free demo now.
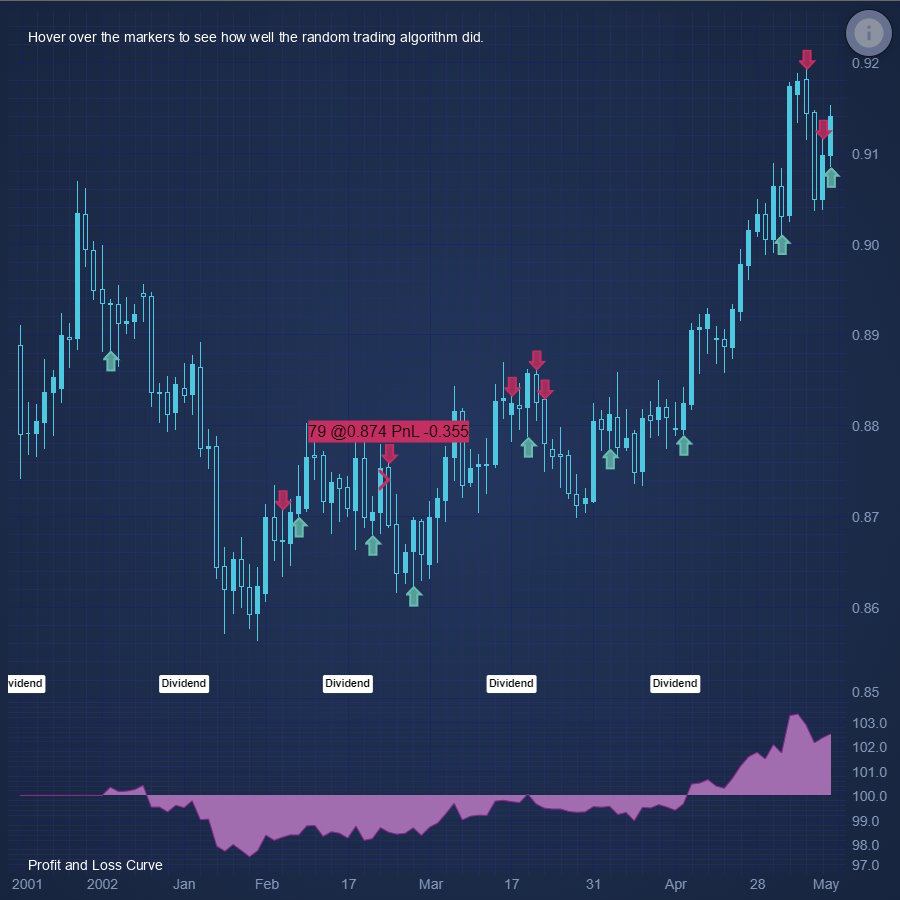
JavaScript Chart Hoverable Buy Sell Marker Annotations
Demonstrates how to place Buy/Sell arrow markers on a JavaScript Stock Chart using SciChart.js - Annotations API
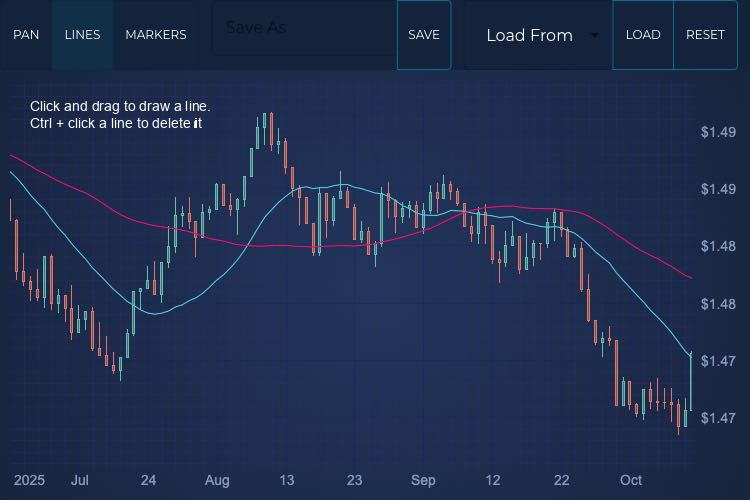
JavaScript User Annotated Stock Chart
This demo shows you how to create a <strong>{frameworkName} User Annotated Stock Chart</strong> using SciChart.js. Custom modifiers allow you to add lines and markers, then use the built in serialisation functions to save and reload the chart, including the data and all your custom annotations.