React Chart Editable Annotations
Demonstrates how to edit Annotations (shapes, boxes, lines, text, horizontal and vertical line) to a React Chart using SciChart.js, High Performance JavaScript Charts
drawExample.ts
index.tsx
theme.ts
1import { appTheme } from "../../../theme";
2// import SciChartImage from "./scichart-logo-white.png";
3import {
4    SciChartSurface,
5    NumericAxis,
6    NumberRange,
7    ZoomPanModifier,
8    MouseWheelZoomModifier,
9    LineAnnotation,
10    HorizontalLineAnnotation,
11    VerticalLineAnnotation,
12    BoxAnnotation,
13    CustomAnnotation,
14    TextAnnotation,
15    EHorizontalAnchorPoint,
16    EVerticalAnchorPoint,
17    ECoordinateMode,
18    ELabelPlacement,
19    ZoomExtentsModifier,
20    EWrapTo,
21    NativeTextAnnotation,
22    AnnotationHoverEventArgs,
23    AnnotationHoverModifier,
24    AnnotationBase,
25    EHoverMode,
26    translateFromCanvasToSeriesViewRect,
27    DpiHelper,
28    GenericAnimation,
29    easing,
30    Thickness,
31    translateToNotScaled,
32    EAnnotationType,
33} from "scichart";
34
35const getImageAnnotation = (x1: number, y1: number, image: any, width: number, height: number): CustomAnnotation => {
36    return new CustomAnnotation({
37        x1,
38        y1,
39        verticalAnchorPoint: EVerticalAnchorPoint.Top,
40        horizontalAnchorPoint: EHorizontalAnchorPoint.Left,
41        svgString: `<svg width="${width}" height="${height}" xmlns="http://www.w3.org/2000/svg" style="background-color:transparent">
42                        <image href="${image}" height="${height}" width="${width}"/>
43                    </svg>`,
44    });
45};
46
47export const drawExample = (SciChartImage: string) => async (rootElement: string | HTMLDivElement) => {
48    const { sciChartSurface, wasmContext } = await SciChartSurface.create(rootElement, {
49        theme: appTheme.SciChartJsTheme,
50    });
51
52    // Create an X,Y axis
53    sciChartSurface.xAxes.add(
54        new NumericAxis(wasmContext, {
55            visibleRange: new NumberRange(0, 10),
56        })
57    );
58    sciChartSurface.yAxes.add(
59        new NumericAxis(wasmContext, {
60            visibleRange: new NumberRange(0, 10),
61        })
62    );
63
64    const textColor = appTheme.ForegroundColor;
65
66    const text1 = new TextAnnotation({ text: "Editable Chart Annotations", fontSize: 24, x1: 0.3, y1: 9.7, textColor });
67    const text2 = new TextAnnotation({
68        text: "Click, Drag and Resize annotations with the mouse",
69        fontSize: 18,
70        x1: 0.5,
71        y1: 9,
72        textColor,
73    });
74
75    const horizontalLineAnnotation1 = new HorizontalLineAnnotation({
76        stroke: appTheme.VividOrange,
77        strokeThickness: 3,
78        y1: 5,
79        x1: 5,
80        showLabel: true,
81        labelPlacement: ELabelPlacement.TopLeft,
82        labelValue: "Not Editable",
83    });
84    const horizontalLineAnnotation2 = new HorizontalLineAnnotation({
85        stroke: appTheme.VividSkyBlue,
86        strokeThickness: 3,
87        y1: 4,
88        showLabel: true,
89        labelPlacement: ELabelPlacement.TopRight,
90        labelValue: "Draggable HorizontalLineAnnotation",
91        axisLabelFill: appTheme.VividSkyBlue,
92        axisLabelStroke: appTheme.ForegroundColor,
93        isEditable: true,
94    });
95
96    const verticalLineAnnotation = new VerticalLineAnnotation({
97        stroke: appTheme.VividSkyBlue,
98        strokeThickness: 3,
99        x1: 9,
100        showLabel: true,
101        labelPlacement: ELabelPlacement.TopRight,
102        labelValue: "Draggable VerticalLineAnnotation",
103        axisLabelFill: appTheme.VividSkyBlue,
104        axisLabelStroke: appTheme.ForegroundColor,
105        isEditable: true,
106    });
107
108    const lineAnnotation = new LineAnnotation({
109        stroke: appTheme.VividOrange,
110        strokeThickness: 3,
111        x1: 5.5,
112        x2: 7.0,
113        y1: 6.0,
114        y2: 9.0,
115        isEditable: true,
116    });
117
118    const boxAnnotation = new BoxAnnotation({
119        stroke: appTheme.VividSkyBlue,
120        strokeThickness: 1,
121        fill: appTheme.VividSkyBlue + "33",
122        x1: 1.0,
123        x2: 4.0,
124        y1: 5.0,
125        y2: 7.0,
126        isEditable: true,
127    });
128
129    const imageAnnotation = getImageAnnotation(7, 7, SciChartImage, 241, 62);
130    imageAnnotation.isEditable = true;
131
132    const textAnnotation = new TextAnnotation({
133        x1: 1,
134        y1: 2,
135        xCoordinateMode: ECoordinateMode.DataValue,
136        yCoordinateMode: ECoordinateMode.DataValue,
137        horizontalAnchorPoint: EHorizontalAnchorPoint.Left,
138        verticalAnchorPoint: EVerticalAnchorPoint.Center,
139        textColor,
140        fontSize: 26,
141        fontFamily: "Arial",
142        text: "Unmovable text",
143        isEditable: false,
144    });
145
146    const hoverableTextAnnotation = new TextAnnotation({
147        x1: 1,
148        y1: 1,
149        xCoordinateMode: ECoordinateMode.DataValue,
150        yCoordinateMode: ECoordinateMode.DataValue,
151        horizontalAnchorPoint: EHorizontalAnchorPoint.Left,
152        verticalAnchorPoint: EVerticalAnchorPoint.Center,
153        textColor,
154        fontSize: 26,
155        fontFamily: "Arial",
156        text: "Hover me to select",
157        isEditable: true,
158        onHover: (args: AnnotationHoverEventArgs) => {
159            const { isHovered, sender } = args;
160            if (isHovered) {
161                // This sets isSelected on the target annotation
162                sender.parentSurface.adornerLayer.selectAnnotation(args.mouseArgs);
163            } else {
164                // this does not actually deselect the annotation on the surface
165                sender.isSelected = false;
166                // so we manually deselect it
167                sender.parentSurface.adornerLayer.deselectAnnotation(sender);
168            }
169        },
170    });
171
172    const textAnnotationSciChart = new TextAnnotation({
173        x1: 1,
174        y1: 3,
175        xCoordinateMode: ECoordinateMode.DataValue,
176        yCoordinateMode: ECoordinateMode.DataValue,
177        horizontalAnchorPoint: EHorizontalAnchorPoint.Left,
178        verticalAnchorPoint: EVerticalAnchorPoint.Center,
179        textColor,
180        fontSize: 26,
181        fontFamily: "Arial",
182        text: "Moveable TextAnnotation",
183        isEditable: true,
184    });
185
186    const nativetextWrap = new NativeTextAnnotation({
187        x1: 5,
188        x2: 9,
189        y1: 3,
190        xCoordinateMode: ECoordinateMode.DataValue,
191        yCoordinateMode: ECoordinateMode.DataValue,
192        horizontalAnchorPoint: EHorizontalAnchorPoint.Left,
193        verticalAnchorPoint: EVerticalAnchorPoint.Center,
194        textColor: appTheme.PalePurple,
195        fontSize: 24,
196        fontFamily: "Arial",
197        text: "Native Text Annotations support wordwrap.  Resize me!",
198        isEditable: true,
199        wrapTo: EWrapTo.Annotation,
200    });
201
202    const nativetextScale = new NativeTextAnnotation({
203        x1: 5,
204        x2: 9,
205        y1: 2,
206        xCoordinateMode: ECoordinateMode.DataValue,
207        yCoordinateMode: ECoordinateMode.DataValue,
208        horizontalAnchorPoint: EHorizontalAnchorPoint.Left,
209        verticalAnchorPoint: EVerticalAnchorPoint.Center,
210        textColor: appTheme.PalePurple,
211        fontSize: 24,
212        fontFamily: "Arial",
213        text: "Native Text Annotations can scale on resize.",
214        isEditable: true,
215        scaleOnResize: true,
216    });
217
218    const tooltipPreviewAnnotation = new TextAnnotation({
219        x1: 1,
220        y1: 8,
221        xCoordinateMode: ECoordinateMode.DataValue,
222        yCoordinateMode: ECoordinateMode.DataValue,
223        textColor: appTheme.ForegroundColor,
224        fontSize: 16,
225        text: `Move mouse over an annotation to get a tooltip with its type.<tspan x="4" dy="1.2em">The tooltip itself is also an annotation.</tspan>`,
226        padding: Thickness.fromNumber(4),
227        background: "black",
228    });
229
230    const tooltipAnnotation = new TextAnnotation({
231        x1: 0,
232        y1: 0,
233        xCoordShift: 20,
234        yCoordShift: 20,
235        xCoordinateMode: ECoordinateMode.Pixel,
236        yCoordinateMode: ECoordinateMode.Pixel,
237        horizontalAnchorPoint: EHorizontalAnchorPoint.Left,
238        verticalAnchorPoint: EVerticalAnchorPoint.Top,
239        textColor: appTheme.ForegroundColor,
240        fontSize: 16,
241        text: "",
242        padding: Thickness.fromNumber(4),
243        background: "black",
244        isHidden: true,
245    });
246
247    sciChartSurface.annotations.add(
248        text1,
249        text2,
250        horizontalLineAnnotation1,
251        horizontalLineAnnotation2,
252        verticalLineAnnotation,
253        lineAnnotation,
254        boxAnnotation,
255        imageAnnotation,
256        textAnnotation,
257        textAnnotationSciChart,
258        nativetextWrap,
259        nativetextScale,
260        hoverableTextAnnotation,
261        // customAnnotation,
262        tooltipPreviewAnnotation,
263        tooltipAnnotation
264    );
265
266    sciChartSurface.chartModifiers.add(new ZoomPanModifier({ enableZoom: true }));
267    sciChartSurface.chartModifiers.add(new ZoomExtentsModifier());
268    sciChartSurface.chartModifiers.add(new MouseWheelZoomModifier());
269
270    let currentTooltipAnimation: GenericAnimation<number>;
271    const animateTooltip = () => {
272        currentTooltipAnimation?.cancel();
273        tooltipAnnotation.isHidden = true;
274        currentTooltipAnimation = new GenericAnimation<number>({
275            from: 0,
276            to: 1,
277            duration: 0,
278            delay: 500,
279            ease: easing.linear,
280            onAnimate: (from: number, to: number, progress) => {},
281            onCompleted: () => {
282                tooltipAnnotation.isHidden = false;
283            },
284        });
285        sciChartSurface.addAnimation(currentTooltipAnimation);
286    };
287
288    const annotationHoverModifier = new AnnotationHoverModifier({
289        // check hover on all annotations except the one used for tooltip
290        targets: (modifier) =>
291            modifier.parentSurface.annotations.asArray().filter((annotation) => annotation !== tooltipAnnotation),
292        // ignore tooltip annotation if it is overlapping with other
293        hoverMode: EHoverMode.TopmostIncluded,
294        // needed to update tooltip position when moving the cursor within an annotation
295        notifyPositionUpdate: true,
296        // manage tooltip visibility and position
297        onHover: (args) => {
298            const [hoveredAnnotation] = args.hoveredEntities as AnnotationBase[];
299            if (hoveredAnnotation) {
300                if (hoveredAnnotation.isEditable) {
301                    sciChartSurface.domChartRoot.style.cursor = "grab";
302                }
303                if (hoveredAnnotation.isDraggingStarted) {
304                    tooltipAnnotation.isHidden = true;
305                    return;
306                }
307
308                const borders = tooltipAnnotation.getAnnotationBorders(true);
309                tooltipAnnotation.text = mapAnnotationTypeToName(hoveredAnnotation.type);
310
311                const handleAnnotationsOutsideSeriesViewRect = true;
312                const translatedMousePoint = translateFromCanvasToSeriesViewRect(
313                    args.mouseArgs.mousePoint,
314                    sciChartSurface.seriesViewRect,
315                    handleAnnotationsOutsideSeriesViewRect
316                );
317                tooltipAnnotation.x1 = translateToNotScaled(translatedMousePoint.x);
318                tooltipAnnotation.y1 = translateToNotScaled(translatedMousePoint.y);
319
320                // initial default offset from pointer
321                tooltipAnnotation.xCoordShift = 20;
322                const width = Math.abs(borders.x2 - borders.x1);
323                const expectedX2Coordinate = tooltipAnnotation.x1 + tooltipAnnotation.xCoordShift + width;
324                const unscaledViewWidth = translateToNotScaled(sciChartSurface.seriesViewRect.width);
325                if (expectedX2Coordinate > unscaledViewWidth) {
326                    tooltipAnnotation.xCoordShift = unscaledViewWidth - width - tooltipAnnotation.x1;
327                }
328
329                animateTooltip();
330            } else {
331                sciChartSurface.domChartRoot.style.cursor = "auto";
332                tooltipAnnotation.isHidden = true;
333                currentTooltipAnimation?.cancel();
334            }
335        },
336    });
337
338    sciChartSurface.chartModifiers.add(annotationHoverModifier);
339
340    return { sciChartSurface, wasmContext };
341};
342
343const mapAnnotationTypeToName = (type: EAnnotationType): string => {
344    switch (type) {
345        case EAnnotationType.RenderContextAxisMarkerAnnotation:
346            return "AxisMarkerAnnotation";
347        case EAnnotationType.RenderContextBoxAnnotation:
348            return "BoxAnnotation";
349        case EAnnotationType.RenderContextLineAnnotation:
350            return "LineAnnotation";
351        case EAnnotationType.RenderContextHorizontalLineAnnotation:
352            return "HorizontalLineAnnotation";
353        case EAnnotationType.RenderContextVerticalLineAnnotation:
354            return "VerticalLineAnnotation";
355        case EAnnotationType.SVGTextAnnotation:
356            return "TextAnnotation";
357        case EAnnotationType.RenderContextNativeTextAnnotation:
358            return "NativeTextAnnotation";
359        case EAnnotationType.SVGCustomAnnotation:
360            return "CustomAnnotation";
361        case EAnnotationType.SVG:
362            return "SvgAnnotation";
363        default: {
364            const handleInvalidType = (value: never): never => {
365                throw new Error(`Invalid annotation type: ${value}`);
366            };
367            return handleInvalidType(type);
368        }
369    }
370};
371
See Also: Chart Annotations (6 Demos)
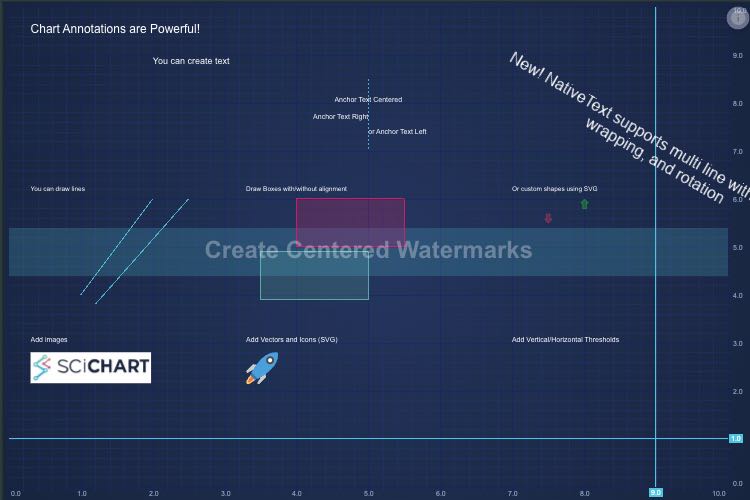
React Chart Annotations
Demonstrates how to place Annotations (lines, arrows, markers, text) over a React Chart using SciChart.js Annotations API
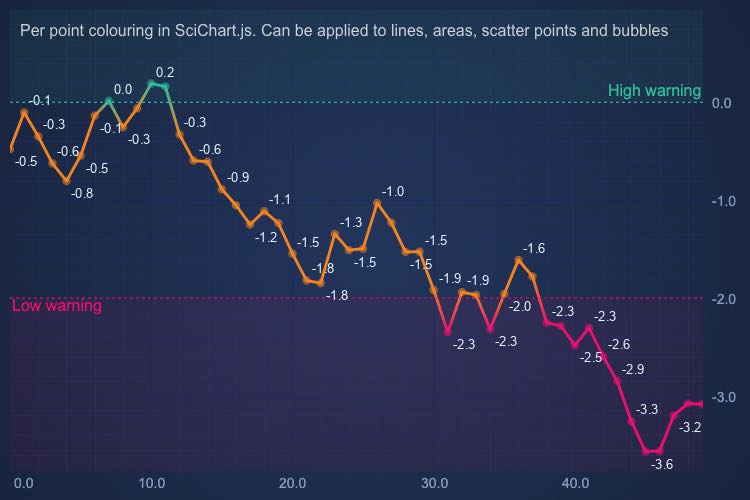
Coloring Series per-point using the PaletteProvider
Demonstrates per-point coloring in JavaScript chart types with SciChart.js PaletteProvider API
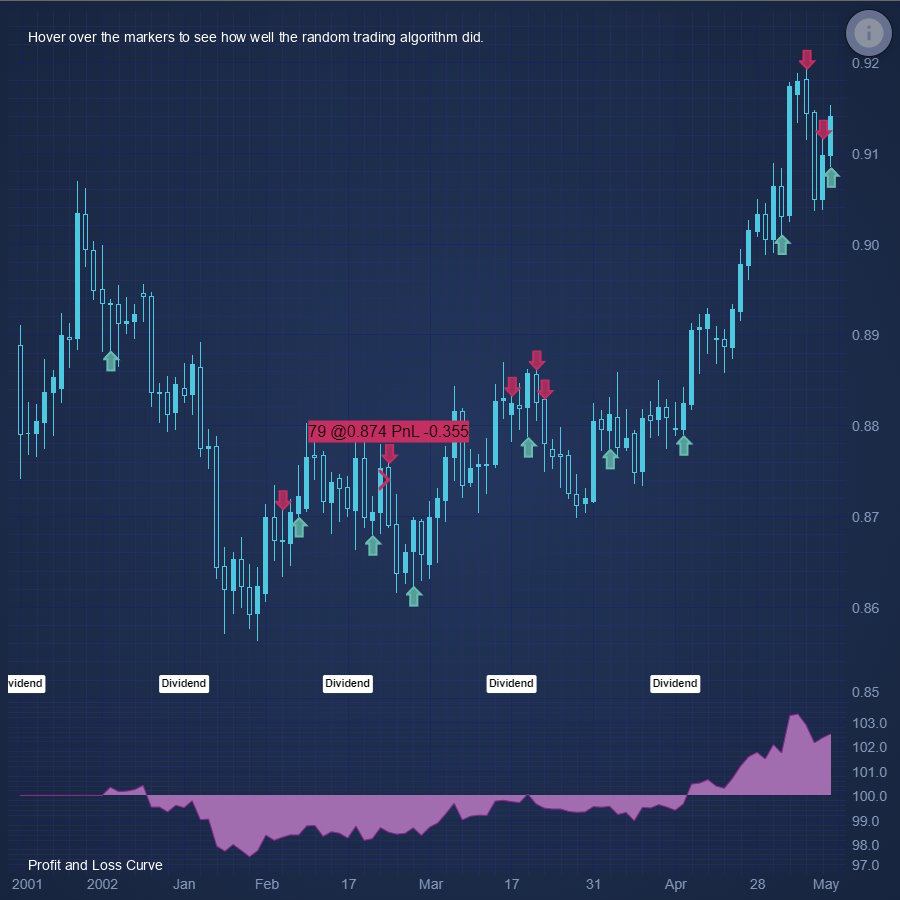
React Chart Hoverable Buy Sell Marker Annotations
Demonstrates how to place Buy/Sell arrow markers on a React Stock Chart using SciChart.js - Annotations API
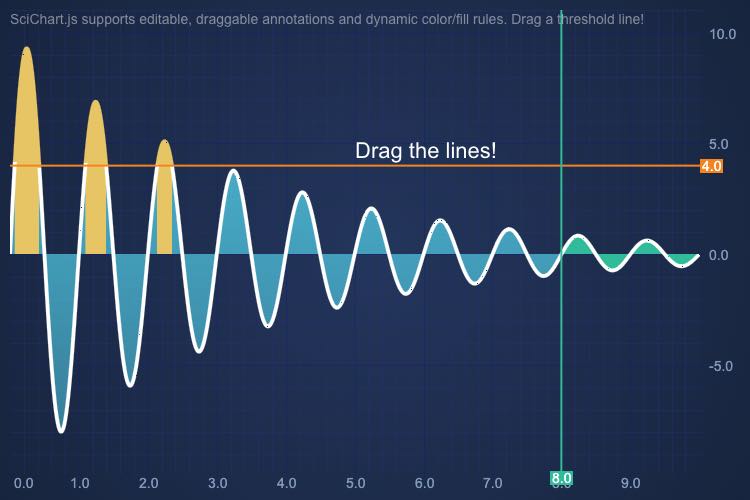
React Mountain Chart Draggable Thresholds
Demonstrates how to add draggable thresholds which change the series color in the chart in SciChart.js
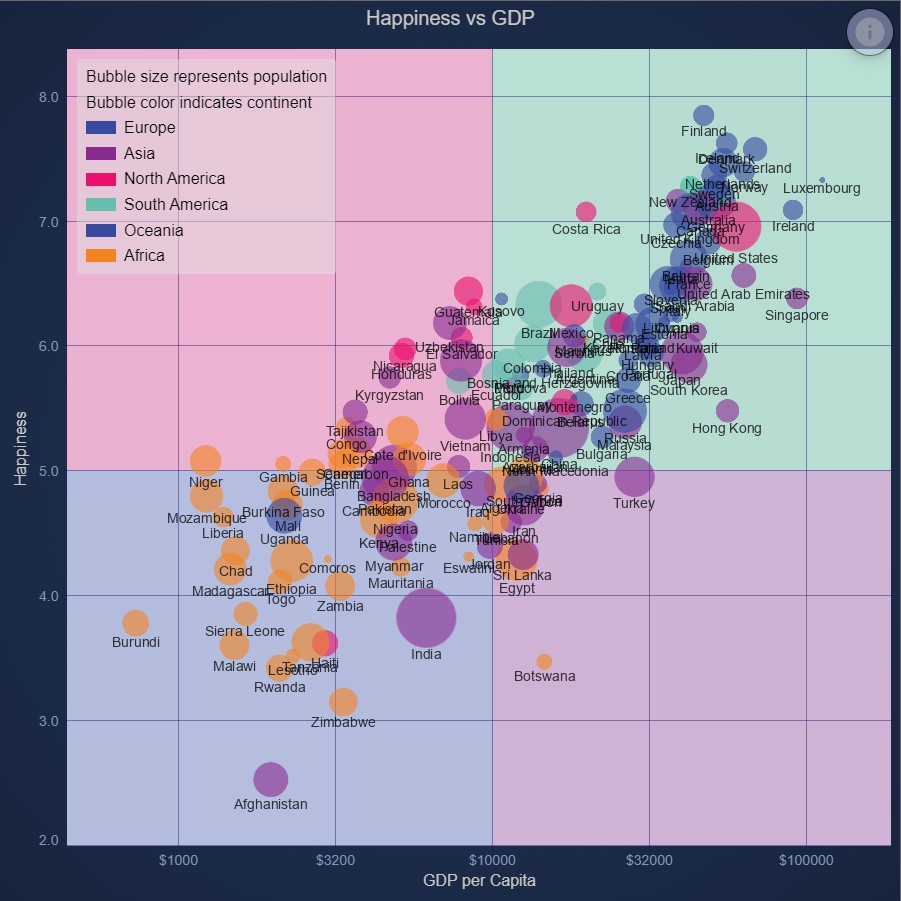
React Quadrant Chart using Background Annotations
Demonstrates how to color areas of the chart surface using background Annotations using SciChart.js Annotations API
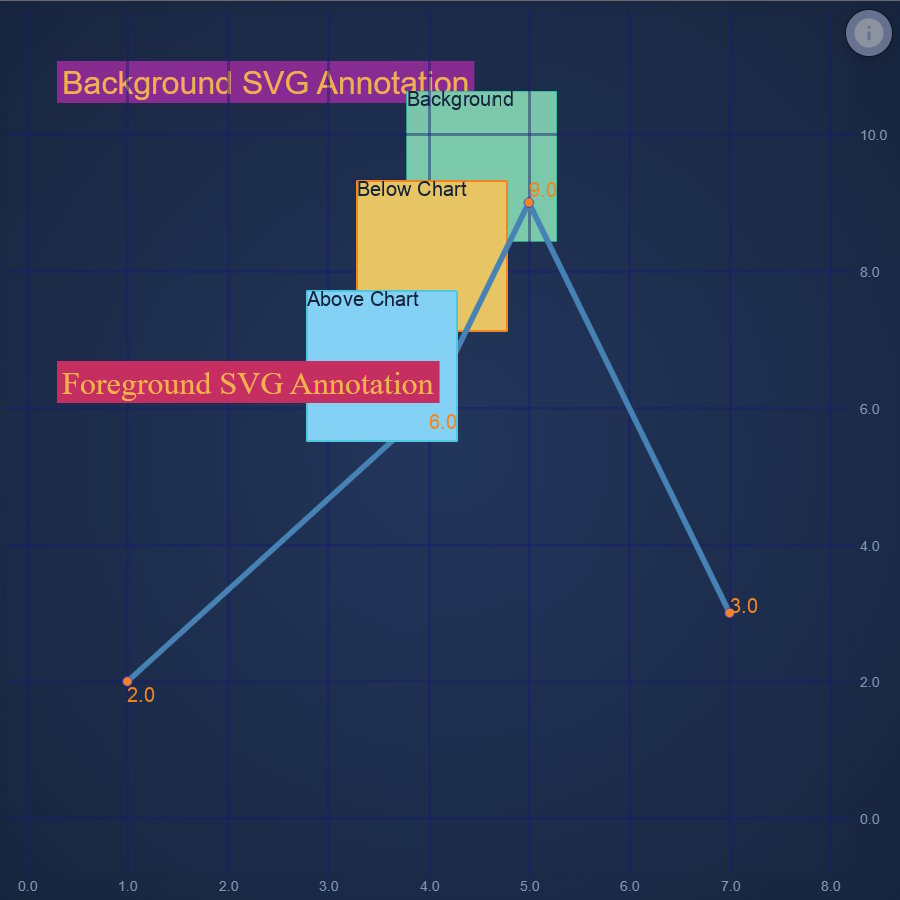
React Chart Annotation Layers
Demonstrates how layering works a React Chart using SciChart.js Annotations API