Dragabble Event Markers
Demonstrates how to repurpose a Candlestick Series into dragabble, labled, event markers, using SciChart.js High Performance JavaScript Charts
drawExample.ts
index.tsx
RandomWalkGenerator.ts
theme.ts
1import {
2    AUTO_COLOR,
3    BaseOhlcRenderableSeries,
4    CustomChartModifier2D,
5    DataLabelProvider,
6    DataPointSelectionPaletteProvider,
7    deleteSafe,
8    EAutoRange,
9    EAxisAlignment,
10    ECoordinateMode,
11    EHorizontalAnchorPoint,
12    EVerticalAnchorPoint,
13    EXyDirection,
14    FastCandlestickRenderableSeries,
15    FastLineRenderableSeries,
16    hitTestHelpers,
17    HitTestInfo,
18    IChartModifierBaseOptions,
19    IOhlcPointSeries,
20    LineAnnotation,
21    ModifierMouseArgs,
22    MouseWheelZoomModifier,
23    NumberRange,
24    NumericAxis,
25    OhlcDataSeries,
26    Point,
27    SciChartSurface,
28    SweepAnimation,
29    TextAnnotation,
30    translateFromCanvasToSeriesViewRect,
31    XyDataSeries,
32    ZoomExtentsModifier,
33    ZoomPanModifier,
34} from "scichart";
35import { RandomWalkGenerator } from "../../../ExampleData/RandomWalkGenerator";
36import { appTheme } from "../../../theme";
37
38const EventXStep = 6;
39
40// A custom modifier that allows selection and editing of candles.
41class CandleDragModifier extends CustomChartModifier2D {
42    private series: BaseOhlcRenderableSeries;
43    private dataSeries: OhlcDataSeries;
44    private annotation: LineAnnotation;
45    private selectedIndex: number = -1;
46
47    public constructor(series: BaseOhlcRenderableSeries, options?: IChartModifierBaseOptions) {
48        super(options);
49        this.series = series;
50        this.dataSeries = series.dataSeries as OhlcDataSeries;
51    }
52
53    public override onAttach(): void {
54        super.onAttach();
55        // Create an annotation where only the selection box will be visible
56        this.annotation = new LineAnnotation({
57            xAxisId: this.series.xAxisId,
58            yAxisId: this.series.yAxisId,
59            strokeThickness: 0,
60            stroke: "transparent",
61            selectionBoxStroke: "#88888888",
62            isEditable: true,
63            resizeDirections: EXyDirection.YDirection,
64        });
65        // Update the selected data point when the annotation is dragged
66        this.annotation.dragDelta.subscribe((data) => {
67            if (this.selectedIndex >= 0) {
68                const x = this.dataSeries.getNativeXValues().get(this.selectedIndex);
69                const newX = x + Math.floor((this.annotation.x1 - x + EventXStep / 2) / EventXStep) * EventXStep;
70                // Do not allow close to be less than open as this breaks our custom hitTest
71                this.dataSeries.updateXohlc(
72                    this.selectedIndex,
73                    newX,
74                    this.annotation.y1,
75                    Math.max(this.annotation.y1 + 5, this.annotation.y2),
76                    this.annotation.y1,
77                    Math.max(this.annotation.y1 + 5, this.annotation.y2),
78                    this.dataSeries.getMetadataAt(this.selectedIndex)
79                );
80            }
81        });
82        // Manually set the selected status of the point using metadata.  This will drive the DataPointSelectionPaletteProvider
83        this.annotation.selectedChanged.subscribe((data) => {
84            this.dataSeries.getMetadataAt(this.selectedIndex).isSelected = data;
85        });
86        this.parentSurface.modifierAnnotations.add(this.annotation);
87    }
88
89    public override onDetach(): void {
90        this.parentSurface.modifierAnnotations.remove(this.annotation);
91        this.annotation = deleteSafe(this.annotation);
92    }
93
94    public override modifierMouseUp(args: ModifierMouseArgs): void {
95        const point = args.mousePoint;
96        const hitTestInfo = this.series.hitTestProvider.hitTest(point.x, point.y, 0);
97        if (hitTestInfo.isHit) {
98            if (this.selectedIndex >= 0 && this.selectedIndex !== hitTestInfo.dataSeriesIndex) {
99                this.dataSeries.getMetadataAt(this.selectedIndex).isSelected = false;
100            }
101            // Place the annotation over the selected box
102            this.selectedIndex = hitTestInfo.dataSeriesIndex;
103            this.annotation.x1 = hitTestInfo.xValue;
104            this.annotation.x2 = hitTestInfo.xValue;
105            this.annotation.y1 = hitTestInfo.openValue;
106            this.annotation.y2 = hitTestInfo.closeValue;
107            // Make the annotation selected.  Both these lines are required.
108            this.annotation.isSelected = true;
109            this.dataSeries.getMetadataAt(this.selectedIndex).isSelected = true;
110            this.parentSurface.adornerLayer.selectedAnnotation = this.annotation;
111        }
112    }
113}
114
115export const drawExample = async (rootElement: string | HTMLDivElement) => {
116    // Create a SciChartSurface
117    const { wasmContext, sciChartSurface } = await SciChartSurface.create(rootElement, {
118        theme: appTheme.SciChartJsTheme,
119    });
120
121    const POINTS = 1000;
122
123    // Create an XAxis and YAxis
124    const xAxis = new NumericAxis(wasmContext, { visibleRange: new NumberRange(0, POINTS) });
125    sciChartSurface.xAxes.add(xAxis);
126    const yAxis = new NumericAxis(wasmContext, {
127        axisAlignment: EAxisAlignment.Left,
128        growBy: new NumberRange(0.05, 0.05),
129    });
130    sciChartSurface.yAxes.add(yAxis);
131
132    // Create arrays of x, y values (just arrays of numbers)
133    const { xValues, yValues } = new RandomWalkGenerator().getRandomWalkSeries(POINTS);
134
135    // Create a line Series and add to the chart
136    sciChartSurface.renderableSeries.add(
137        new FastLineRenderableSeries(wasmContext, {
138            dataSeries: new XyDataSeries(wasmContext, { xValues, yValues }),
139            stroke: AUTO_COLOR,
140            strokeThickness: 3,
141            animation: new SweepAnimation({ duration: 500, fadeEffect: true }),
142        })
143    );
144
145    // Hidden axes for event series
146    const eventXAxis = new NumericAxis(wasmContext, {
147        id: "EventX",
148        visibleRange: new NumberRange(0, 100),
149        autoRange: EAutoRange.Never,
150        axisAlignment: EAxisAlignment.Left,
151        isVisible: false,
152        zoomExtentsToInitialRange: true,
153        flippedCoordinates: true,
154    });
155    sciChartSurface.xAxes.add(eventXAxis);
156    const eventYAxis = new NumericAxis(wasmContext, {
157        id: "EventY",
158        axisAlignment: EAxisAlignment.Bottom,
159        isVisible: false,
160        flippedCoordinates: true,
161    });
162    // Sync the event y axis to the main x axis
163    xAxis.visibleRangeChanged.subscribe((data) => (eventYAxis.visibleRange = data.visibleRange));
164    sciChartSurface.yAxes.add(eventYAxis);
165
166    const eventDataSeries = new OhlcDataSeries(wasmContext);
167    // Create event data.  Prevent overlap of events
168    const rows = new Map<number, number>();
169    const EVENTCOUNT = 30;
170    let start = 0;
171    for (let i = 0; i < EVENTCOUNT; i++) {
172        start = start + Math.random() * ((2 * POINTS) / EVENTCOUNT);
173        const end = start + 1 + Math.random() * ((2 * POINTS) / EVENTCOUNT);
174        let row = 80;
175        if (i === 0) {
176            rows.set(row, end);
177        } else {
178            let last = rows.get(row);
179            while (last > start) {
180                row -= EventXStep;
181                last = rows.get(row) ?? 0;
182            }
183            rows.set(row, end);
184        }
185        eventDataSeries.append(row, start, end, start, end, { isSelected: false });
186    }
187
188    // FastCandlestickRenderableSeries does not have a DataLabelProvider by default
189    const dataLabelProvider = new DataLabelProvider({ style: { fontFamily: "Arial", fontSize: 14 }, color: "white" });
190    dataLabelProvider.getPosition = (state, textBounds) => {
191        const xVal = (state.renderPassData.pointSeries as IOhlcPointSeries).openValues.get(state.index);
192        const xCoord = state.renderPassData.yCoordinateCalculator.getCoordinate(xVal);
193        const yCoord = state.yCoord() + textBounds.m_fHeight / 2;
194        return new Point(xCoord, yCoord);
195    };
196    dataLabelProvider.getText = (state) => {
197        const open = (state.renderPassData.pointSeries as IOhlcPointSeries).openValues.get(state.index);
198        const close = (state.renderPassData.pointSeries as IOhlcPointSeries).closeValues.get(state.index);
199        return (close - open).toFixed(1);
200    };
201
202    // Create the event series
203    const eventSeries = new FastCandlestickRenderableSeries(wasmContext, {
204        dataSeries: eventDataSeries,
205        dataPointWidth: 30, // Normally this would be invalid but it is passed to the override below
206        xAxisId: "EventX",
207        yAxisId: "EventY",
208        dataLabelProvider,
209        paletteProvider: new DataPointSelectionPaletteProvider({ fill: "ff0000cc" }),
210    });
211    // use fixed pixel width
212    eventSeries.getDataPointWidth = (coordCalc, widthFraction) => widthFraction;
213    // custom hitTest that works with multiple candles on the same x value
214    eventSeries.hitTestProvider.hitTest = (x, y, hitTestRadius) => {
215        const hitTestPoint = translateFromCanvasToSeriesViewRect(new Point(x, y), sciChartSurface.seriesViewRect);
216        if (!hitTestPoint) {
217            return HitTestInfo.empty();
218        }
219        let nearestIndex = -1;
220        const halfWidth = eventSeries.dataPointWidth / 2; // Only works here because we are using fixed width
221        const xHitCoord = hitTestPoint.y; // Because vertical chart
222        const yHitCoord = hitTestPoint.x;
223        const xValues = eventDataSeries.getNativeXValues();
224        const openValues = eventDataSeries.getNativeOpenValues();
225        const closeValues = eventDataSeries.getNativeCloseValues();
226        const xCoordinateCalculator = eventXAxis.getCurrentCoordinateCalculator();
227        const yCoordinateCalculator = eventYAxis.getCurrentCoordinateCalculator();
228        for (let i = 0; i < eventDataSeries.count(); i++) {
229            const xCoord = xCoordinateCalculator.getCoordinate(xValues.get(i));
230            const dx = Math.abs(xCoord - xHitCoord);
231            // Half data point width
232            if (dx <= halfWidth) {
233                const openCoord = yCoordinateCalculator.getCoordinate(openValues.get(i));
234                const closeCoord = yCoordinateCalculator.getCoordinate(closeValues.get(i));
235                if (openCoord <= yHitCoord && yHitCoord <= closeCoord) {
236                    nearestIndex = i;
237                }
238            }
239        }
240        if (nearestIndex > -1) {
241            const hitTestInfo = hitTestHelpers.createHitTestInfo(
242                eventSeries,
243                xCoordinateCalculator,
244                yCoordinateCalculator,
245                true,
246                eventDataSeries,
247                xValues,
248                closeValues,
249                xHitCoord,
250                yHitCoord,
251                nearestIndex,
252                hitTestRadius
253            );
254            hitTestInfo.isHit = true;
255            hitTestInfo.openValue = openValues.get(nearestIndex);
256            hitTestInfo.highValue = eventDataSeries.getNativeHighValues().get(nearestIndex);
257            hitTestInfo.lowValue = eventDataSeries.getNativeLowValues().get(nearestIndex);
258            hitTestInfo.closeValue = closeValues.get(nearestIndex);
259            return hitTestInfo;
260        } else {
261            return HitTestInfo.empty();
262        }
263    };
264
265    sciChartSurface.renderableSeries.add(eventSeries);
266
267    // Add modifiers
268    sciChartSurface.chartModifiers.add(
269        // Use manual zoomExtents behaviour to prevent it zooming the event axes
270        new ZoomExtentsModifier({
271            onZoomExtents: (sciChartSurface: SciChartSurface) => {
272                xAxis.visibleRange = xAxis.getMaximumRange();
273                yAxis.visibleRange = yAxis.getMaximumRange();
274                // false here prevents default behaviour
275                return false;
276            },
277        }),
278        new MouseWheelZoomModifier({ excludedYAxisIds: ["EventY"], excludedXAxisIds: ["EventX"] }),
279        new ZoomPanModifier({ excludedXAxisIds: ["EventX"] }),
280        new CandleDragModifier(eventSeries)
281    );
282
283    // Add instructions
284    sciChartSurface.annotations.add(
285        new TextAnnotation({
286            x1: 0.01,
287            y1: 0.03,
288            xCoordinateMode: ECoordinateMode.Relative,
289            yCoordinateMode: ECoordinateMode.Relative,
290            horizontalAnchorPoint: EHorizontalAnchorPoint.Left,
291            verticalAnchorPoint: EVerticalAnchorPoint.Top,
292            text: "The boxes are rendered with a fast candlestick series, but can be selected and dragged like an annotation.",
293            textColor: appTheme.ForegroundColor + "77",
294        })
295    );
296
297    xAxis.visibleRange = xAxis.getMaximumRange();
298
299    return { wasmContext, sciChartSurface };
300};
301
See Also: Performance Demos & Showcases (11 Demos)
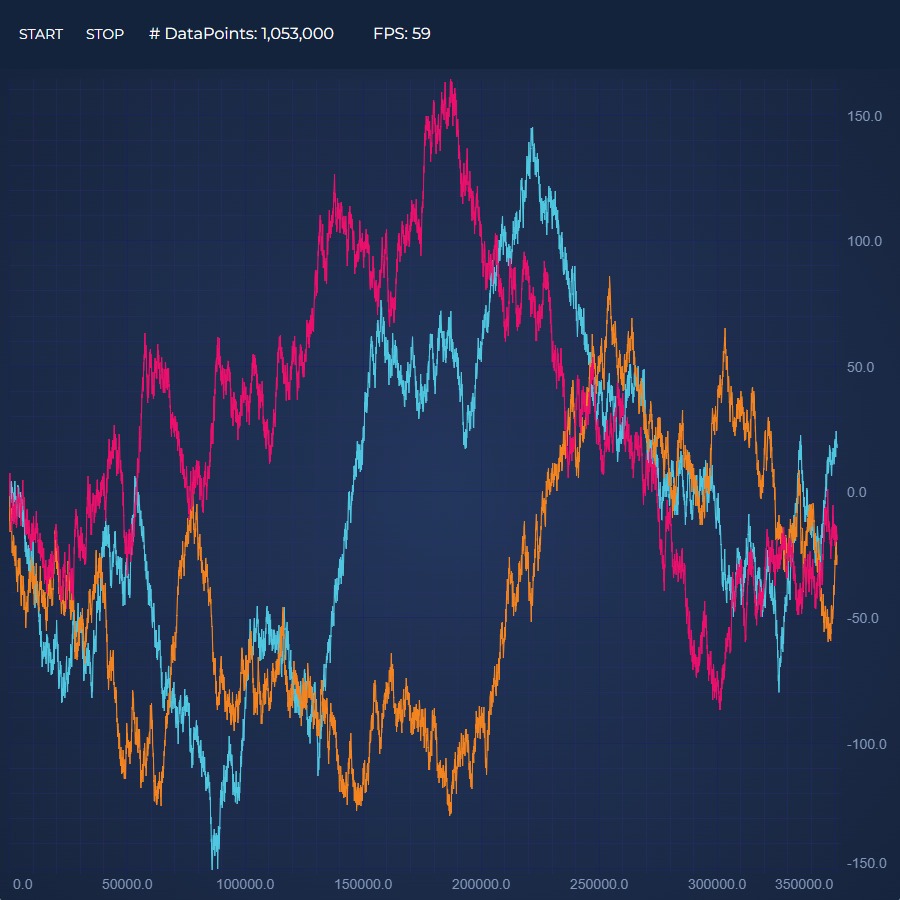
Realtime React Chart Performance Demo
This demo showcases the incredible realtime performance of our React charts by updating the series with millions of data-points!
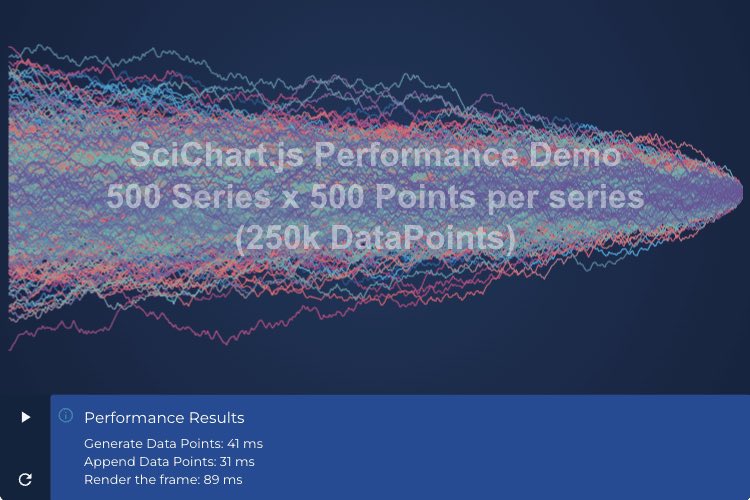
Load 500 Series x 500 Points Performance Demo
This demo showcases the incredible performance of our React Chart by loading 500 series with 500 points (250k points) instantly!
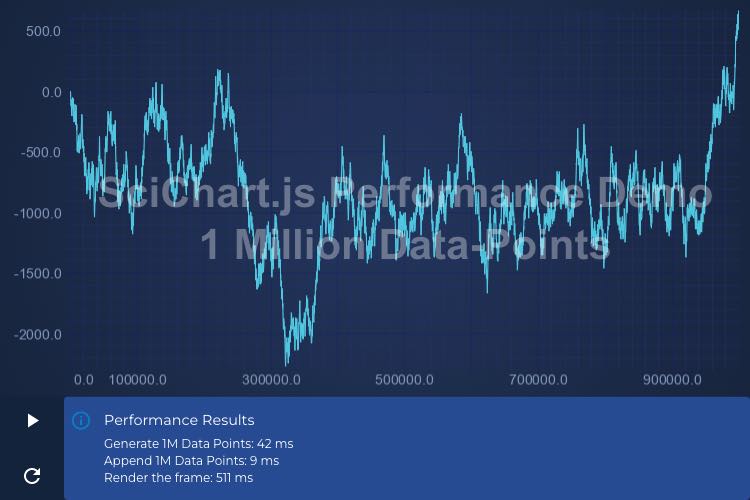
Load 1 Million Points Performance Demo
This demo showcases the incredible performance of our JavaScript Chart by loading a million points instantly.
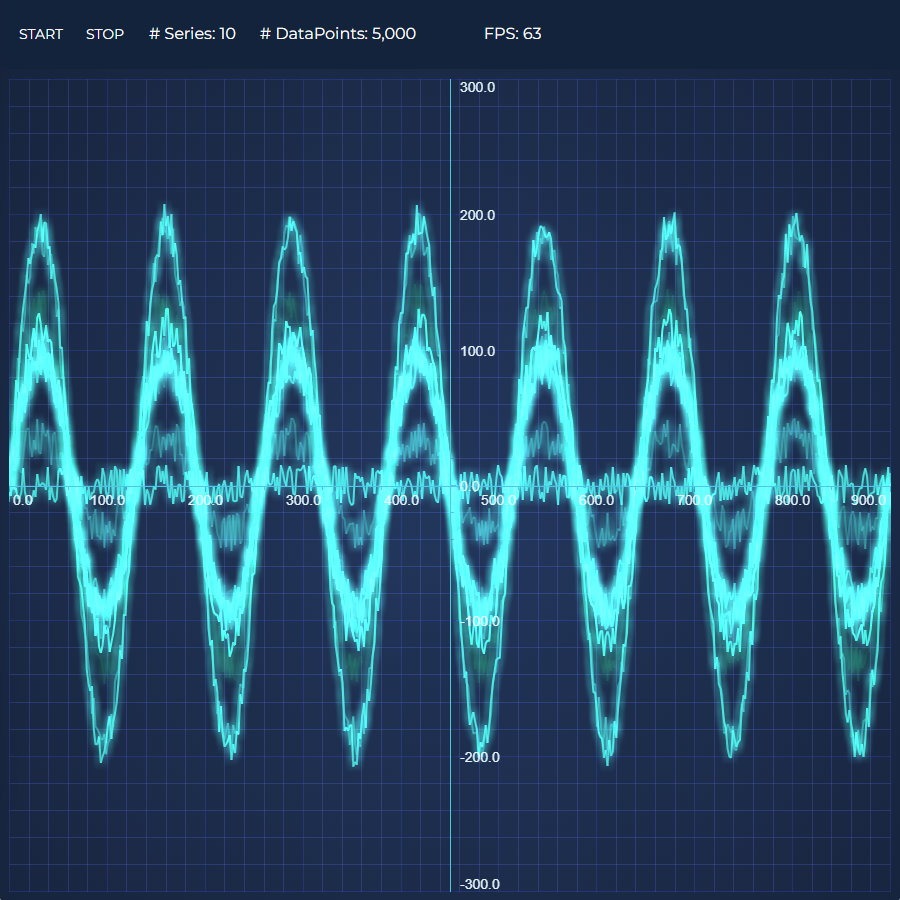
Realtime Ghosted Traces
This demo showcases the realtime performance of our React Chart by animating several series with thousands of data-points at 60 FPS

Realtime Audio Analyzer Demo
Demonstrating the capability of SciChart.js to create a JavaScript Audio Analyzer and visualize the Fourier-Transform of an audio waveform in realtime.
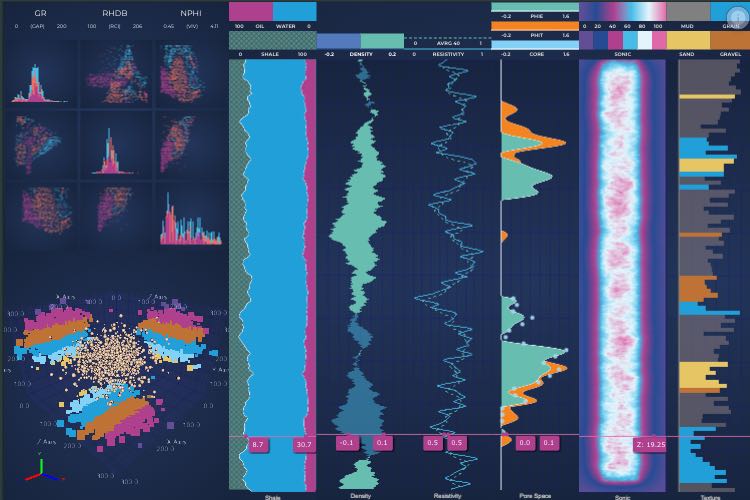
Oil & Gas Explorer React Dashboard
Demonstrates how to create Oil and Gas Dashboard
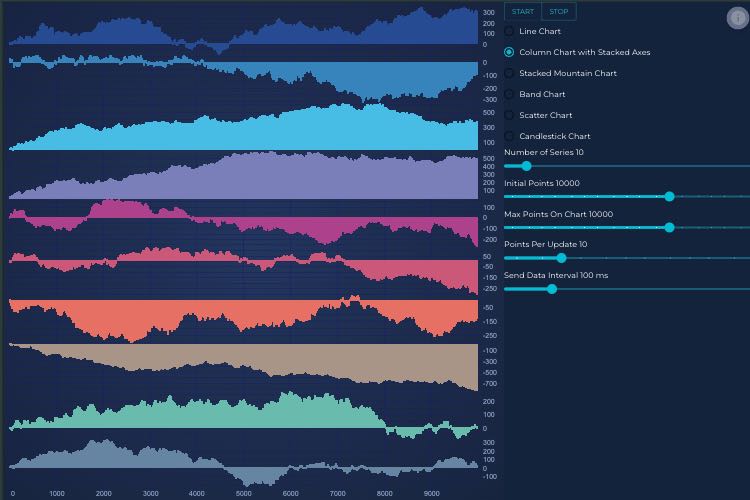
Client/Server Websocket Data Streaming
This demo showcases the incredible realtime performance of our JavaScript charts by updating the series with millions of data-points!
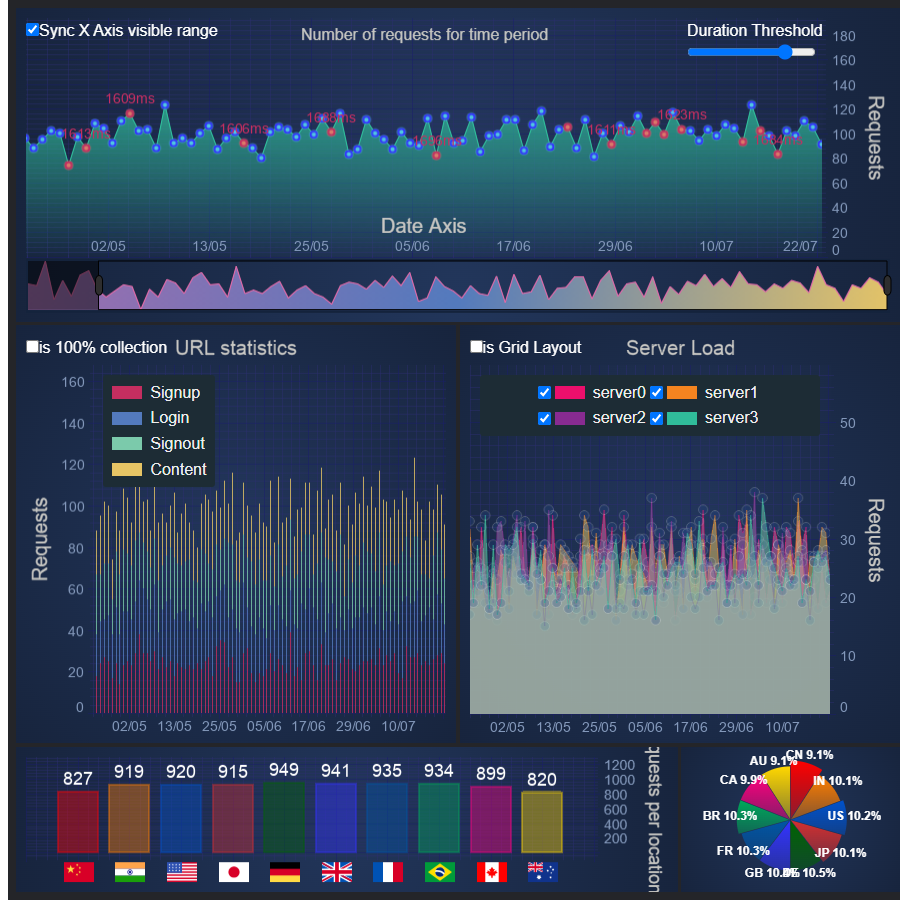
Server Traffic Dashboard
This dashboard demo showcases the incredible realtime performance of our React charts by updating the series with millions of data-points!
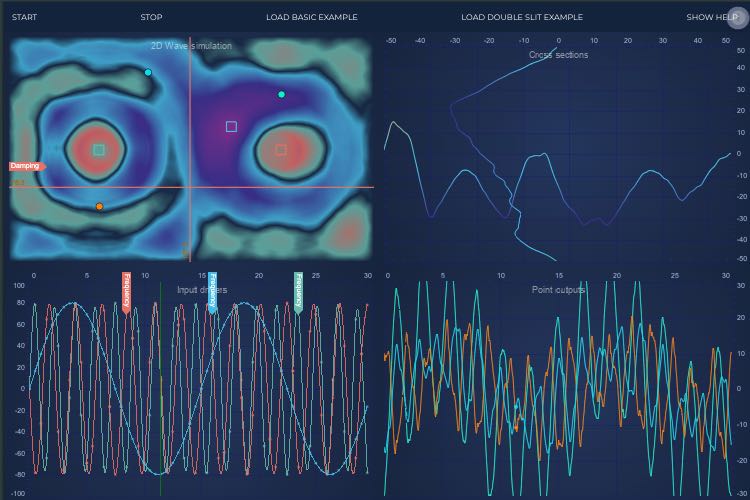
Rich Interactions Showcase
This demo showcases the incredible realtime performance of our React charts by updating the series with millions of data-points!
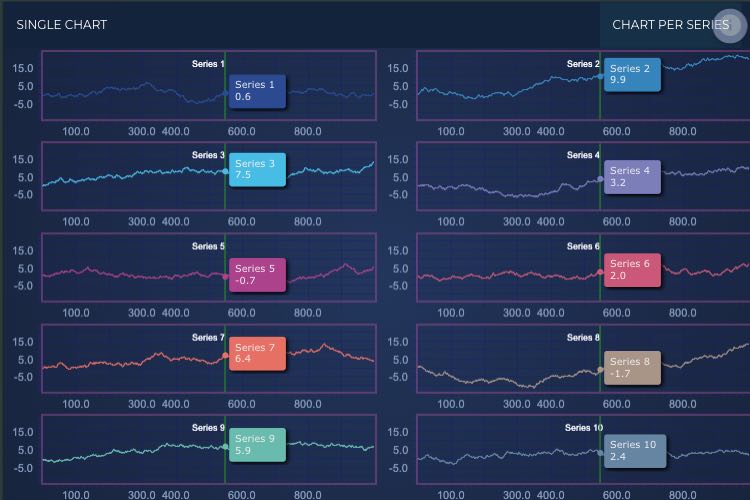
Dynamic Layout Showcase
Demonstrates a custom modifier which can convert from single chart to grid layout and back.
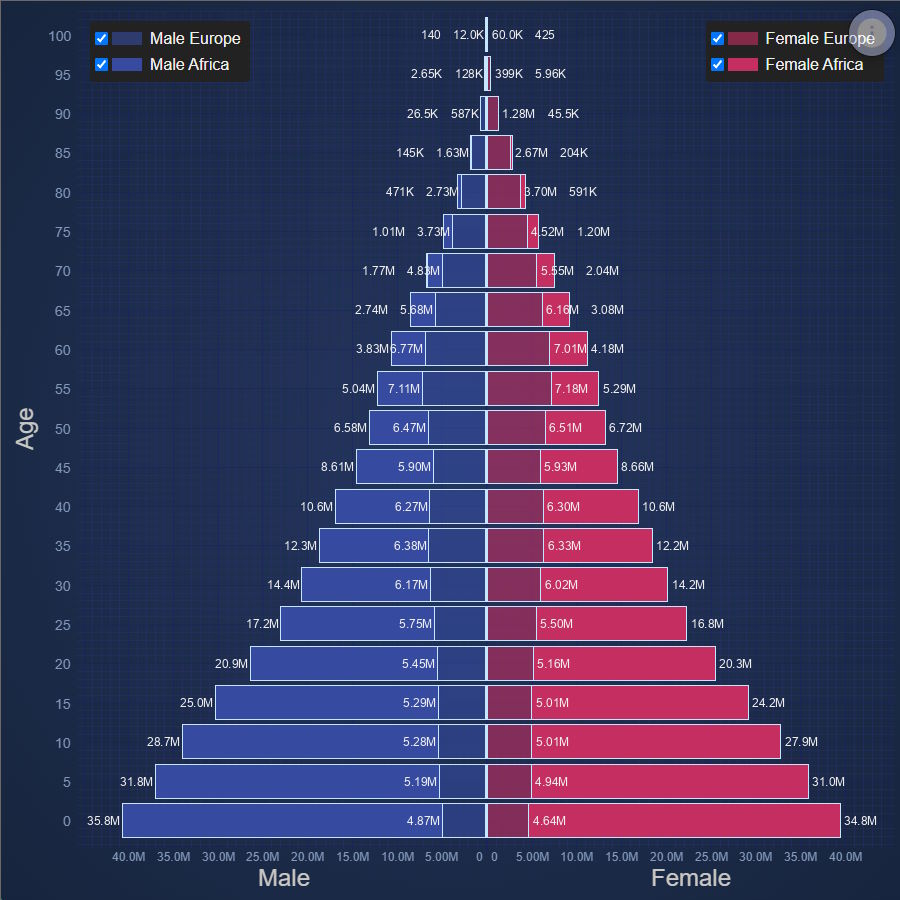
React Population Pyramid
Population Pyramid of Europe and Africa