React Chart with Multiple X Axes
Demonstrates how to create a React Chart with multiple X,Y axis using SciChart.js, High Performance JavaScript Charts
drawExample.ts
index.tsx
RandomWalkGenerator.ts
theme.ts
1import {
2    EAxisAlignment,
3    ECoordinateMode,
4    EHorizontalAnchorPoint,
5    ELabelAlignment,
6    EllipsePointMarker,
7    EMultiLineAlignment,
8    ENumericFormat,
9    EVerticalAnchorPoint,
10    EWrapTo,
11    FastLineRenderableSeries,
12    MouseWheelZoomModifier,
13    NativeTextAnnotation,
14    NumberRange,
15    NumericAxis,
16    SciChartSurface,
17    TextAnnotation,
18    XAxisDragModifier,
19    XyDataSeries,
20    YAxisDragModifier,
21    ZoomExtentsModifier,
22    ZoomPanModifier,
23} from "scichart";
24import { appTheme } from "../../../theme";
25import { RandomWalkGenerator } from "../../../ExampleData/RandomWalkGenerator";
26
27const titleStyle1 = {
28    color: appTheme.VividSkyBlue,
29    fontSize: 30,
30};
31const labelStyle1 = {
32    color: appTheme.VividSkyBlue,
33};
34const titleStyle2 = {
35    color: appTheme.VividOrange,
36    fontSize: 30,
37};
38const labelStyle2 = {
39    color: appTheme.VividOrange,
40    alignment: ELabelAlignment.Right,
41};
42
43const ID_X_AXIS_2 = "xAxis2";
44const ID_Y_AXIS_2 = "yAxis2";
45
46export const drawExample = async (rootElement: string | HTMLDivElement) => {
47    // Create the SciChartSurface with theme
48    const { sciChartSurface, wasmContext } = await SciChartSurface.create(rootElement, {
49        theme: appTheme.SciChartJsTheme,
50    });
51
52    // Add a primary X,Y Axis pair
53    sciChartSurface.xAxes.add(
54        new NumericAxis(wasmContext, {
55            axisAlignment: EAxisAlignment.Bottom,
56            axisTitle: "X Axis Bottom",
57            axisTitleStyle: titleStyle1,
58            labelStyle: labelStyle1,
59            backgroundColor: appTheme.VividSkyBlue + "22",
60            axisBorder: {
61                borderTop: 1,
62                color: appTheme.VividSkyBlue,
63            },
64        })
65    );
66
67    sciChartSurface.yAxes.add(
68        new NumericAxis(wasmContext, {
69            axisAlignment: EAxisAlignment.Left,
70            axisTitle: "Y Axis Left",
71            axisTitleStyle: titleStyle1,
72            labelStyle: labelStyle1,
73            growBy: new NumberRange(0.1, 0.1),
74            backgroundColor: appTheme.VividSkyBlue + "22",
75            axisBorder: {
76                borderRight: 1,
77                color: appTheme.VividSkyBlue,
78            },
79        })
80    );
81
82    // Add a secondary X,Y Axis pair
83    // Series are tied to the axis via the ID_
84    sciChartSurface.xAxes.add(
85        new NumericAxis(wasmContext, {
86            id: ID_X_AXIS_2,
87            axisTitleStyle: titleStyle2,
88            labelStyle: labelStyle2,
89            axisAlignment: EAxisAlignment.Top,
90            axisTitle: "X Axis Top",
91            backgroundColor: appTheme.VividOrange + "22",
92            axisBorder: {
93                borderBottom: 1,
94                color: appTheme.VividOrange,
95            },
96        })
97    );
98
99    sciChartSurface.yAxes.add(
100        new NumericAxis(wasmContext, {
101            id: ID_Y_AXIS_2,
102            axisTitleStyle: titleStyle2,
103            labelStyle: labelStyle2,
104            axisAlignment: EAxisAlignment.Right,
105            axisTitle: "Y Axis Right",
106            labelFormat: ENumericFormat.Decimal,
107            labelPrecision: 2,
108            growBy: new NumberRange(0.1, 0.1),
109            backgroundColor: appTheme.VividOrange + "22",
110            axisBorder: {
111                borderLeft: 1,
112                color: appTheme.VividOrange,
113            },
114        })
115    );
116
117    // generate some data
118    let data = new RandomWalkGenerator().Seed(1337).getRandomWalkSeries(100);
119
120    // Add the first line series on the primary X,Y axis
121    // This occurs be default as FastLineRenderableSeries XAxisId and YAxisId are set to a default value
122    sciChartSurface.renderableSeries.add(
123        new FastLineRenderableSeries(wasmContext, {
124            stroke: appTheme.VividSkyBlue,
125            strokeThickness: 3,
126            dataSeries: new XyDataSeries(wasmContext, { xValues: data.xValues, yValues: data.yValues }),
127            pointMarker: new EllipsePointMarker(wasmContext, {
128                width: 5,
129                height: 5,
130                fill: appTheme.VividSkyBlue,
131                stroke: appTheme.VividSkyBlue,
132            }),
133        })
134    );
135
136    data = new RandomWalkGenerator().Seed(90210).getRandomWalkSeries(100);
137
138    // The second line series we specify X/Y axis ids to bind this to the correct axis
139    sciChartSurface.renderableSeries.add(
140        new FastLineRenderableSeries(wasmContext, {
141            stroke: appTheme.VividOrange,
142            strokeThickness: 3,
143            dataSeries: new XyDataSeries(wasmContext, { xValues: data.xValues, yValues: data.yValues }),
144            xAxisId: ID_X_AXIS_2,
145            yAxisId: ID_Y_AXIS_2,
146            pointMarker: new EllipsePointMarker(wasmContext, {
147                width: 5,
148                height: 5,
149                fill: appTheme.VividOrange,
150                stroke: appTheme.VividOrange,
151            }),
152        })
153    );
154
155    // Optional: Add some interactivity modifiers to enable zooming and panning
156    sciChartSurface.chartModifiers.add(
157        new YAxisDragModifier(),
158        new XAxisDragModifier(),
159        new ZoomPanModifier({ enableZoom: true }),
160        new MouseWheelZoomModifier(),
161        new ZoomExtentsModifier()
162    );
163
164    // Add a title over the chart with information
165    sciChartSurface.annotations.add(
166        new NativeTextAnnotation({
167            x1: 0.01,
168            y1: 0.01,
169            xCoordinateMode: ECoordinateMode.Relative,
170            yCoordinateMode: ECoordinateMode.Relative,
171            horizontalAnchorPoint: EHorizontalAnchorPoint.Left,
172            verticalAnchorPoint: EVerticalAnchorPoint.Top,
173            fontSize: 18,
174            opacity: 0.55,
175            textColor: appTheme.ForegroundColor,
176            text: "SciChart.js supports unlimited X,Y axis.  Drag an axis to see the series scale",
177            wrapTo: EWrapTo.ViewRect,
178            multiLineAlignment: EMultiLineAlignment.Left,
179        })
180    );
181
182    sciChartSurface.annotations.add(
183        new TextAnnotation({
184            x1: 30,
185            y1: -3.5,
186            fontSize: 18,
187            textColor: appTheme.VividSkyBlue,
188            text: "Blue series is bound to the Left, Bottom axis",
189        })
190    );
191
192    // Note annotations need X,Y Axis Id as well in multi-axis scenarios
193    sciChartSurface.annotations.add(
194        new TextAnnotation({
195            x1: 68,
196            y1: 3.7,
197            fontSize: 18,
198            textColor: appTheme.VividOrange,
199            horizontalAnchorPoint: EHorizontalAnchorPoint.Right,
200            yAxisId: ID_Y_AXIS_2,
201            xAxisId: ID_X_AXIS_2,
202            text: "Orange series is bound to the Top, Right axis",
203        })
204    );
205
206    return { sciChartSurface, wasmContext };
207};
208
See Also: Chart Axis APIs (9 Demos)
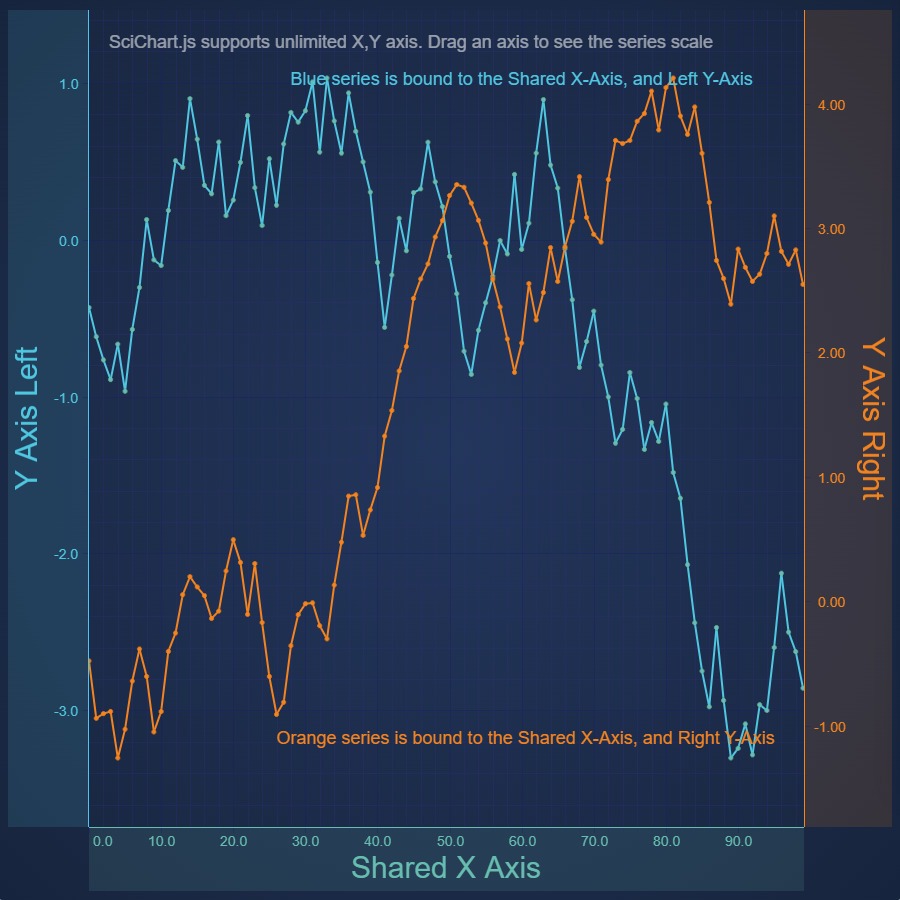
React Chart with Secondary Y Axes
Demonstrates Secondary Y Axis on a React Chart using SciChart.js. SciChart supports unlimited, multiple left, right, top, bottom X, Y axis with configurable alignment and individual zooming, panning
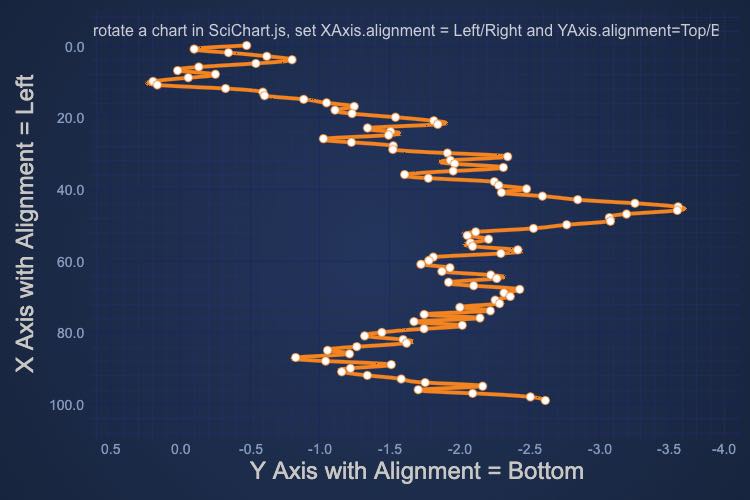
React Vertical Charts
Demonstrates alignment of Axis to create a vertical chart with SciChart.js - JavaScript Charts.

React Chart with Central Axes
Demonstrates Central Axes on a React Chart using SciChart.js. SciChart supports unlimited left, right, top, bottom X, Y axis with configurable layout
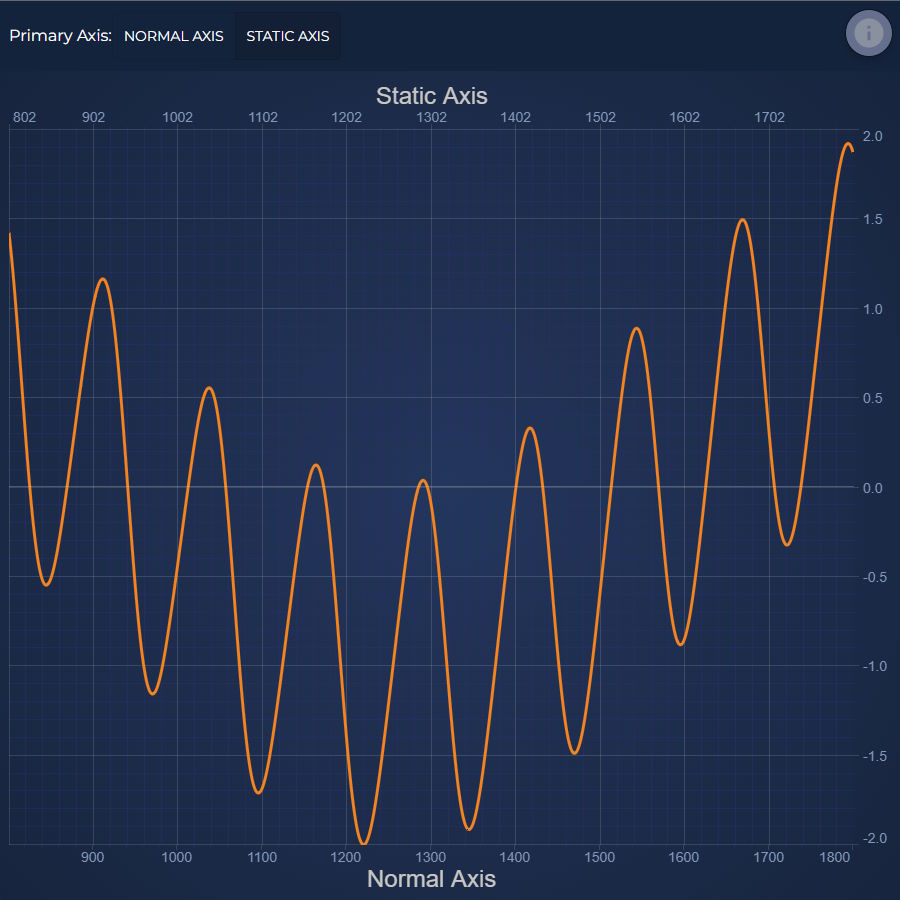
React Chart with Static X Axis
Demonstrates isStaticAxis on a React Chart using SciChart.js.
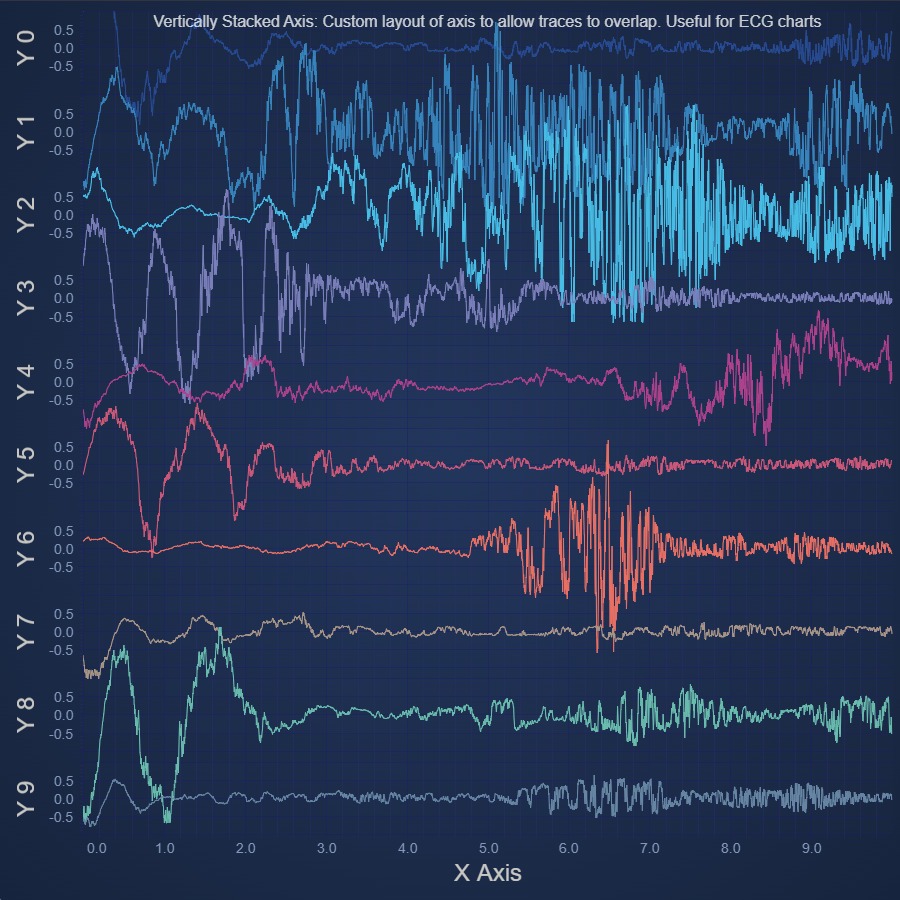
React Chart with Vertically Stacked Axes
Demonstrates Vertically Stacked Axes on a React Chart using SciChart.js, allowing data to overlap
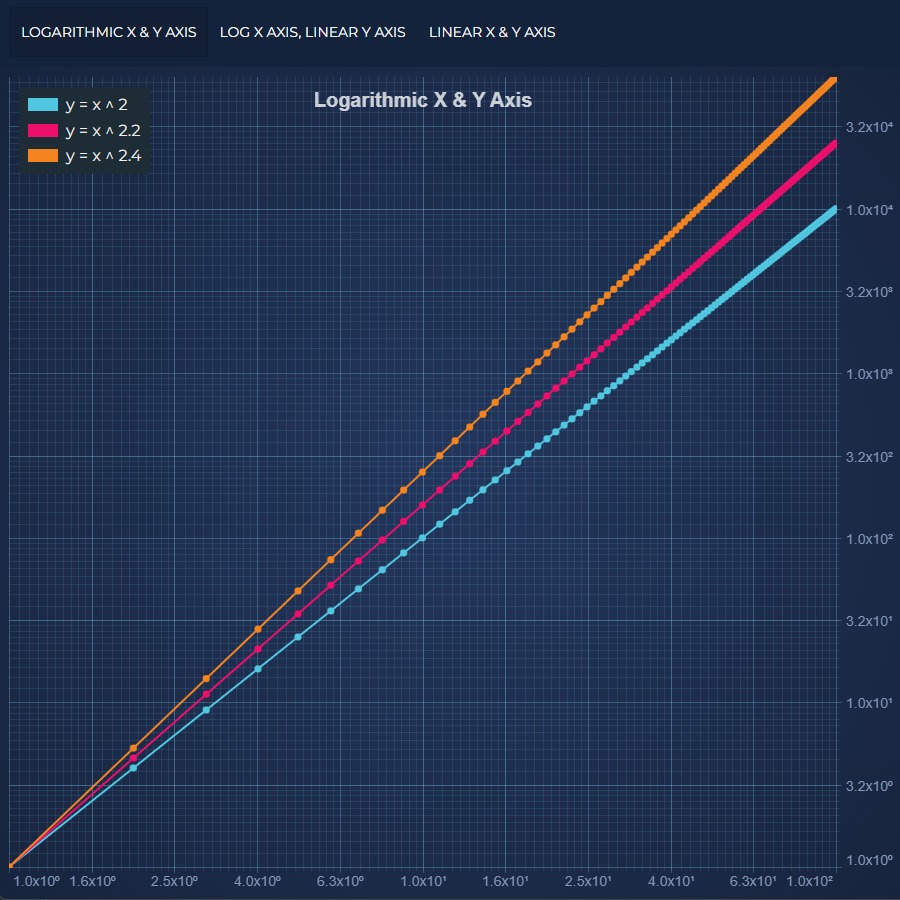
React Chart with Logarithmic Axis Example
Demonstrates Logarithmic Axis on a React Chart using SciChart.js. SciChart supports logarithmic axis with scientific or engineering notation and positive and negative values
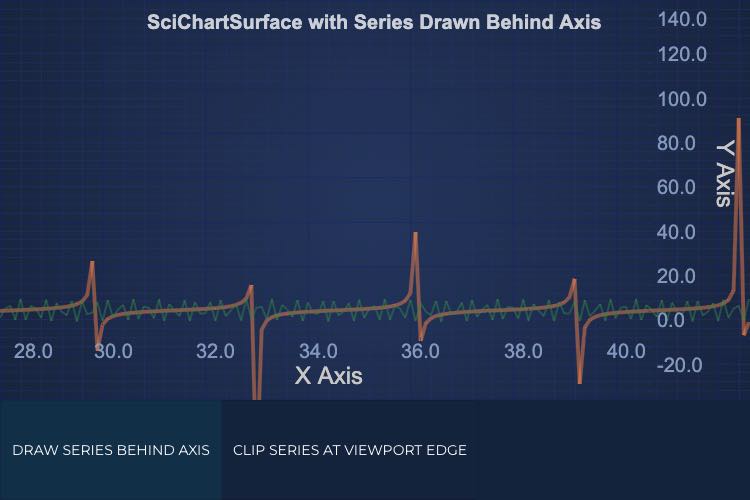
Draw React Chart Behind Axis
Demonstrates the option of the transparent Axes customization on a React Chart using SciChart.js.
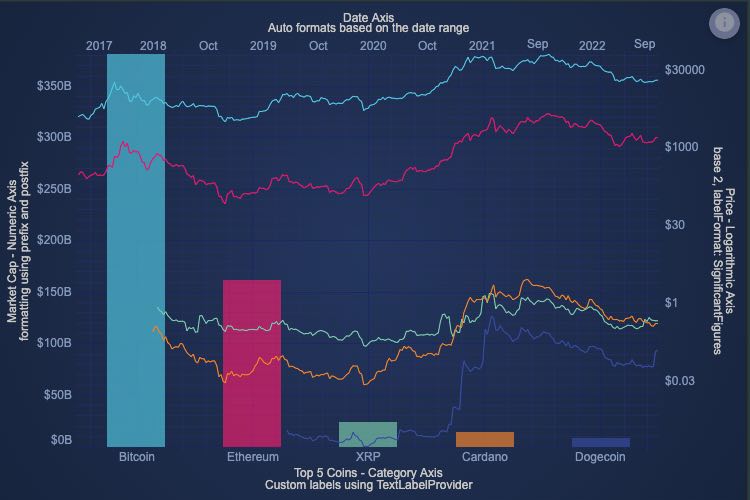
Axis Types
Demonstrates how to use arbitrary text for axis labels, rather than formatted data values, using the new TextLabelProvider
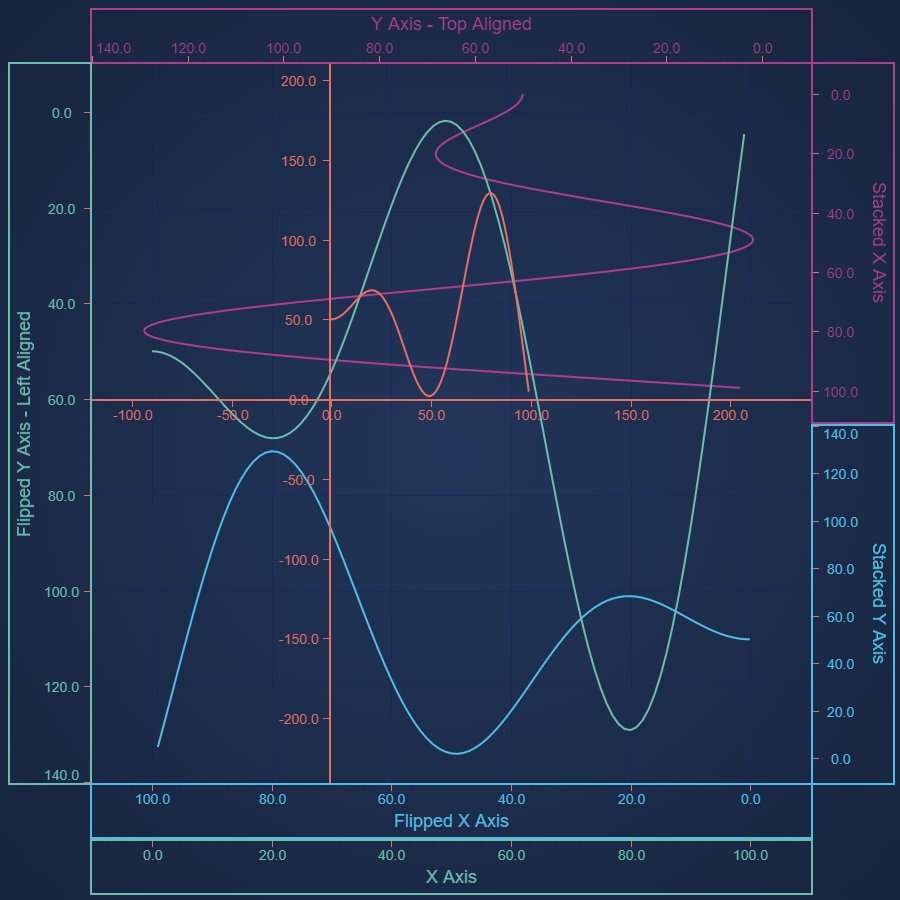
React Chart Axis Layout Options
Demonstrates outer, inner, central and stacked axes, and use of axis alignment to create vertical charts