React Surface Mesh 3D Chart
Learn how to create a detailed React 3D Surface Mesh Chart using SciChart.js, and our High Performance JavaScript 3D Chart Library
drawExample.ts
index.tsx
ChartGroupLoader.tsx
theme.ts
1import {
2    CameraController,
3    EDrawMeshAs,
4    GradientColorPalette,
5    HeatmapLegend,
6    MouseWheelZoomModifier3D,
7    NumberRange,
8    NumericAxis3D,
9    OrbitModifier3D,
10    ResetCamera3DModifier,
11    SciChart3DSurface,
12    SurfaceMeshRenderableSeries3D,
13    TooltipModifier3D,
14    UniformGridDataSeries3D,
15    Vector3,
16    zeroArray2D,
17} from "scichart";
18import { appTheme } from "../../../theme";
19
20// SCICHART CODE
21
22export const drawExample = async (rootElement: string | HTMLDivElement) => {
23    // Create a SciChart3DSurface
24    const { sciChart3DSurface, wasmContext } = await SciChart3DSurface.create(rootElement, {
25        theme: appTheme.SciChartJsTheme,
26    });
27
28    // Create and position the camera in the 3D world
29    sciChart3DSurface.camera = new CameraController(wasmContext, {
30        position: new Vector3(-200, 150, 200),
31        target: new Vector3(0, 50, 0),
32    });
33    // Set the worlddimensions, which defines the Axis cube size
34    sciChart3DSurface.worldDimensions = new Vector3(200, 100, 200);
35
36    // Add an X,Y and Z Axis
37    sciChart3DSurface.xAxis = new NumericAxis3D(wasmContext, { axisTitle: "X Axis" });
38    sciChart3DSurface.yAxis = new NumericAxis3D(wasmContext, {
39        axisTitle: "Y Axis",
40        visibleRange: new NumberRange(0, 0.3),
41    });
42    sciChart3DSurface.zAxis = new NumericAxis3D(wasmContext, { axisTitle: "Z Axis" });
43
44    // Create a 2D array using the helper function zeroArray2D
45    // and fill this with data
46    const zSize = 25;
47    const xSize = 25;
48    const heightmapArray = zeroArray2D([zSize, xSize]);
49    for (let z = 0; z < zSize; z++) {
50        for (let x = 0; x < xSize; x++) {
51            const xVal = (x / xSize) * 25.0;
52            const zVal = (z / zSize) * 25.0;
53            const y = Math.sin(xVal * 0.2) / ((zVal + 1) * 2);
54            heightmapArray[z][x] = y;
55        }
56    }
57
58    // Create a UniformGridDataSeries3D
59    const dataSeries = new UniformGridDataSeries3D(wasmContext, {
60        yValues: heightmapArray,
61        xStep: 1,
62        zStep: 1,
63        dataSeriesName: "Uniform Surface Mesh",
64    });
65
66    // Create the color map
67    const colorMap = new GradientColorPalette(wasmContext, {
68        gradientStops: [
69            { offset: 1, color: appTheme.VividPink },
70            { offset: 0.9, color: appTheme.VividOrange },
71            { offset: 0.7, color: appTheme.MutedRed },
72            { offset: 0.5, color: appTheme.VividGreen },
73            { offset: 0.3, color: appTheme.VividSkyBlue },
74            { offset: 0.15, color: appTheme.Indigo },
75            { offset: 0, color: appTheme.DarkIndigo },
76        ],
77    });
78
79    // Finally, create a SurfaceMeshRenderableSeries3D and add to the chart
80    const series = new SurfaceMeshRenderableSeries3D(wasmContext, {
81        dataSeries,
82        minimum: 0,
83        maximum: 0.5,
84        opacity: 0.9,
85        cellHardnessFactor: 1.0,
86        shininess: 0,
87        lightingFactor: 0.0,
88        highlight: 1.0,
89        stroke: appTheme.VividBlue,
90        strokeThickness: 2.0,
91        contourStroke: appTheme.VividBlue,
92        contourInterval: 2,
93        contourOffset: 0,
94        contourStrokeThickness: 2,
95        drawSkirt: false,
96        drawMeshAs: EDrawMeshAs.SOLID_WIREFRAME,
97        meshColorPalette: colorMap,
98        isVisible: true,
99    });
100
101    sciChart3DSurface.renderableSeries.add(series);
102
103    // Optional: Add some interactivity modifiers
104    sciChart3DSurface.chartModifiers.add(new MouseWheelZoomModifier3D());
105    sciChart3DSurface.chartModifiers.add(new OrbitModifier3D());
106    sciChart3DSurface.chartModifiers.add(new ResetCamera3DModifier());
107    sciChart3DSurface.chartModifiers.add(new TooltipModifier3D({ tooltipContainerBackground: appTheme.PaleBlue }));
108
109    return { sciChartSurface: sciChart3DSurface, wasmContext };
110};
111
112export const drawHeatmapLegend = async (rootElement: string | HTMLDivElement) => {
113    const { heatmapLegend, wasmContext } = await HeatmapLegend.create(rootElement, {
114        theme: {
115            ...appTheme.SciChartJsTheme,
116            sciChartBackground: appTheme.DarkIndigo + "BB",
117            loadingAnimationBackground: appTheme.DarkIndigo + "BB",
118        },
119        yAxisOptions: {
120            isInnerAxis: true,
121            labelStyle: {
122                fontSize: 12,
123                color: appTheme.ForegroundColor,
124            },
125            axisBorder: {
126                borderRight: 1,
127                color: appTheme.ForegroundColor + "77",
128            },
129            majorTickLineStyle: {
130                color: appTheme.ForegroundColor,
131                tickSize: 6,
132                strokeThickness: 1,
133            },
134            minorTickLineStyle: {
135                color: appTheme.ForegroundColor,
136                tickSize: 3,
137                strokeThickness: 1,
138            },
139        },
140        colorMap: {
141            minimum: 0,
142            maximum: 0.5,
143            gradientStops: [
144                { offset: 1, color: appTheme.VividPink },
145                { offset: 0.9, color: appTheme.VividOrange },
146                { offset: 0.7, color: appTheme.MutedRed },
147                { offset: 0.5, color: appTheme.VividGreen },
148                { offset: 0.3, color: appTheme.VividSkyBlue },
149                { offset: 0.15, color: appTheme.Indigo },
150                { offset: 0, color: appTheme.DarkIndigo },
151            ],
152        },
153    });
154
155    return { sciChartSurface: heatmapLegend.innerSciChartSurface.sciChartSurface };
156};
157
See Also: JavaScript 3D Chart Types (6 Demos)
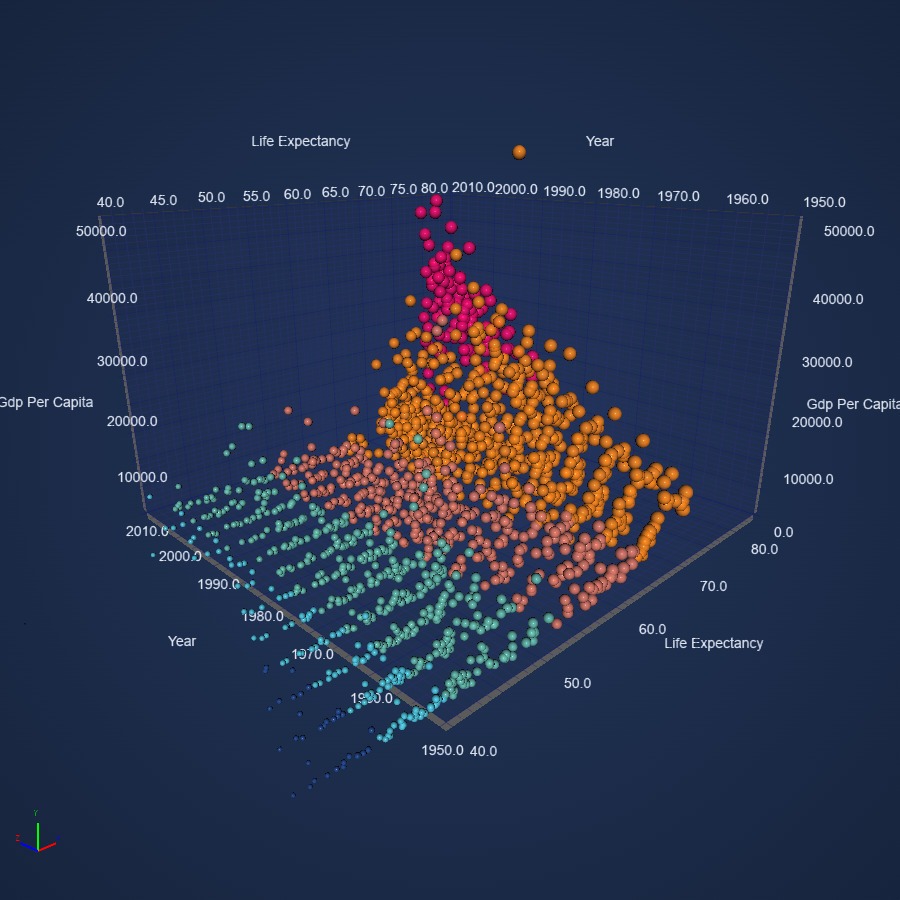
React 3D Bubble Chart
Create detailed React 3D Bubble Chart using SciChart's 5-star rated JavaScript chart library. Supports large datasets. Get your free demo now.
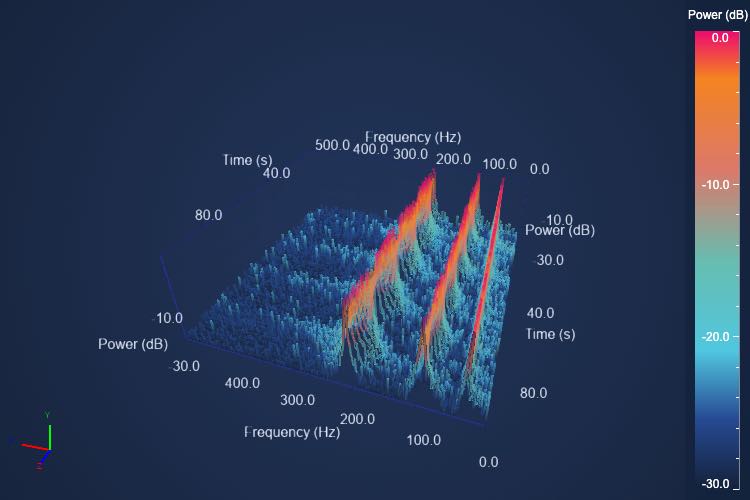
React Point Line 3D Chart
Create detailed React 3D Line Chart using SciChart's 5-star rated JavaScript chart library. Supports large datasets. Get your free demo now.
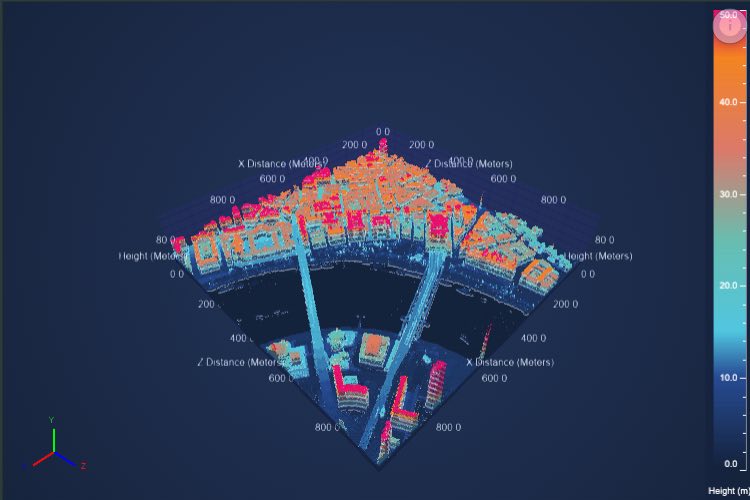
LiDAR 3D Point Cloud of Geospatial Data
Demonstrating the capability of SciChart.js to create JavaScript 3D Point Cloud charts and visualize LiDAR data from the UK Defra Survey.

Tenor Curves Demo
Demonstrating the capability of SciChart.js to create a composite 2D & 3D Chart application. An example like this could be used to visualize Tenor curves in a financial setting, or other 2D/3D data combined on a single screen.
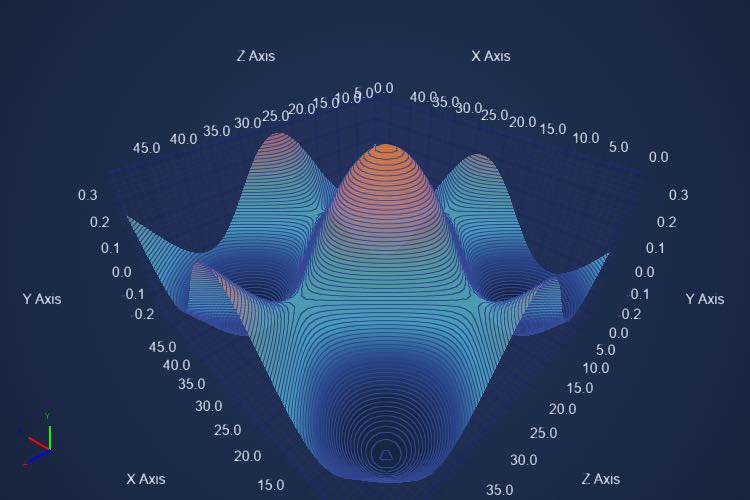
React Realtime Surface Mesh 3D Chart
Design a React 3D Surface Mesh Chart with SciChart.js - feature-rich JavaScript chart library. Represent 2D data in a 3D map. Get your free demo.
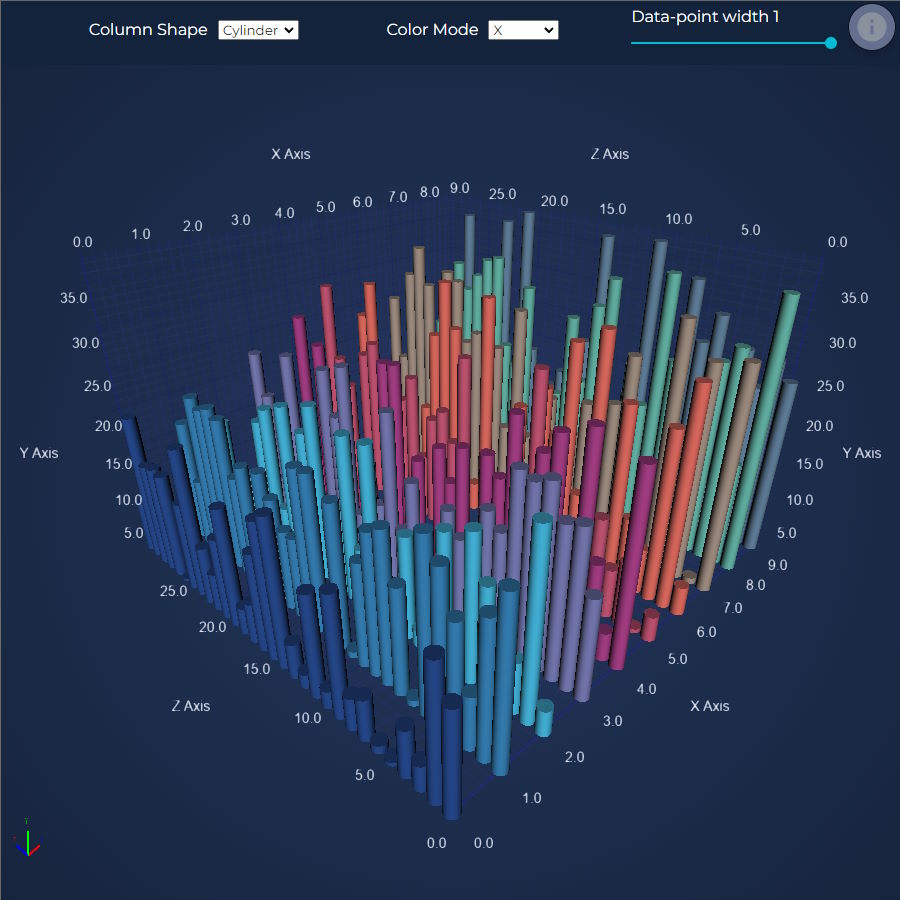
React Column 3D Chart
Create detailed React 3D Column Chart using SciChart's 5-star rated JavaScript chart library. Supports large datasets