Tenor Curves Demo
In financial applications sometimes you want to visualise options-volatility smiles or interest-rate swap tenor curves. This can be done in SciChart.js using a 3D Surface Mesh (heightmap) chart type.
drawExample.ts
index.tsx
ChartGroupLoader.tsx
theme.ts
TenorCurveData.ts
1import { appTheme } from "../../../theme";
2import { getTenorCurveData } from "./TenorCurveData";
3import {
4    EllipsePointMarker,
5    FastMountainRenderableSeries,
6    IDeletable,
7    NumericAxis,
8    NumberRange,
9    Point,
10    SciChartSurface,
11    XyDataSeries,
12    CameraController,
13    EDrawMeshAs,
14    EMeshPaletteMode,
15    GradientColorPalette,
16    HeatmapLegend,
17    MouseWheelZoomModifier3D,
18    NumericAxis3D,
19    OrbitModifier3D,
20    ResetCamera3DModifier,
21    SciChart3DSurface,
22    SurfaceMeshRenderableSeries3D,
23    UniformGridDataSeries3D,
24    Vector3,
25} from "scichart";
26
27const X_DATA_SIZE = 25;
28const Z_DATA_SIZE = 25;
29
30export const draw3DChart = async (rootElement: string | HTMLDivElement) => {
31    // Create the 3d chart
32    const { sciChart3DSurface, wasmContext } = await SciChart3DSurface.create(rootElement, {
33        theme: appTheme.SciChartJsTheme,
34    });
35
36    // Create camerea, position, field of view
37    sciChart3DSurface.camera = new CameraController(wasmContext, {
38        position: new Vector3(-225, 300, -225),
39        target: new Vector3(0, 50, 0),
40    });
41    sciChart3DSurface.camera.aspectRatio = 1.333;
42    sciChart3DSurface.camera.fieldOfView = 45;
43
44    // World dimensions specifies size of the axis cube box
45    sciChart3DSurface.worldDimensions = new Vector3(200, 200, 200);
46
47    // Add X.Y,Z axis
48    sciChart3DSurface.xAxis = new NumericAxis3D(wasmContext, { axisTitle: "X Axis" });
49    sciChart3DSurface.yAxis = new NumericAxis3D(wasmContext, { axisTitle: "Y Axis" });
50    sciChart3DSurface.zAxis = new NumericAxis3D(wasmContext, { axisTitle: "Z Axis" });
51
52    // Add optional interaction modifiers (mousewheel and orbit via mouse drag)
53    sciChart3DSurface.chartModifiers.add(new MouseWheelZoomModifier3D());
54    sciChart3DSurface.chartModifiers.add(new OrbitModifier3D());
55    sciChart3DSurface.chartModifiers.add(new ResetCamera3DModifier());
56
57    // returns data for the example. UniformGridDataSeries3D expects number[][] 2D Array
58    // filled with values. The values are heights (y-values) on the 3d chart and
59    // are mapped to colors via a colorMap
60    const tenorCurvesData = getTenorCurveData(X_DATA_SIZE, Z_DATA_SIZE);
61
62    // Create the DataSeries for the 3d chart
63    const dataSeries = new UniformGridDataSeries3D(wasmContext, {
64        yValues: tenorCurvesData,
65        xStep: 1,
66        zStep: 1,
67        dataSeriesName: "Uniform Surface Mesh",
68    });
69
70    // Create a color map. Color at offset=0 is mapped to y-value at SurfaceMeshRenderableSeries3D.minimum
71    // color at offset = 1 is mapped to y-value at SurfaceMeshRenderableSeries3D.maximum
72    const colorMap = new GradientColorPalette(wasmContext, {
73        gradientStops: [
74            { offset: 1, color: appTheme.VividPink },
75            { offset: 0.9, color: appTheme.VividOrange },
76            { offset: 0.7, color: appTheme.MutedRed },
77            { offset: 0.5, color: appTheme.VividGreen },
78            { offset: 0.3, color: appTheme.VividSkyBlue },
79            { offset: 0.2, color: appTheme.Indigo },
80            { offset: 0, color: appTheme.DarkIndigo },
81        ],
82    });
83
84    const series = new SurfaceMeshRenderableSeries3D(wasmContext, {
85        dataSeries,
86        minimum: 1,
87        maximum: 100,
88        opacity: 1.0,
89        cellHardnessFactor: 1,
90        shininess: 0,
91        lightingFactor: 0.8,
92        highlight: 0.05,
93        stroke: appTheme.VividSkyBlue + "33",
94        strokeThickness: 1.5,
95        drawSkirt: false,
96        drawMeshAs: EDrawMeshAs.SOLID_WIREFRAME,
97        meshPaletteMode: EMeshPaletteMode.HEIGHT_MAP_INTERPOLATED,
98        meshColorPalette: colorMap,
99    });
100    sciChart3DSurface.renderableSeries.add(series);
101
102    return { sciChartSurface: sciChart3DSurface };
103};
104
105export const drawLineChart1 = async (rootElement: string | HTMLDivElement) => {
106    const { sciChartSurface, wasmContext } = await SciChartSurface.create(rootElement, {
107        theme: appTheme.SciChartJsTheme,
108    });
109    const xAxis = new NumericAxis(wasmContext);
110    sciChartSurface.xAxes.add(xAxis);
111
112    const yAxis = new NumericAxis(wasmContext, { growBy: new NumberRange(0.05, 0.05) });
113    sciChartSurface.yAxes.add(yAxis);
114
115    // xAxis.isVisible = false;
116    // yAxis.isVisible = false;
117
118    const mountainSeries = new FastMountainRenderableSeries(wasmContext, {
119        stroke: appTheme.VividSkyBlue,
120        strokeThickness: 3,
121        pointMarker: new EllipsePointMarker(wasmContext, {
122            width: 9,
123            height: 9,
124            stroke: appTheme.VividSkyBlue,
125            strokeThickness: 2,
126            fill: appTheme.ForegroundColor,
127        }),
128        fillLinearGradient: {
129            startPoint: new Point(0, 0),
130            endPoint: new Point(0, 1),
131            gradientStops: [
132                { offset: 0, color: appTheme.VividSkyBlue },
133                { offset: 1, color: "Transparent" },
134            ],
135        },
136    });
137    sciChartSurface.renderableSeries.add(mountainSeries);
138
139    const dataSeries = new XyDataSeries(wasmContext);
140    const tenorCurvesData = getTenorCurveData(X_DATA_SIZE, Z_DATA_SIZE);
141    let average: number;
142    for (let z = 0; z < Z_DATA_SIZE; z++) {
143        average = 0;
144        for (let x = 0; x < X_DATA_SIZE; x++) {
145            average += tenorCurvesData[x][z];
146        }
147        dataSeries.append(z, average / X_DATA_SIZE);
148    }
149    mountainSeries.dataSeries = dataSeries;
150
151    return { sciChartSurface };
152};
153
154export const drawLineChart2 = async (rootElement: string | HTMLDivElement) => {
155    const { sciChartSurface, wasmContext } = await SciChartSurface.create(rootElement, {
156        theme: appTheme.SciChartJsTheme,
157    });
158
159    const xAxis = new NumericAxis(wasmContext);
160    sciChartSurface.xAxes.add(xAxis);
161
162    const yAxis = new NumericAxis(wasmContext, { growBy: new NumberRange(0.05, 0.05) });
163    sciChartSurface.yAxes.add(yAxis);
164    // xAxis.isVisible = false;
165    // yAxis.isVisible = false;
166
167    const mountainSeries = new FastMountainRenderableSeries(wasmContext, {
168        stroke: appTheme.PaleSkyBlue,
169        strokeThickness: 5,
170        fillLinearGradient: {
171            startPoint: new Point(0, 0),
172            endPoint: new Point(0, 1),
173            gradientStops: [
174                { offset: 0, color: appTheme.VividTeal },
175                { offset: 1, color: "Transparent" },
176            ],
177        },
178        pointMarker: new EllipsePointMarker(wasmContext, {
179            width: 9,
180            height: 9,
181            stroke: appTheme.PaleSkyBlue,
182            strokeThickness: 2,
183            fill: appTheme.ForegroundColor,
184        }),
185    });
186    sciChartSurface.renderableSeries.add(mountainSeries);
187
188    const dataSeries = new XyDataSeries(wasmContext);
189    const tenorCurvesData = getTenorCurveData(X_DATA_SIZE, Z_DATA_SIZE);
190    const zMiddleIndex = Math.floor(Z_DATA_SIZE / 2);
191    for (let x = 0; x < Z_DATA_SIZE; x++) {
192        dataSeries.append(x, tenorCurvesData[x][zMiddleIndex]);
193    }
194    mountainSeries.dataSeries = dataSeries;
195
196    return { sciChartSurface };
197};
198
199export const drawHeatmapLegend = async (rootElement: string | HTMLDivElement) => {
200    const { heatmapLegend, wasmContext } = await HeatmapLegend.create(rootElement, {
201        theme: {
202            ...appTheme.SciChartJsTheme,
203            sciChartBackground: appTheme.DarkIndigo + "BB",
204            loadingAnimationBackground: appTheme.DarkIndigo + "BB",
205        },
206        yAxisOptions: {
207            isInnerAxis: true,
208            labelStyle: {
209                fontSize: 12,
210                color: appTheme.ForegroundColor,
211            },
212            axisBorder: {
213                borderRight: 1,
214                color: appTheme.ForegroundColor + "77",
215            },
216            majorTickLineStyle: {
217                color: appTheme.ForegroundColor,
218                tickSize: 6,
219                strokeThickness: 1,
220            },
221            minorTickLineStyle: {
222                color: appTheme.ForegroundColor,
223                tickSize: 3,
224                strokeThickness: 1,
225            },
226        },
227        colorMap: {
228            minimum: 0,
229            maximum: 200,
230            gradientStops: [
231                { offset: 1, color: appTheme.VividPink },
232                { offset: 0.9, color: appTheme.VividOrange },
233                { offset: 0.7, color: appTheme.MutedRed },
234                { offset: 0.5, color: appTheme.VividGreen },
235                { offset: 0.3, color: appTheme.VividSkyBlue },
236                { offset: 0.2, color: appTheme.Indigo },
237                { offset: 0, color: appTheme.DarkIndigo },
238            ],
239        },
240    });
241
242    return { sciChartSurface: heatmapLegend.innerSciChartSurface.sciChartSurface };
243};
244
See Also: Financial Charts (8 Demos)

React Candlestick Chart
Discover how to create a React Candlestick Chart or Stock Chart using SciChart.js. For high Performance JavaScript Charts, get your free demo now.
React OHLC Chart
Easily create React OHLC Chart or Stock Chart using feature-rich SciChart.js chart library. Supports custom colors. Get your free trial now.
React Realtime Ticking Stock Charts
Create a React Realtime Ticking Candlestick / Stock Chart with live ticking and updating, using the high performance SciChart.js chart library. Get free demo now.
React Multi-Pane Stock Charts using Subcharts
Create a React Multi-Pane Candlestick / Stock Chart with indicator panels, synchronized zooming, panning and cursors. Get your free trial of SciChart.js now.
React Multi-Pane Stock Charts using Sync Multi-Chart
Create a React Multi-Pane Candlestick / Stock Chart with indicator panels, synchronized zooming, panning and cursors. Get your free trial of SciChart.js now.
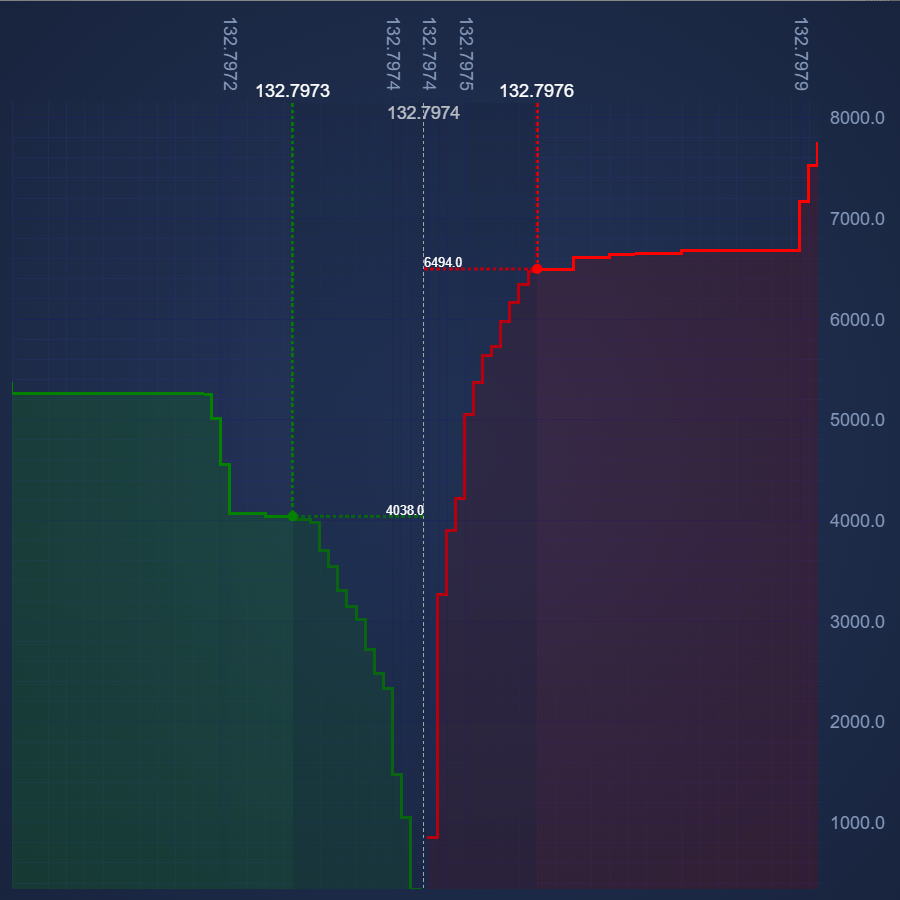
React Market Depth Chart
Create a React Depth Chart, using the high performance SciChart.js chart library. Get free demo now.
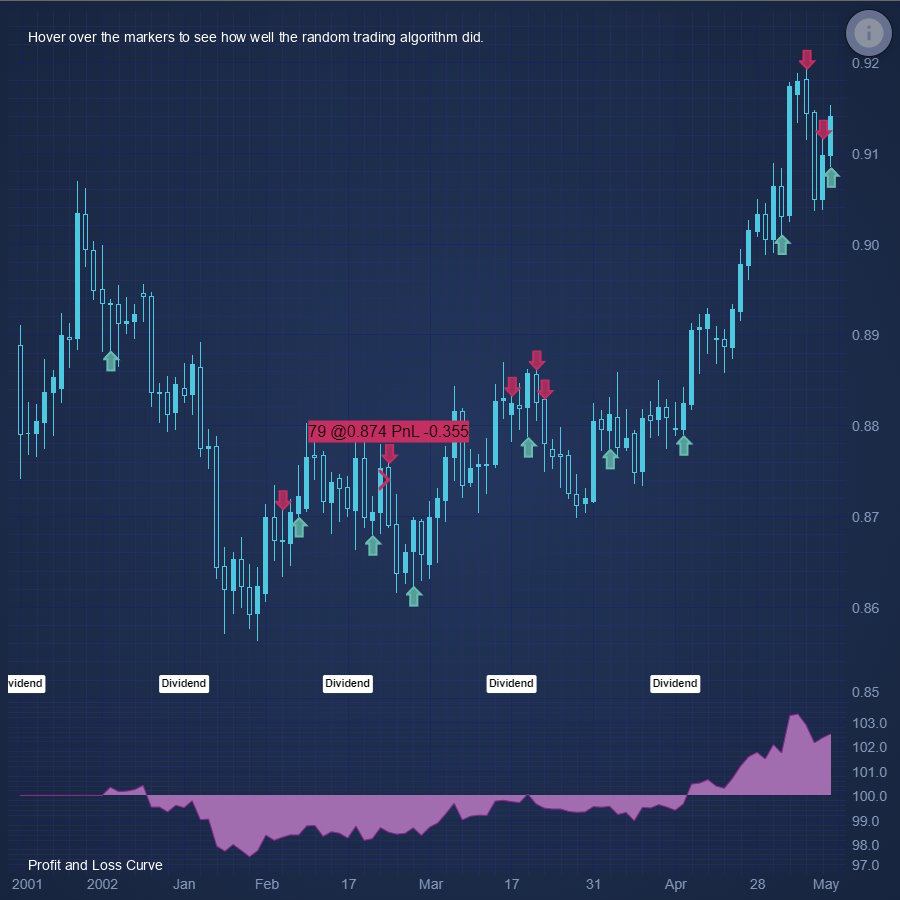
React Chart Hoverable Buy Sell Marker Annotations
Demonstrates how to place Buy/Sell arrow markers on a React Stock Chart using SciChart.js - Annotations API
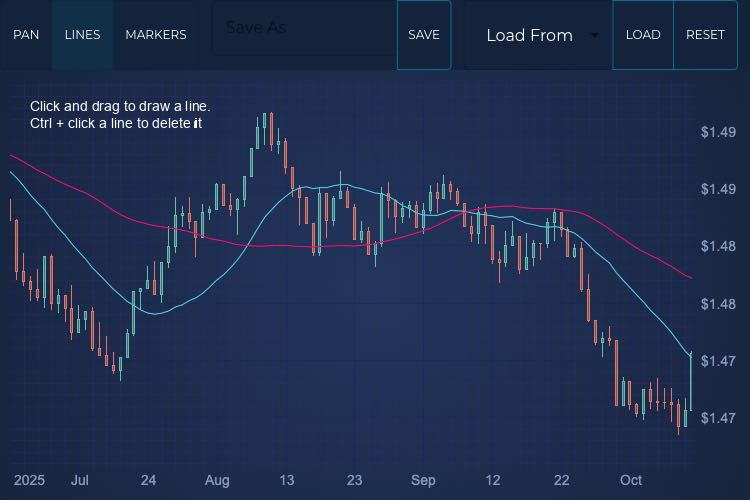
React User Annotated Stock Chart
This demo shows you how to create a <strong>{frameworkName} User Annotated Stock Chart</strong> using SciChart.js. Custom modifiers allow you to add lines and markers, then use the built in serialisation functions to save and reload the chart, including the data and all your custom annotations.