Trendline, Moving Average and Ratio Filters
Demonstrates how use Linear Trend, Moving Average and Ratio Filters with filter chaining, using SciChart.js, High Performance JavaScript Charts
drawExample.ts
index.tsx
RandomWalkGenerator.ts
theme.ts
Copy to clipboard
Minimise
Fullscreen
1import { appTheme } from "../../../theme";
2import { RandomWalkGenerator } from "../../../ExampleData/RandomWalkGenerator";
3
4import {
5    EAxisAlignment,
6    ECoordinateMode,
7    EHorizontalAnchorPoint,
8    EVerticalAnchorPoint,
9    ELegendOrientation,
10    ELegendPlacement,
11    NumberRange,
12    TextAnnotation,
13    FastLineRenderableSeries,
14    LegendModifier,
15    MouseWheelZoomModifier,
16    NumericAxis,
17    SciChartSurface,
18    XyDataSeries,
19    XyLinearTrendFilter,
20    XyMovingAverageFilter,
21    XyRatioFilter,
22    XyScaleOffsetFilter,
23    ZoomExtentsModifier,
24    ZoomPanModifier,
25    NativeTextAnnotation,
26    EWrapTo,
27    EMultiLineAlignment,
28} from "scichart";
29
30const RATIO_YAXIS_ID = "RatioYAxisId";
31
32export const drawExample = async (rootElement: string | HTMLDivElement) => {
33    const { sciChartSurface, wasmContext } = await SciChartSurface.create(rootElement, {
34        theme: appTheme.SciChartJsTheme,
35    });
36
37    sciChartSurface.xAxes.add(
38        new NumericAxis(wasmContext, {
39            axisTitle: "X Axis",
40        })
41    );
42
43    sciChartSurface.yAxes.add(
44        new NumericAxis(wasmContext, {
45            axisAlignment: EAxisAlignment.Left,
46            axisTitle: "Original Data Y Axis",
47            growBy: new NumberRange(0.1, 0.1),
48        })
49    );
50
51    sciChartSurface.yAxes.add(
52        new NumericAxis(wasmContext, {
53            axisAlignment: EAxisAlignment.Right,
54            axisTitle: "Ratio Axis",
55            id: RATIO_YAXIS_ID,
56            growBy: new NumberRange(0.1, 0.1),
57            visibleRange: new NumberRange(-20, 20),
58        })
59    );
60
61    // Create an original Data Series with some X,Y data
62    const data1 = new RandomWalkGenerator().Seed(420).getRandomWalkSeries(500);
63    const originalDataSeries = new XyDataSeries(wasmContext, {
64        xValues: data1.xValues,
65        yValues: data1.yValues,
66        dataSeriesName: "Original",
67    });
68    sciChartSurface.renderableSeries.add(
69        new FastLineRenderableSeries(wasmContext, {
70            strokeThickness: 3,
71            stroke: appTheme.VividSkyBlue,
72            dataSeries: originalDataSeries,
73        })
74    );
75
76    // Compute a moving average using filters API and apply to the chart
77    sciChartSurface.renderableSeries.add(
78        new FastLineRenderableSeries(wasmContext, {
79            stroke: appTheme.VividRed,
80            strokeThickness: 3,
81            dataSeries: new XyMovingAverageFilter(originalDataSeries, {
82                length: 10,
83                dataSeriesName: "Moving Average (10)",
84            }),
85        })
86    );
87
88    // Compute a moving average using filters API and apply to the chart
89    sciChartSurface.renderableSeries.add(
90        new FastLineRenderableSeries(wasmContext, {
91            stroke: appTheme.VividOrange,
92            strokeThickness: 3,
93            dataSeries: new XyMovingAverageFilter(originalDataSeries, {
94                length: 20,
95                dataSeriesName: "Moving Average (20)",
96            }),
97        })
98    );
99
100    // Compute an offset of the original series
101    const offsetSeries = new XyScaleOffsetFilter(originalDataSeries, {
102        offset: -0.5,
103        scale: 2,
104        dataSeriesName: "Offset -0.5 / Scaled x2",
105    });
106    sciChartSurface.renderableSeries.add(
107        new FastLineRenderableSeries(wasmContext, {
108            stroke: appTheme.VividSkyBlue + "33",
109            strokeThickness: 3,
110            dataSeries: offsetSeries,
111        })
112    );
113
114    // Compute a trendline
115    sciChartSurface.renderableSeries.add(
116        new FastLineRenderableSeries(wasmContext, {
117            stroke: appTheme.MutedPurple,
118            strokeDashArray: [3, 3],
119            strokeThickness: 3,
120            dataSeries: new XyLinearTrendFilter(originalDataSeries, { dataSeriesName: "Linear Trendline" }),
121        })
122    );
123
124    // Compute a ratio between the trendline & the original series
125    sciChartSurface.renderableSeries.add(
126        new FastLineRenderableSeries(wasmContext, {
127            strokeThickness: 3,
128            stroke: appTheme.MutedRed,
129            yAxisId: RATIO_YAXIS_ID,
130            dataSeries: new XyRatioFilter(originalDataSeries, {
131                divisorSeries: offsetSeries,
132                dataSeriesName: "Ratio (Original vs. Offset)",
133            }),
134        })
135    );
136
137    // Add a title over the chart with information
138    sciChartSurface.annotations.add(
139        new NativeTextAnnotation({
140            x1: 0.02,
141            y1: 0.02,
142            xCoordinateMode: ECoordinateMode.Relative,
143            yCoordinateMode: ECoordinateMode.Relative,
144            horizontalAnchorPoint: EHorizontalAnchorPoint.Left,
145            verticalAnchorPoint: EVerticalAnchorPoint.Top,
146            fontSize: 18,
147            opacity: 0.55,
148            textColor: appTheme.ForegroundColor,
149            text: "SciChart.js supports dynamic transforms like Moving Averages, Trendlines, Ratios",
150            wrapTo: EWrapTo.ViewRect,
151            multiLineAlignment: EMultiLineAlignment.Left,
152        })
153    );
154
155    // Optional: add some chartmodifiers for interaction and to show the legend
156    sciChartSurface.chartModifiers.add(
157        new MouseWheelZoomModifier(),
158        new ZoomPanModifier({ enableZoom: true }),
159        new ZoomExtentsModifier(),
160        new LegendModifier({ placement: ELegendPlacement.BottomLeft, orientation: ELegendOrientation.Horizontal })
161    );
162
163    return { sciChartSurface, wasmContext };
164};
165
See Also: Transforming Data with Filters (3 Demos)

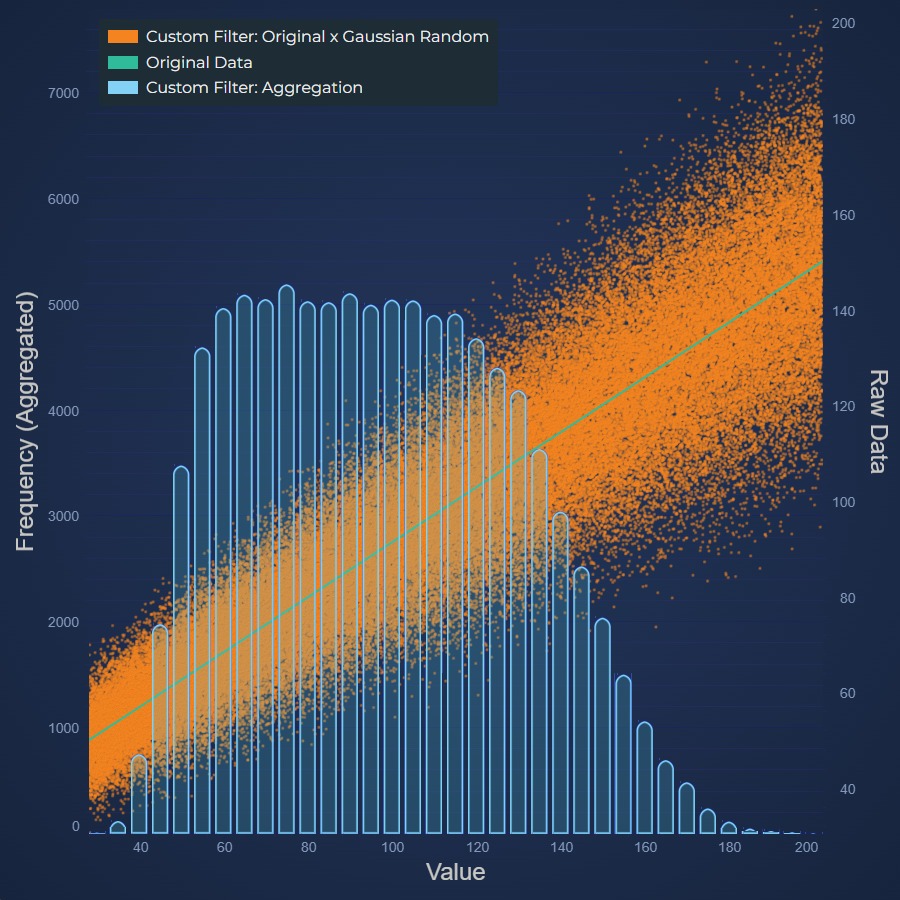
Custom Filters
Demonstrates simple and advanced Custom Filters for data transformation and aggregation, with realtime updates

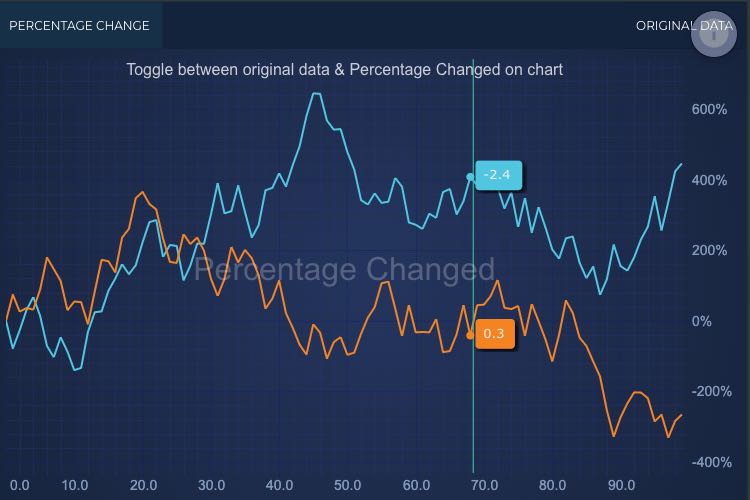
Realtime Percentage Change using Filter
How to use a ScaleOffsetFilter to convert data to a percentage change, with realtime updates, rescale on pan

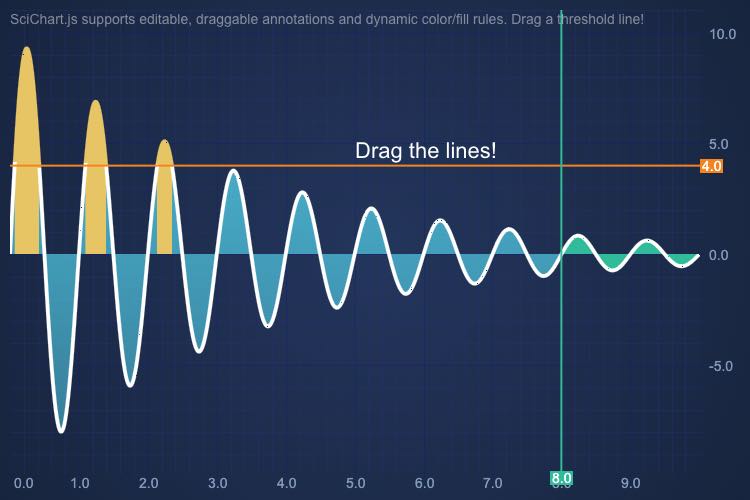
React Mountain Chart Draggable Thresholds
Demonstrates how to add draggable thresholds which change the series color in the chart in SciChart.js
Quick Links
Useful Links
SciChart Ltd, 16 Beaufort Court, Admirals Way, Docklands, London, E14 9XL.