Synchronise Multiple Charts
This example demonstrates how to synchronise layout and visible range across multiple dynamic charts, and how to synchronise series with an overview chart.using SciChart.js, High Performance JavaScript Charts
Click and drag or mousewheel to zoom/pan the charts.
index.tsx
RandomWalkGenerator.ts
theme.ts
Copy to clipboard
Minimise
Fullscreen
1export class RandomWalkGenerator {
2    private readonly bias: number;
3    private last: number;
4    private i: number;
5    private _seed: number;
6    constructor(bias: number = 0.01) {
7        this.bias = bias;
8        this.reset();
9    }
10
11    public Seed(seed: number) {
12        this._seed = seed % 2147483647;
13        if (this._seed <= 0) this._seed += 2147483646;
14        return this;
15    }
16
17    public reset() {
18        this.i = 0;
19        this.last = 0;
20    }
21
22    public getRandomWalkSeries(count: number): { xValues: number[]; yValues: number[] } {
23        const xValues: number[] = [];
24        const yValues: number[] = [];
25        const random = () => (this._seed === undefined ? Math.random() : (this.nextSeeded() - 1) / 2147483646);
26        for (let i = 0; i < count; i++) {
27            const next: number = this.last + (random() - 0.5 + this.bias);
28            xValues.push(this.i++);
29            yValues.push(next);
30            this.last = next;
31        }
32
33        return { xValues, yValues };
34    }
35
36    private nextSeeded() {
37        return (this._seed = (this._seed * 16807) % 2147483647);
38    }
39}
40
See Also: Multiple Charts (2 Demos)

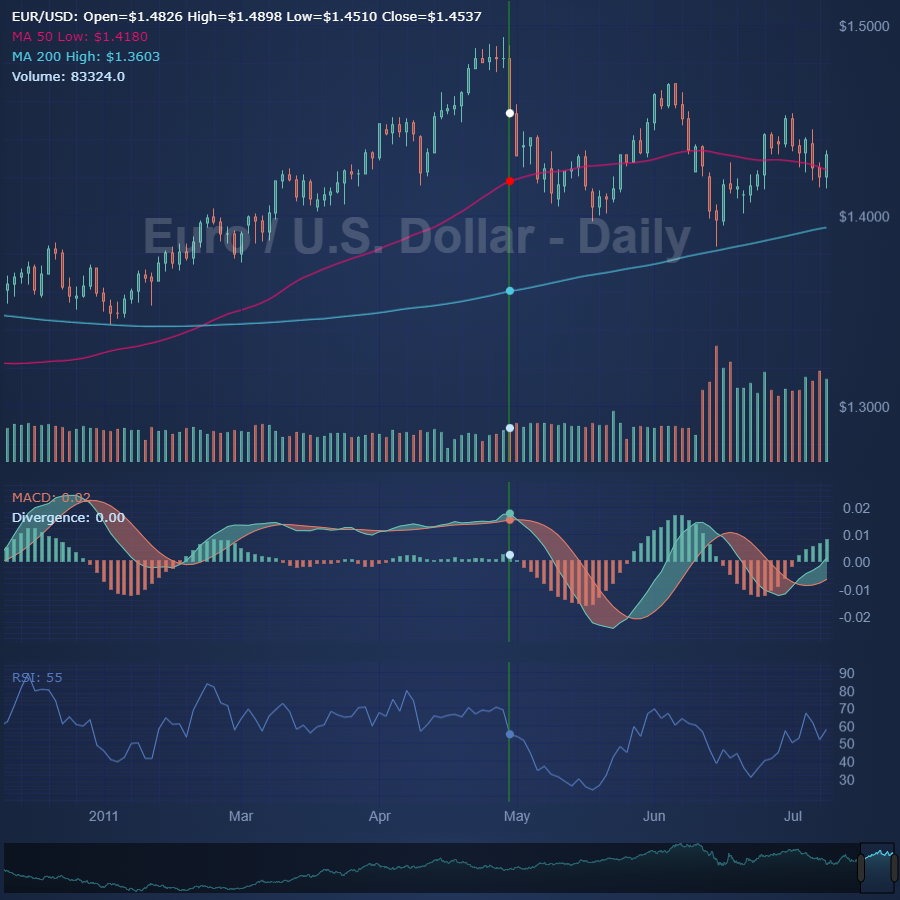
React Multi-Pane Stock Charts using Sync Multi-Chart
Create a React Multi-Pane Candlestick / Stock Chart with indicator panels, synchronized zooming, panning and cursors. Get your free trial of SciChart.js now.

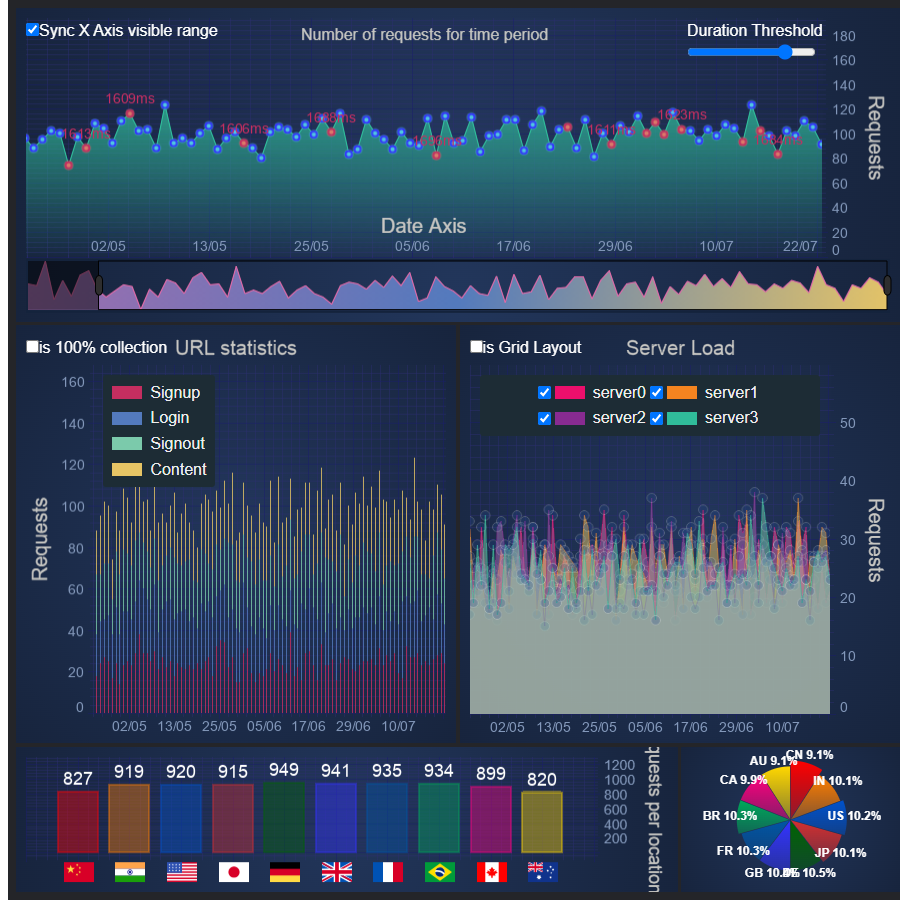
Server Traffic Dashboard
This dashboard demo showcases the incredible realtime performance of our React charts by updating the series with millions of data-points!
Quick Links
Useful Links
SciChart Ltd, 16 Beaufort Court, Admirals Way, Docklands, London, E14 9XL.