React Realtime Mountain Chart
This example demonstrates how create a React Mountain Chart with animated realtime updates using SciChart.js, our High Performance JavaScript Charts.
drawExample.ts
index.tsx
RandomWalkGenerator.ts
theme.ts
1import { appTheme } from "../../../theme";
2import {
3    AnimationToken,
4    CustomAnnotation,
5    DoubleAnimator,
6    easing,
7    EHorizontalAnchorPoint,
8    EVerticalAnchorPoint,
9    FastMountainRenderableSeries,
10    GradientParams,
11    NumericAxis,
12    NumberRange,
13    Point,
14    TEasingFn,
15    SciChartSurface,
16    XyDataSeries,
17} from "scichart";
18import { RandomWalkGenerator } from "../../../ExampleData/RandomWalkGenerator";
19
20export const drawExample = async (rootElement: string | HTMLDivElement) => {
21    // Create the SciChartSurface in the div 'scichart-root'
22    // The SciChartSurface, and webassembly context 'wasmContext' are paired. This wasmContext
23    // instance must be passed to other types that exist on the same surface.
24    const { sciChartSurface, wasmContext } = await SciChartSurface.create(rootElement, {
25        theme: appTheme.SciChartJsTheme,
26    });
27
28    // Create an X,Y Axis and add to the chart
29    const xAxis = new NumericAxis(wasmContext, { growBy: new NumberRange(0.1, 0.1) });
30    const yAxis = new NumericAxis(wasmContext, { growBy: new NumberRange(0.1, 0.1) });
31
32    sciChartSurface.xAxes.add(xAxis);
33    sciChartSurface.yAxes.add(yAxis);
34
35    // Generate some initial random data for the example
36    const generator = new RandomWalkGenerator();
37    const initialValues = generator.getRandomWalkSeries(50);
38
39    // Add a mountain series with initial data
40    const dataSeries = new XyDataSeries(wasmContext, {
41        xValues: initialValues.xValues,
42        yValues: initialValues.yValues,
43    });
44    sciChartSurface.renderableSeries.add(
45        new FastMountainRenderableSeries(wasmContext, {
46            dataSeries,
47            fillLinearGradient: new GradientParams(new Point(0, 0), new Point(0, 1), [
48                { color: appTheme.VividSkyBlue + "77", offset: 0 },
49                { color: "Transparent", offset: 1 },
50            ]),
51            stroke: appTheme.VividSkyBlue,
52            strokeThickness: 4,
53        })
54    );
55
56    // The animated pulsing dot at the end of the chart is rendered with this SVG annotation
57    const svgString = `<svg width="50" height="50" xmlns="http://www.w3.org/2000/svg">
58            <rect x="0" y="0" width="100%" height="100%" fill="transparent"/>
59            <circle cx="25" cy="25" fill="${appTheme.VividTeal}" r="5" stroke="${appTheme.VividTeal}">
60                <animate attributeName="r" from="5" to="25" dur="1s" begin="0s" repeatCount="indefinite"/>
61                <animate attributeName="opacity" from="1" to="0" dur="1s" begin="0s" repeatCount="indefinite"/>
62            </circle>
63            <circle cx="25" cy="25" fill="${appTheme.VividSkyBlue}" r="5"/>
64        </svg>`;
65    const pulsingDotAnnotation = new CustomAnnotation({
66        x1: initialValues.xValues[initialValues.xValues.length - 1],
67        y1: initialValues.yValues[initialValues.yValues.length - 1],
68        xCoordShift: 0,
69        yCoordShift: 0,
70        horizontalAnchorPoint: EHorizontalAnchorPoint.Center,
71        verticalAnchorPoint: EVerticalAnchorPoint.Center,
72        svgString,
73    });
74
75    sciChartSurface.annotations.add(pulsingDotAnnotation);
76
77    let timerId: NodeJS.Timeout;
78    let animationToken: AnimationToken;
79    // This function performs animation on any XyDataSeries, animating the latest point only
80    // Be careful of reentrancy, e.g. calling animateXy more than once before previous animation has finished
81    // might require special handling
82    const animateXy = (xyDataSeries: XyDataSeries, endX: number, endY: number, duration: number, ease: TEasingFn) => {
83        const count = xyDataSeries.count();
84        const startX = xyDataSeries.getNativeXValues().get(count - 1);
85        const startY = xyDataSeries.getNativeYValues().get(count - 1);
86
87        // use the DoubleAnimator class in scichart/Core/Animations/ to setup an animation from 0...1
88        animationToken = DoubleAnimator.animate(
89            0,
90            1,
91            duration,
92            (interpolationFactor) => {
93                // Using the interpolation factor (ranges from 0..1) compute the X,Y value now
94                const currentX = (endX - startX) * interpolationFactor + startX;
95                const currentY = (endY - startY) * interpolationFactor + startY;
96
97                // Update X,Y value by direct access to the inner webassembly arrays
98                xyDataSeries.getNativeXValues().set(count - 1, currentX);
99                xyDataSeries.getNativeYValues().set(count - 1, currentY);
100
101                // update location of pulsing dot
102                pulsingDotAnnotation.x1 = currentX;
103                pulsingDotAnnotation.y1 = currentY;
104
105                // Force redraw
106                // can use xyDataSeries.notifyDataChanged();
107                // to just update, but if we want to zoom to fit, we must use zoomExtents
108                sciChartSurface.zoomExtents();
109            },
110            () => {
111                // Animation complete, append the point
112                xyDataSeries.append(endX, endY);
113            },
114            ease
115        );
116    };
117
118    // This is the loop where we add a new X,Y point and animate every 1 second to demonstrate animations
119    const runAddDataOnTimeout = () => {
120        if (sciChartSurface?.isDeleted) {
121            return;
122        }
123        const generated = generator.getRandomWalkSeries(1);
124        const x = generated.xValues[0];
125        const y = generated.yValues[0];
126        animateXy(dataSeries, x, y, 250, easing.outExpo);
127        timerId = setTimeout(runAddDataOnTimeout, 1000);
128    };
129
130    const startUpdate = () => {
131        if (timerId) {
132            stopUpdate();
133        }
134        runAddDataOnTimeout();
135    };
136
137    const stopUpdate = () => {
138        animationToken?.cancelAnimation();
139        clearTimeout(timerId);
140        timerId = undefined;
141    };
142
143    return { sciChartSurface, wasmContext, controls: { startUpdate, stopUpdate } };
144};
145
See Also: JavaScript Chart Types (28 Demos)

React Line Chart
Discover how to create a high performance React Line Chart with SciChart - the leading JavaScript library. Get your free demo now.
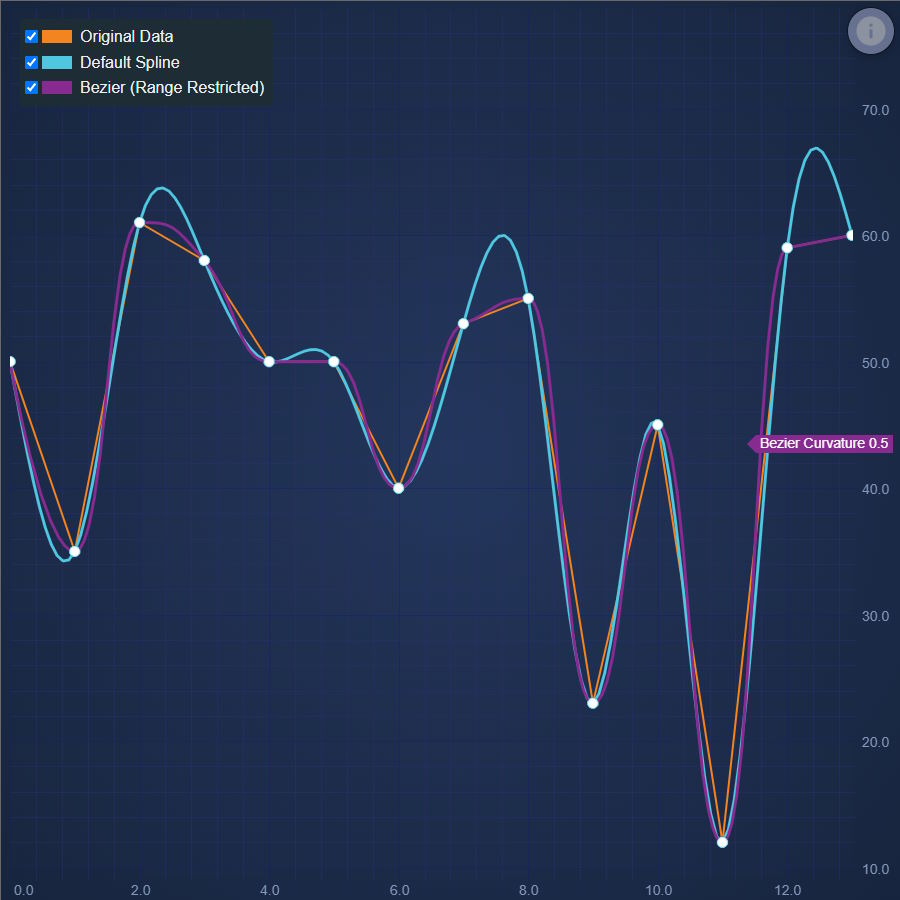
React Spline Line Chart
Discover how to create a React Spline Line Chart with SciChart. Demo includes algorithm for smoother lines. Get your free trial now.
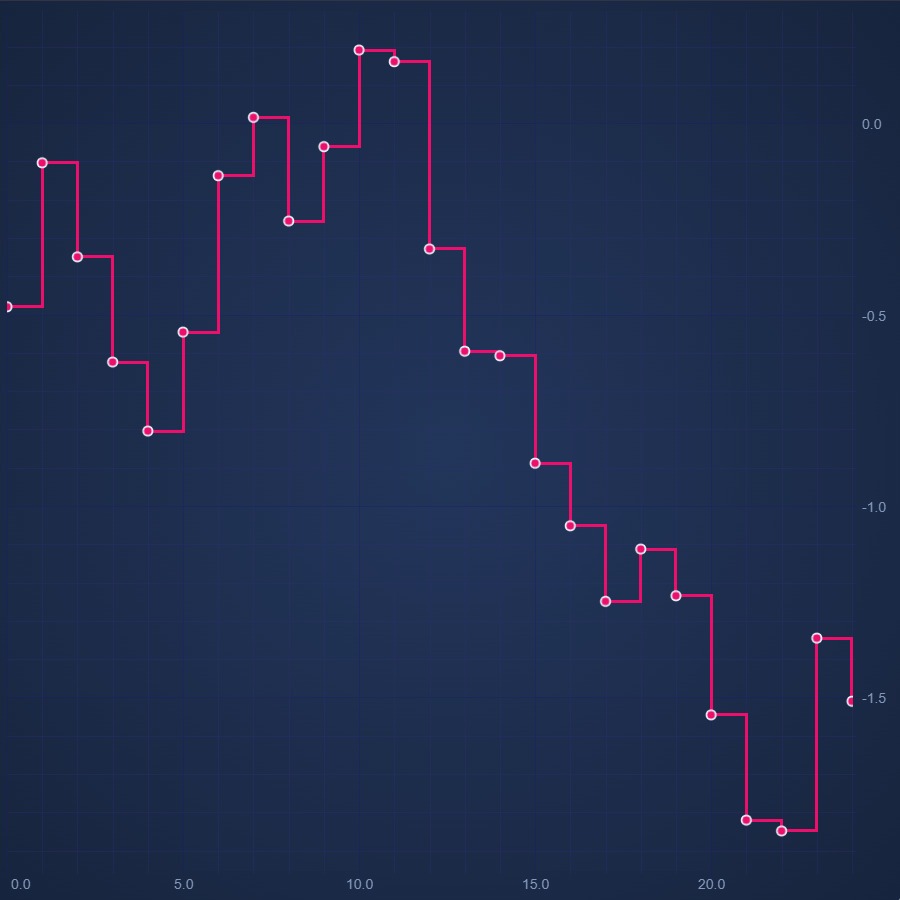
React Digital Line Chart
Discover how to create a React Digital Line Chart with SciChart - your feature-rich JavaScript Chart Library. Get your free demo now.
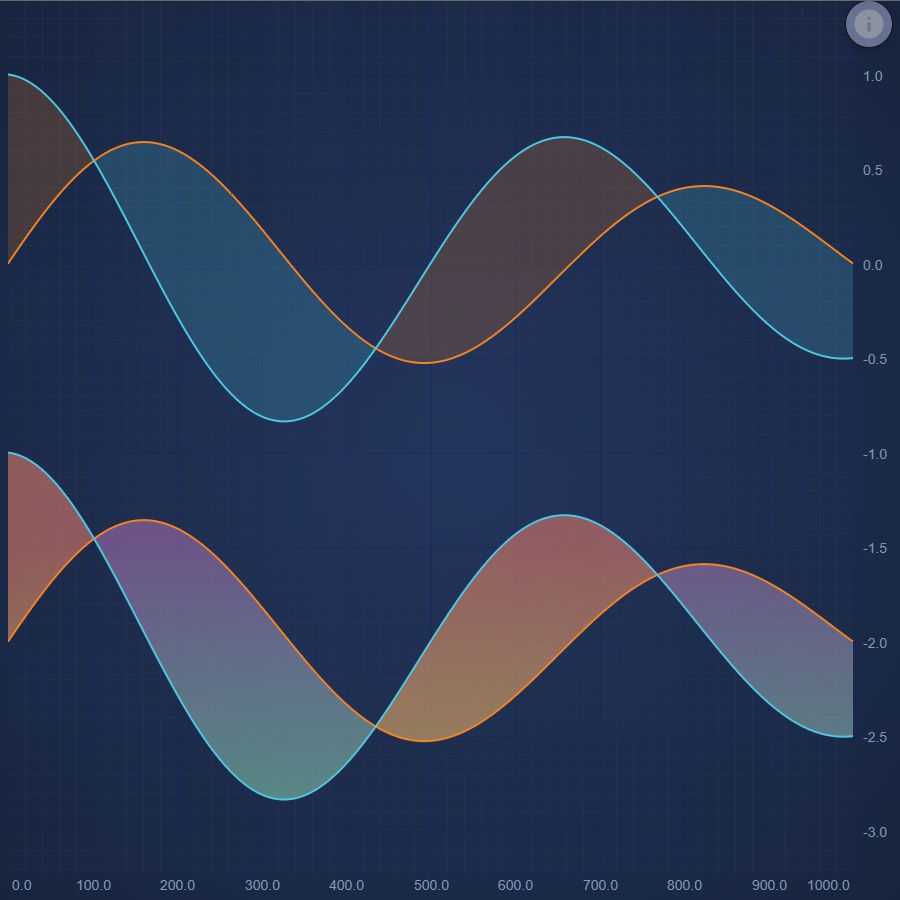
React Band Chart
Easily create a React Band Chart or High-Low Fill with SciChart - high performance JavaScript Chart Library. Get your free trial now.
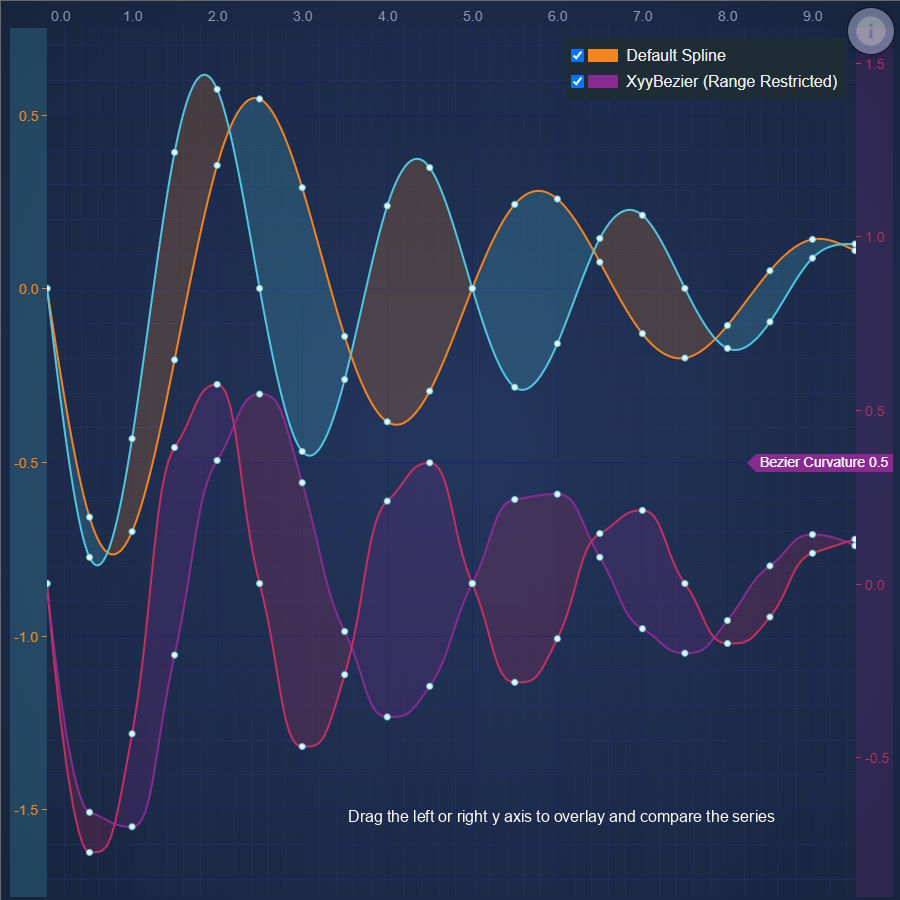
React Spline Band Chart
SciChart's React Spline Band Chart makes it easy to draw thresholds or fills between two lines on a chart. Get your free demo today.
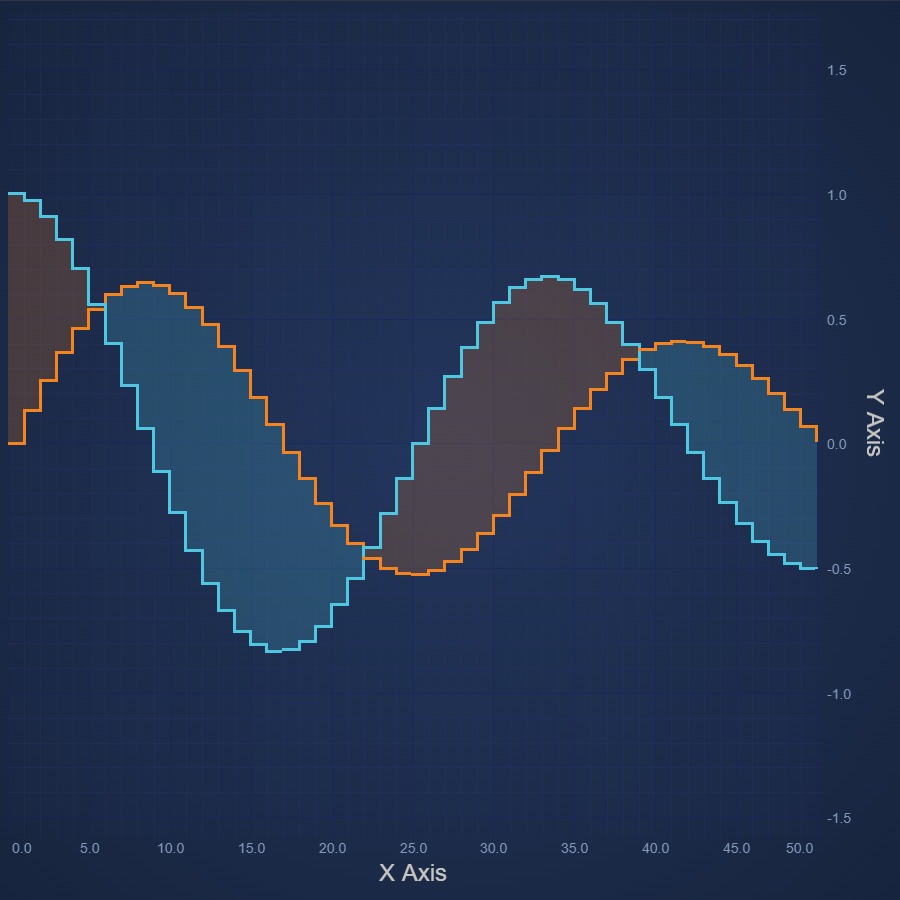
React Digital Band Chart
Learn how to create a React Digital Band Chart or High-Low Fill Chart with SciChart's easy-to-follow demos. Get your free trial today.
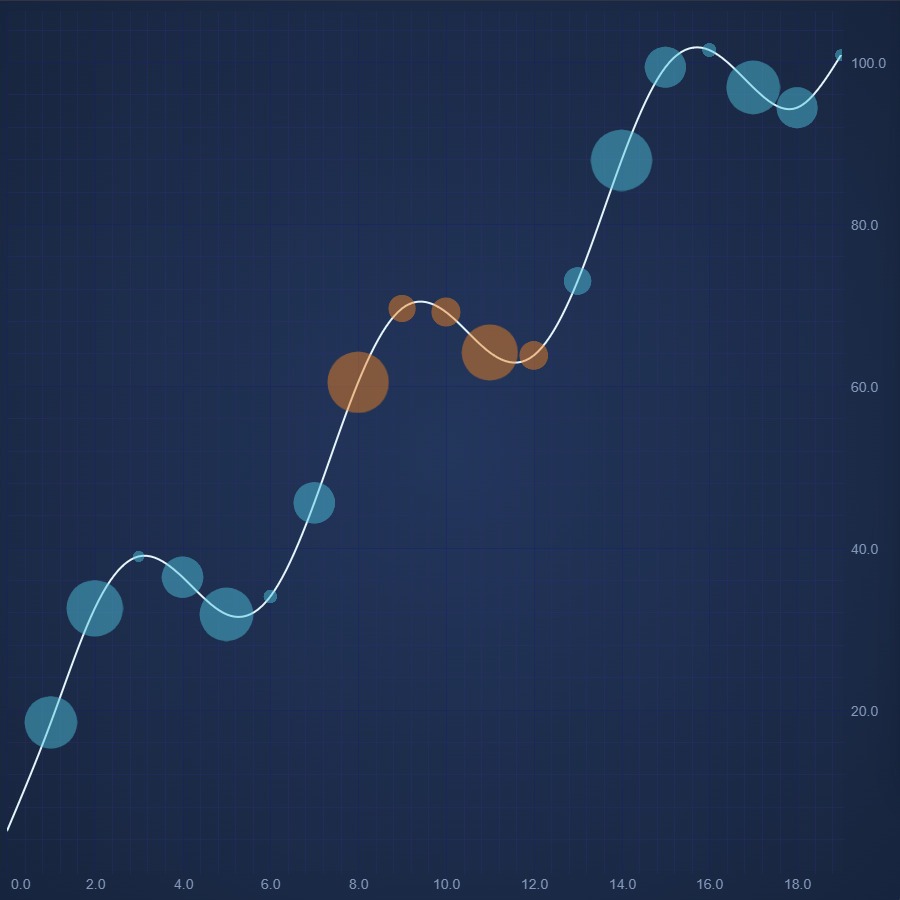
React Bubble Chart
Create a high performance React Bubble Chart with Sci-Chart. Demo shows how to draw point-markers at X,Y locations. Get your free demo now.

React Candlestick Chart
Discover how to create a React Candlestick Chart or Stock Chart using SciChart.js. For high Performance JavaScript Charts, get your free demo now.
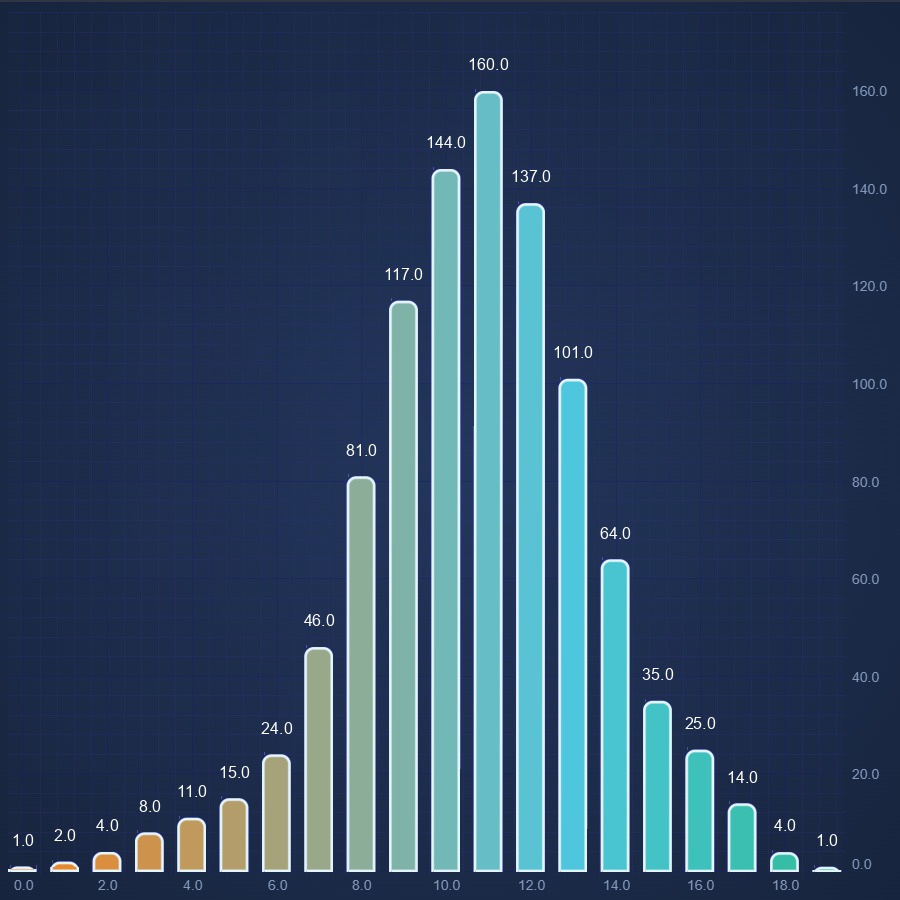
React Column Chart
React Column Chart demo by SciChart supports gradient fill and paletteproviders for more custom coloring options. Get your free demo now.
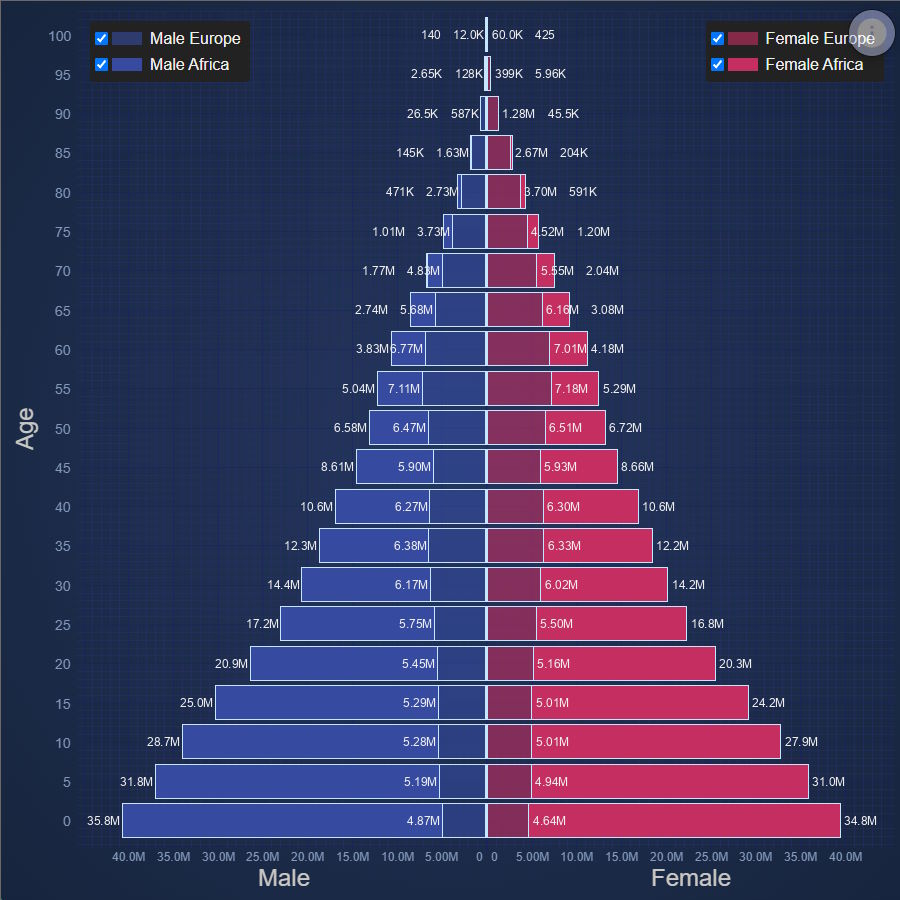
React Population Pyramid
Population Pyramid of Europe and Africa
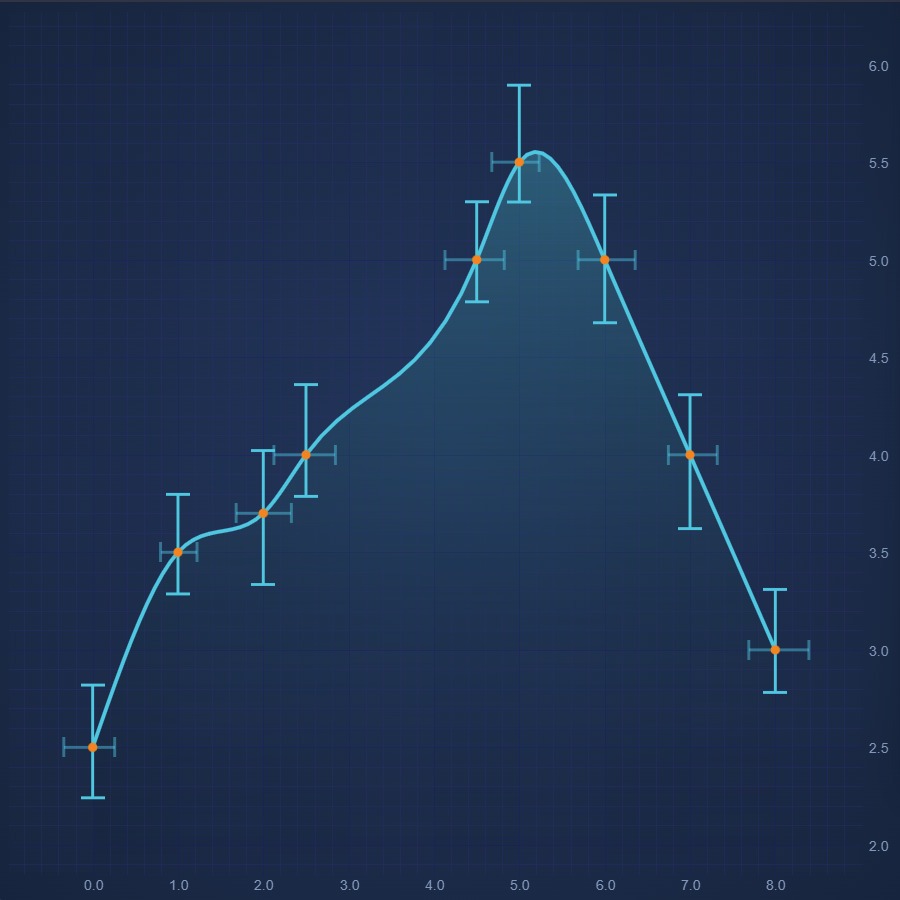
React Error Bars Chart
Create React Error Bars Chart using high performance SciChart.js. Display uncertainty or statistical confidence of a data-point. Get free demo now.
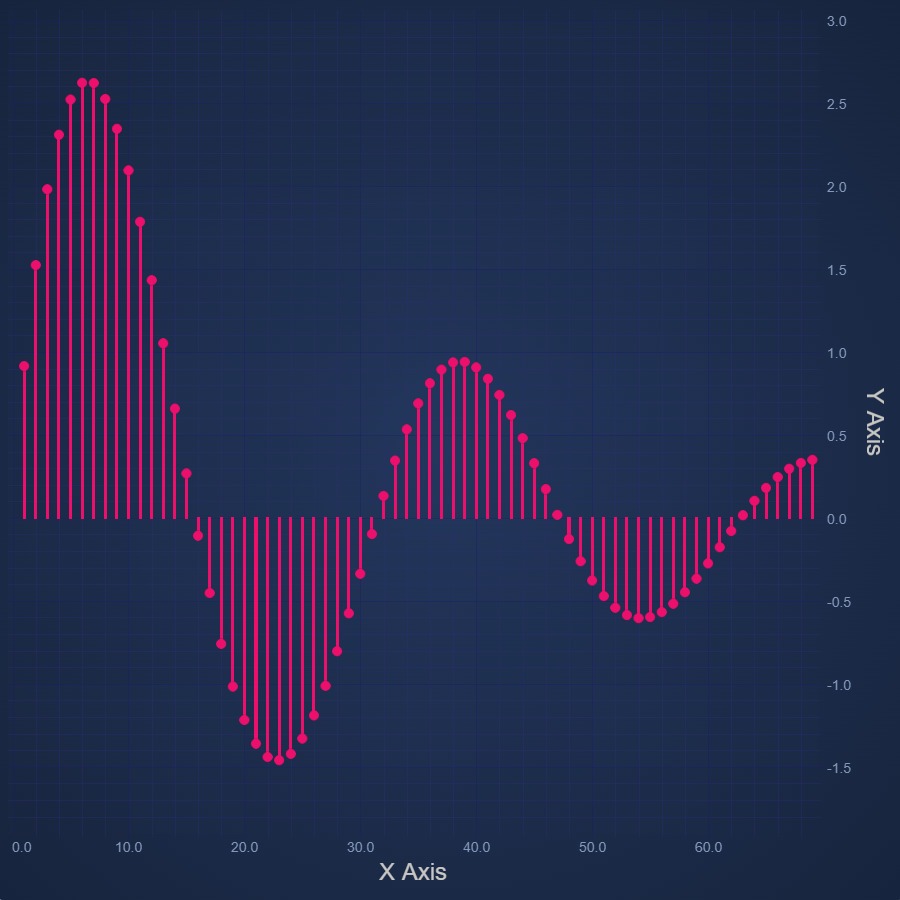
React Impulse Chart
Easily create React Impulse Chart or Stem Chart using SciChart.js - our own high performance JavaScript Chart Library. Get your free trial now.
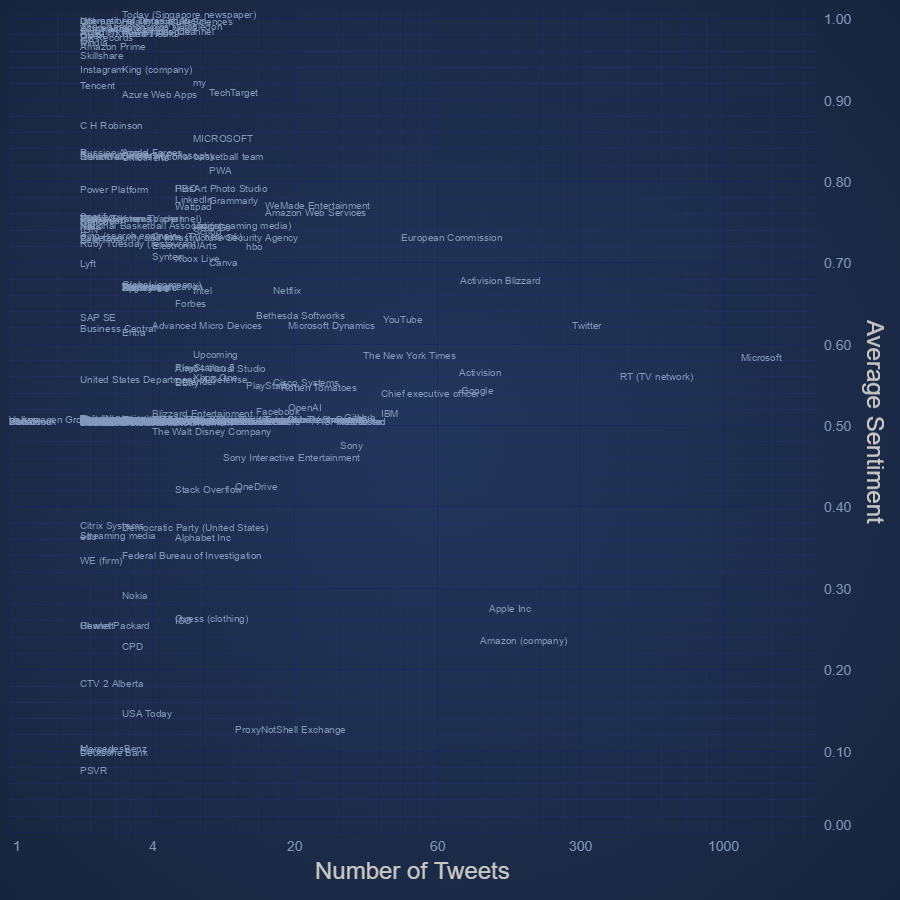
React Text Chart
Create React Text Chart with high performance SciChart.js.
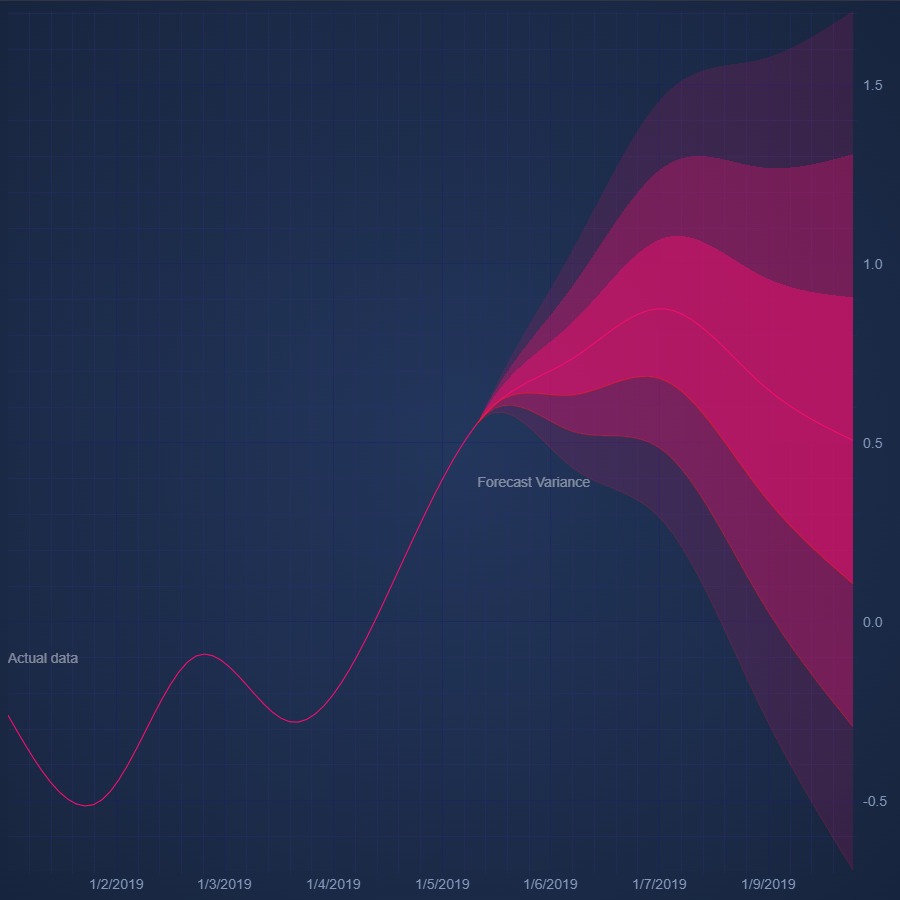
React Fan Chart
Discover how to create React Fan Chart with SciChart. Zoom in to see the detail you can go to using our JavaScript Charts. Get your free demo today.

React Heatmap Chart
Easily create a high performance React Heatmap Chart with SciChart. Get your free trial of our 5-star rated JavaScript Chart Component today.
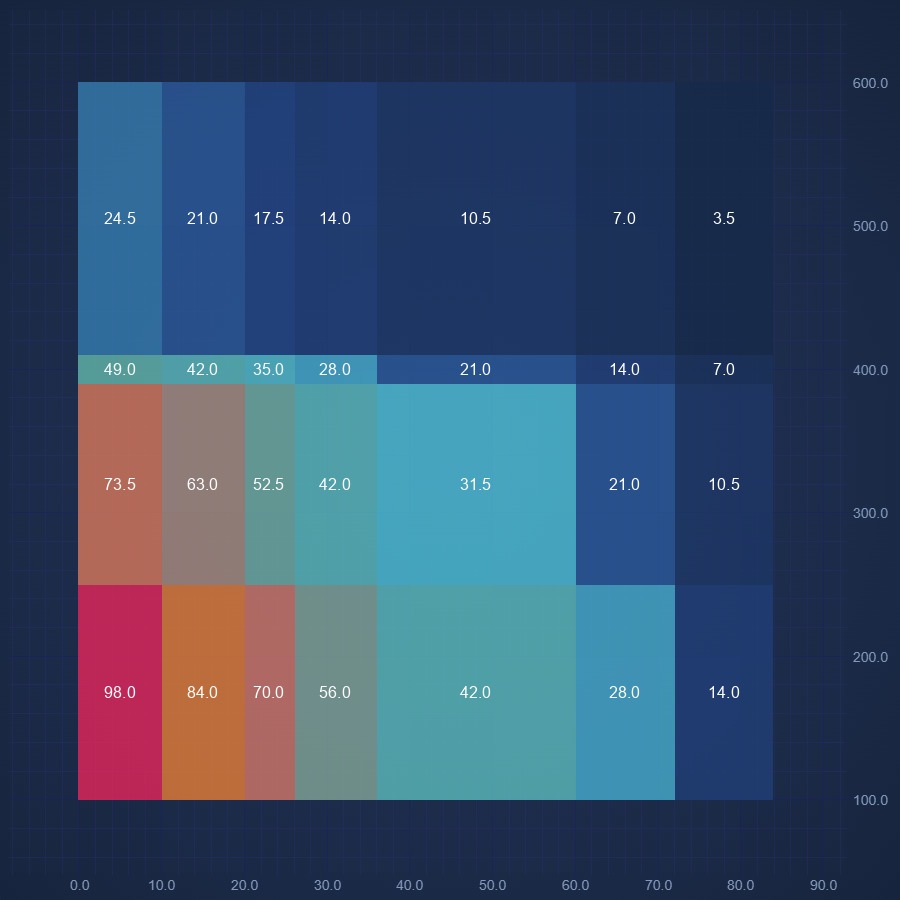
React Non Uniform Heatmap Chart
Create React Non Uniform Chart using high performance SciChart.js. Display Heatmap with variable cell sizes. Get free demo now.
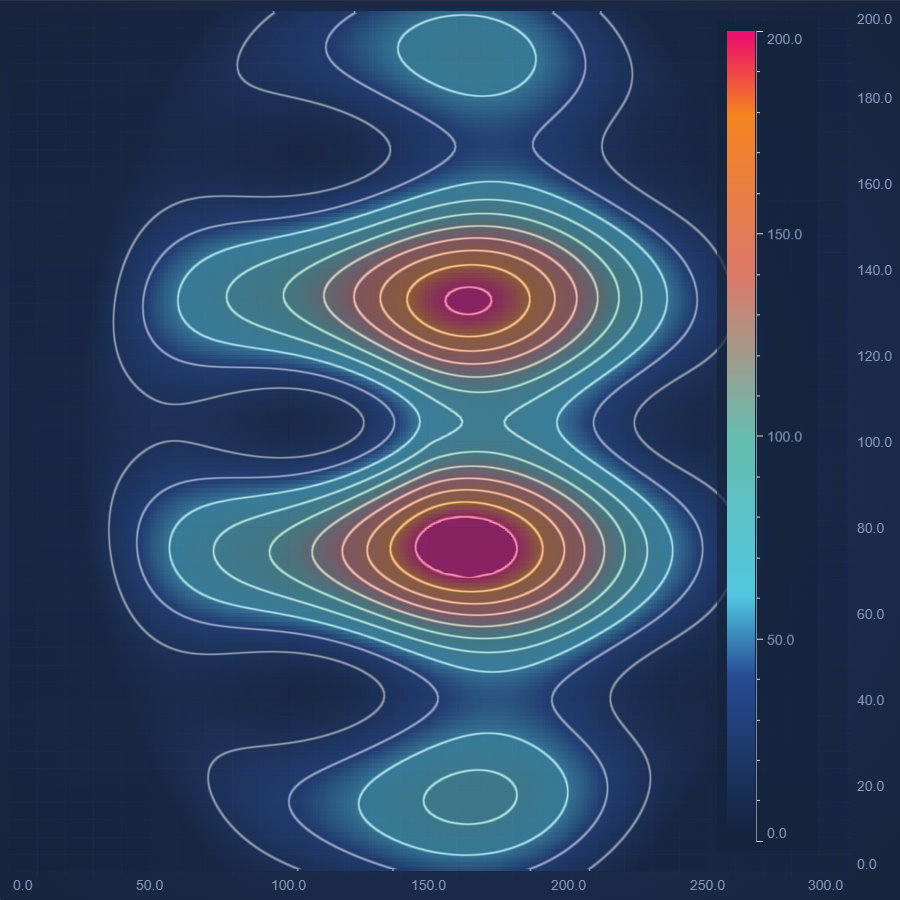
React Heatmap Chart With Contours
Design a highly dynamic React Heatmap Chart With Contours with SciChart's feature-rich JavaScript Chart Library. Get your free demo today.
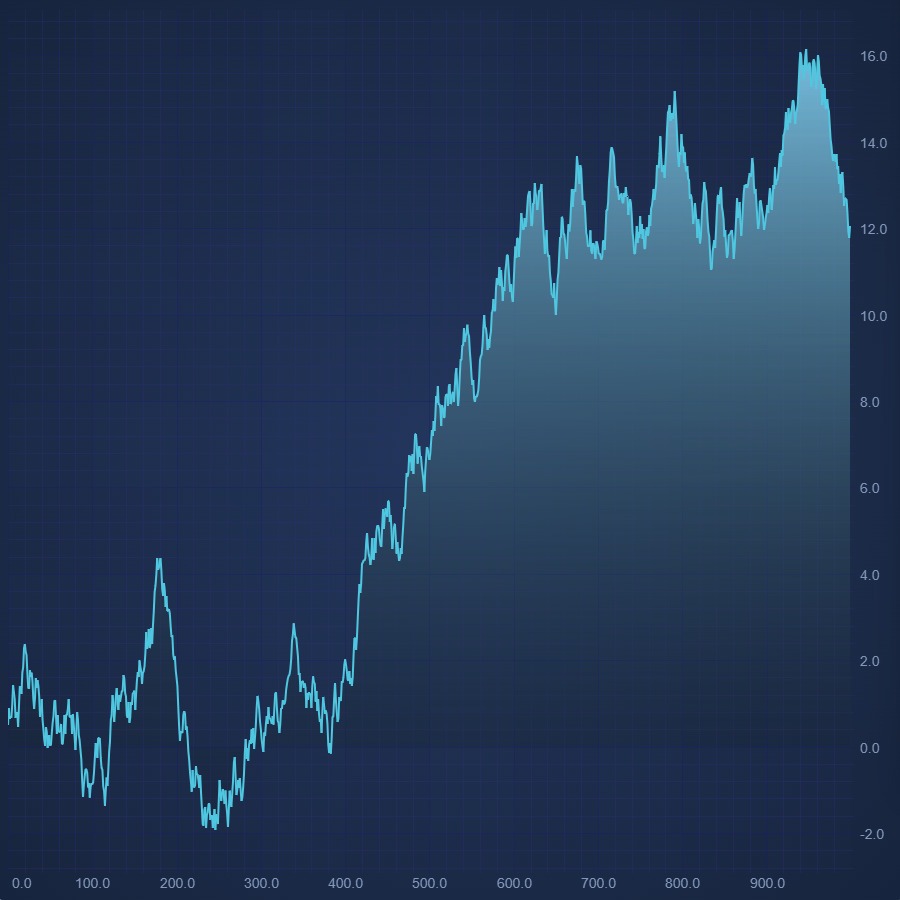
React Mountain Chart
Create React Mountain Chart with SciChart.js. Zero line can be zero or a specific value. Fill color can be solid or gradient as well. Get a free demo now.
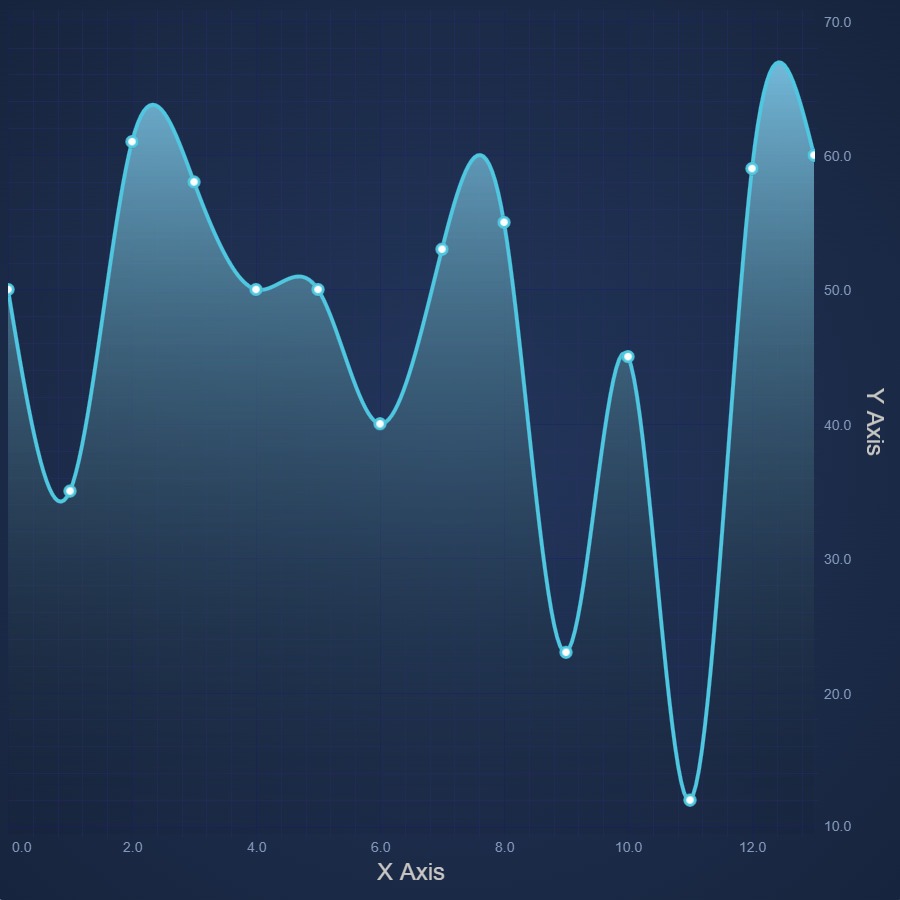
React Spline Mountain Chart
React Spline Mountain Chart design made easy. Use SciChart.js' JavaScript Charts for high performance, feature-rich designs. Get free demo now.
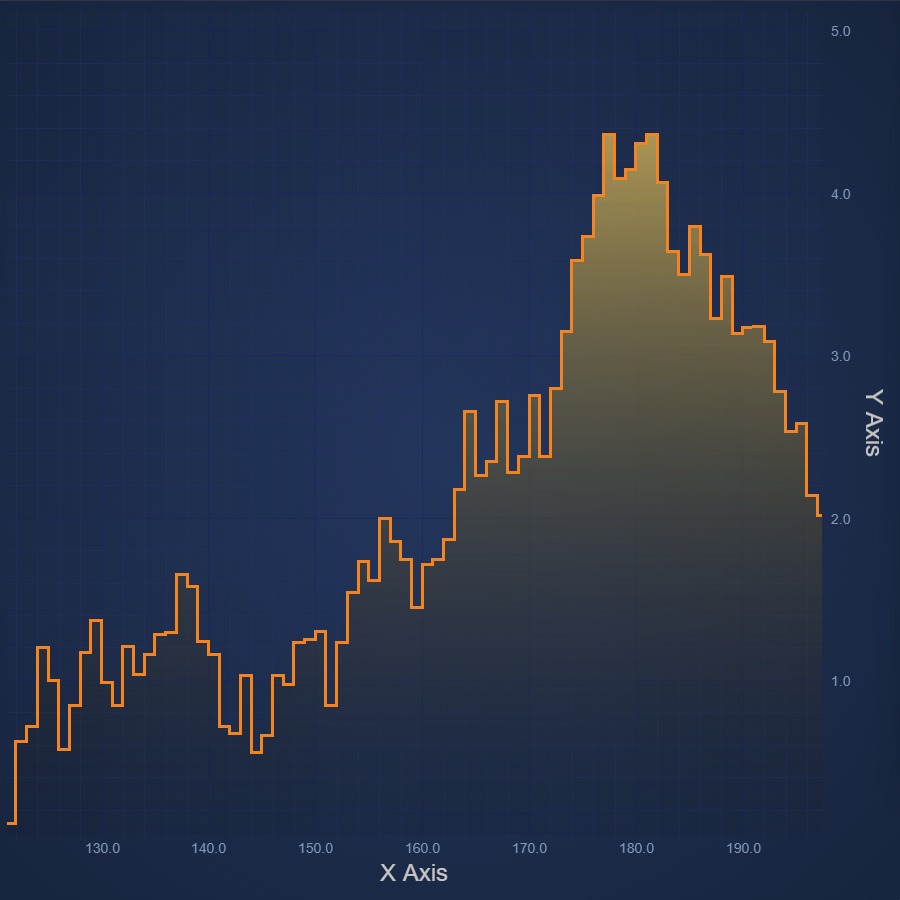
React Digital Mountain Chart
Create React Digital Mountain Chart with a stepped-line visual effect. Get your free trial of SciChart's 5-star rated JavaScript Chart Component now.
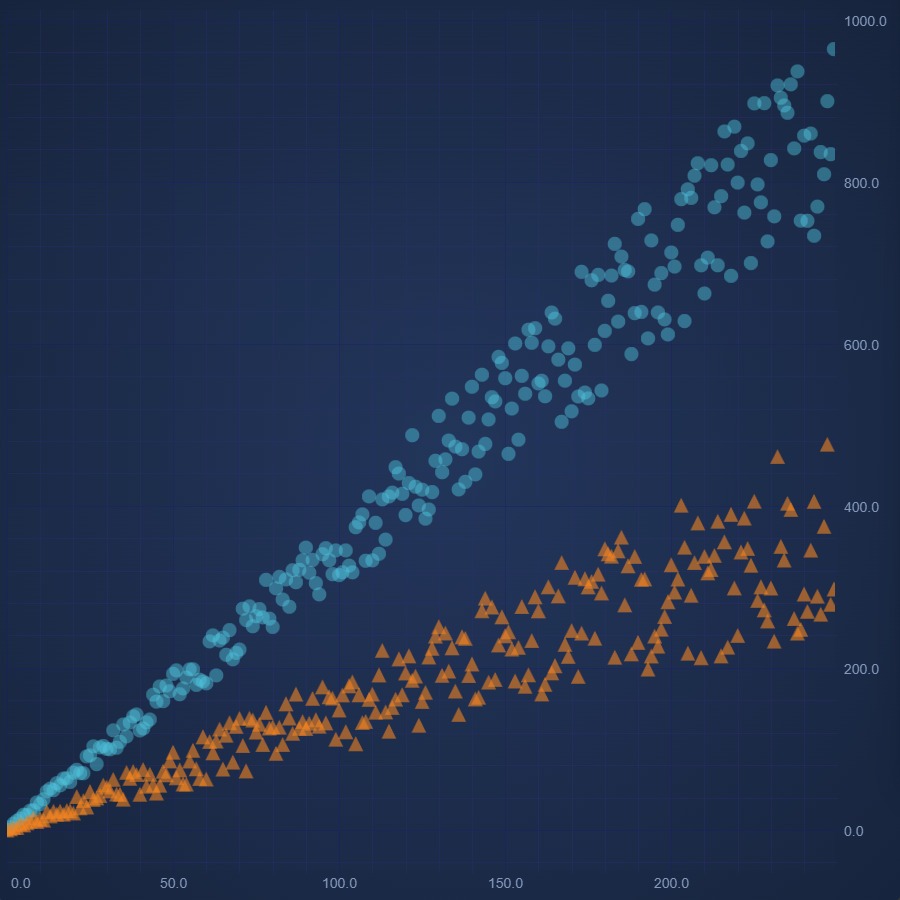
React Scatter Chart
Create React Scatter Chart with high performance SciChart.js. Easily render pre-defined point types. Supports custom shapes. Get your free trial now.
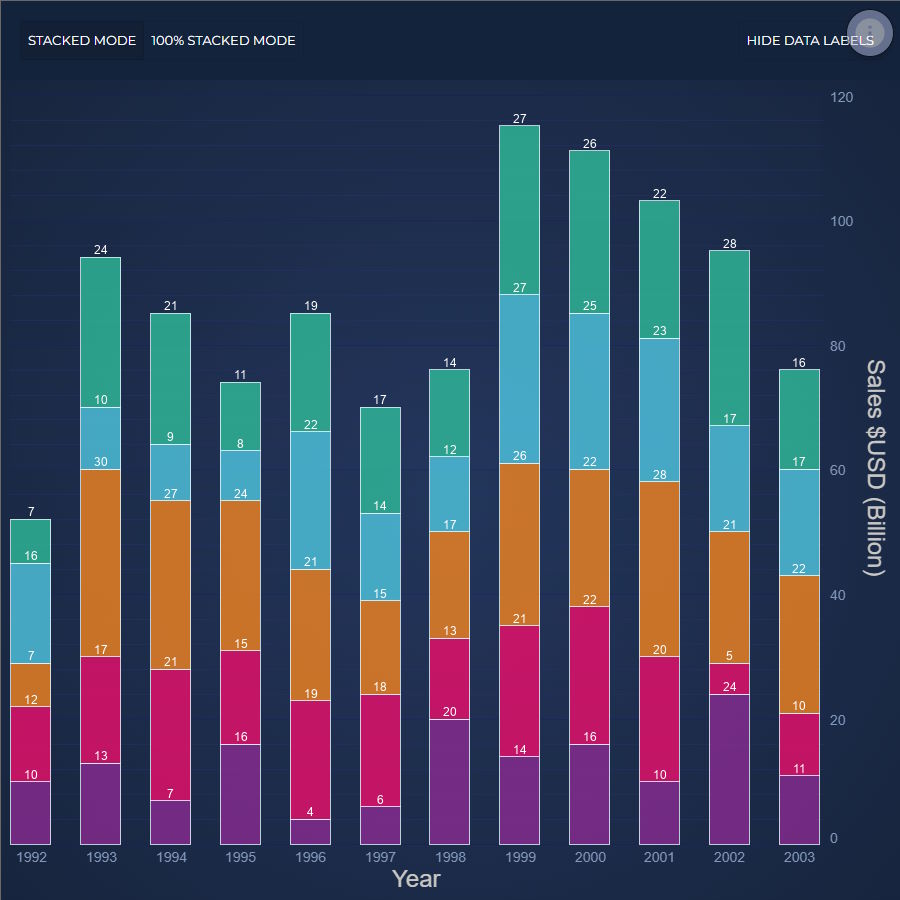
React Stacked Column Chart
Discover how to create a React Stacked Column Chart using our feature-rich JavaScript Chart Library, SciChart.js. Get your free demo today!
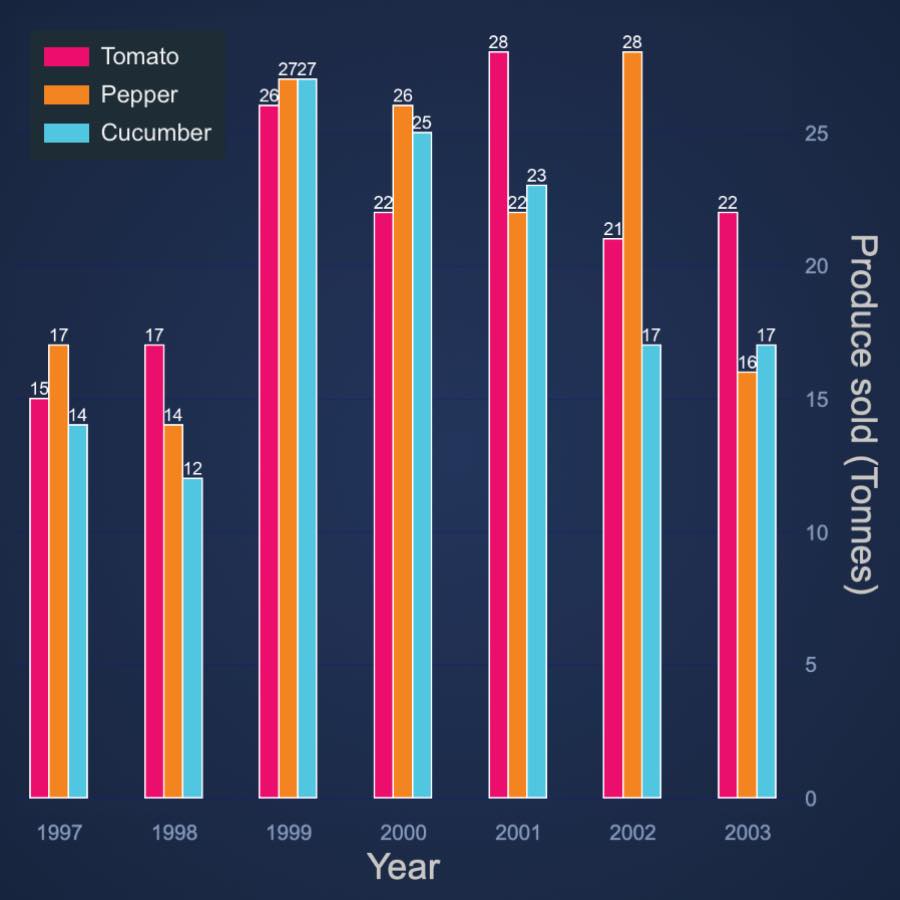
React Stacked Column Side by Side
Design React Stacked Group Column Chart side-by-side using our 5-star rated JavaScript Chart Framework, SciChart.js. Get your free demo now.
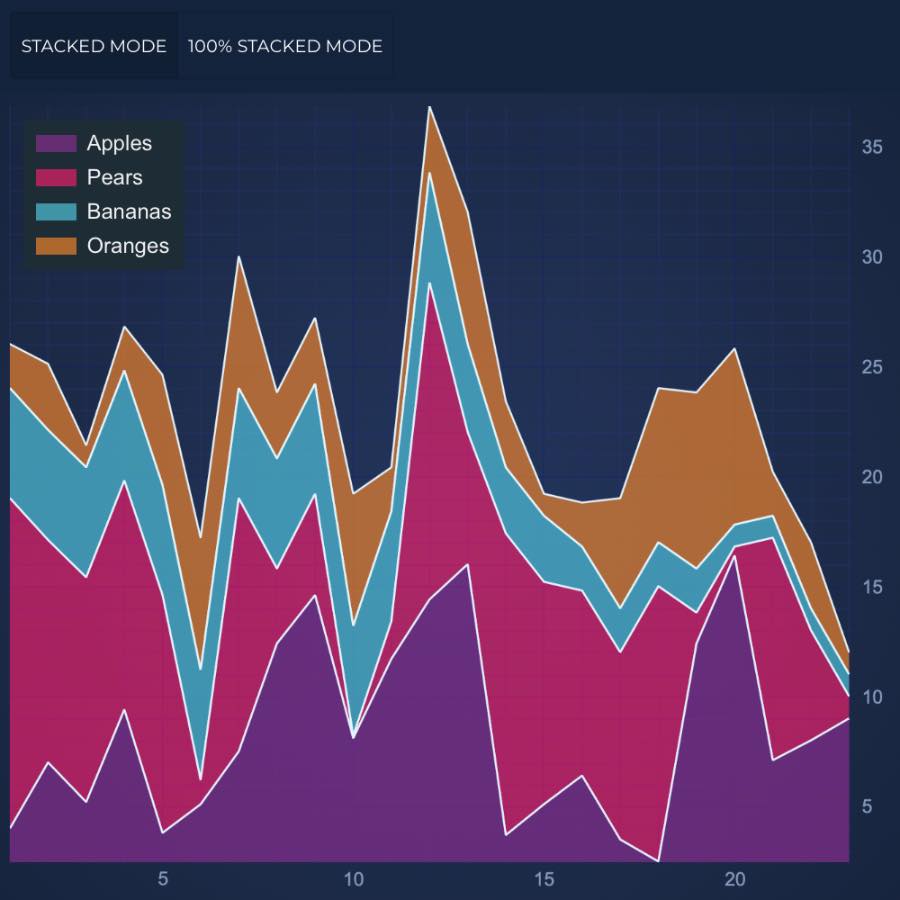
React Stacked Mountain Chart
Design a high performance React Stacked Mountain Chart with SciChart.js - your one-stop JavaScript chart library. Get free demo now to get started.
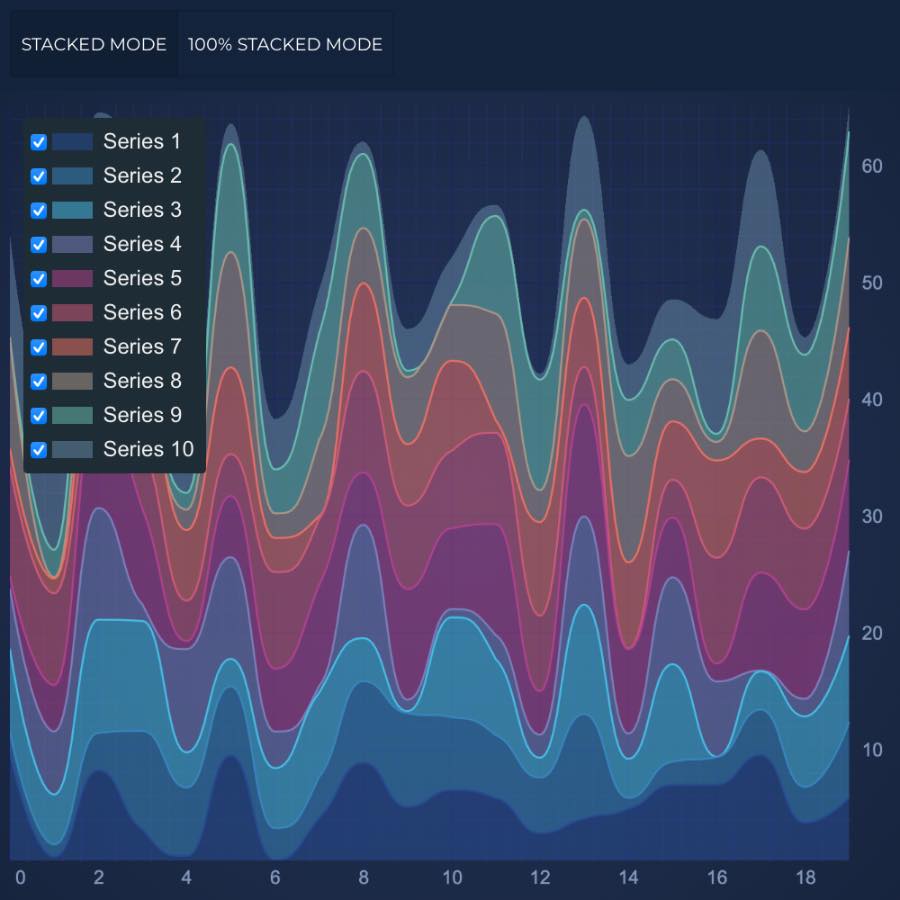
React Smooth Stacked Mountain Chart
Design a high performance React Stacked Mountain Chart with SciChart.js - your one-stop JavaScript chart library. Get free demo now to get started.
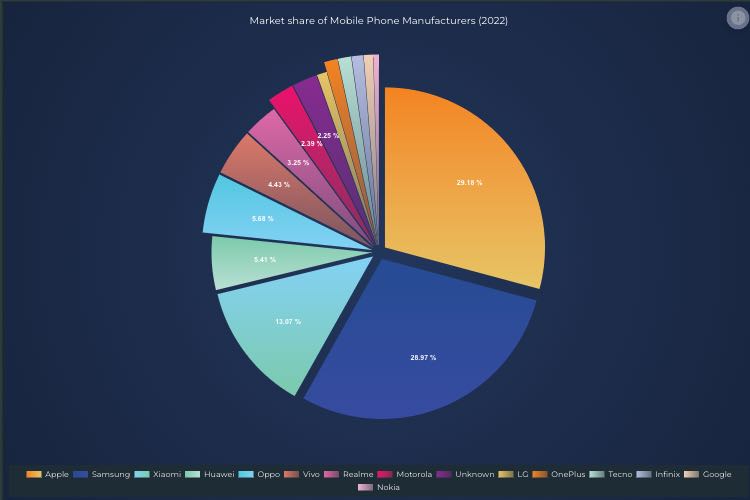
React Pie Chart
Easily create and customise a high performance React Pie Chart with 5-star rated SciChart.js. Get your free trial now to access the whole library.
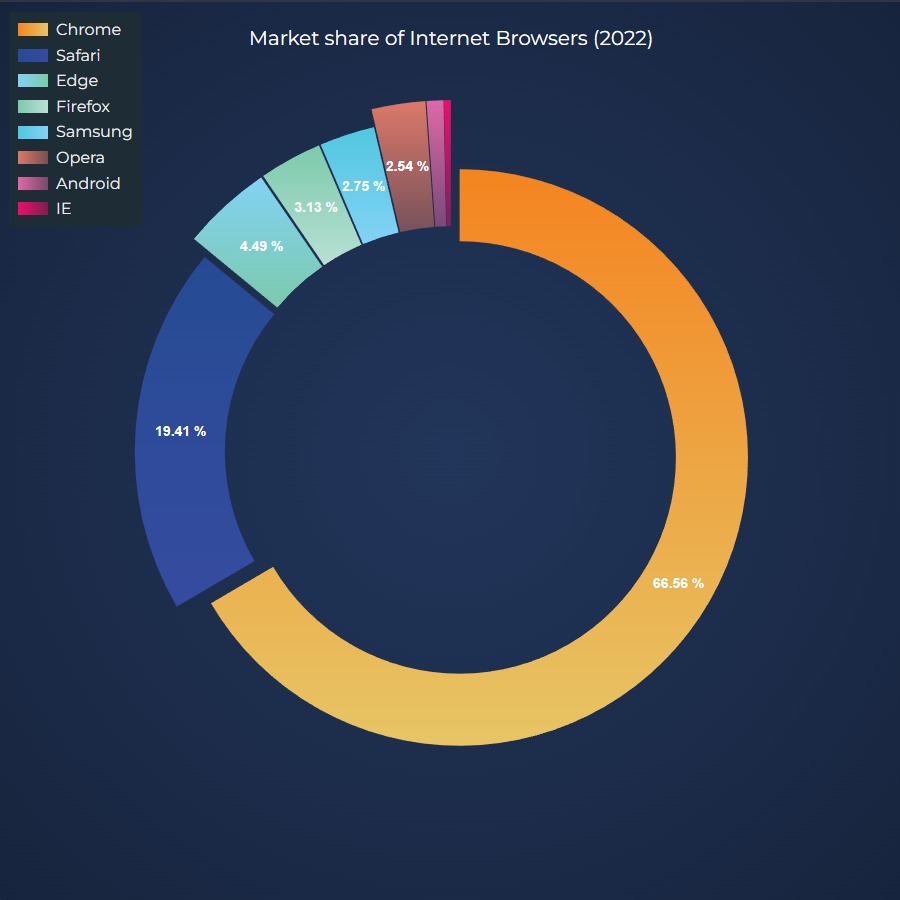
React Donut Chart
Create React Donut Chart with 5-star rated SciChart.js chart library. Supports legends, text labels, animated updates and more. Get free trial now.
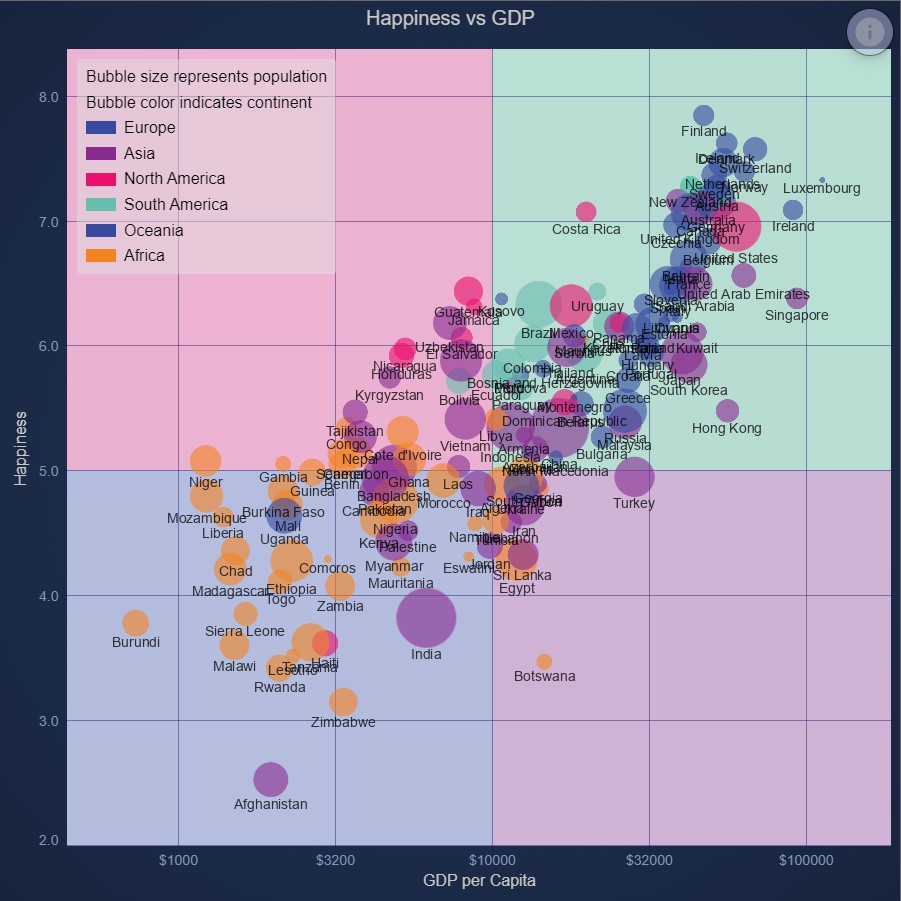
React Quadrant Chart using Background Annotations
Demonstrates how to color areas of the chart surface using background Annotations using SciChart.js Annotations API