React Population Pyramid
Population Pyramid of Europe and Africa using SciChart.js High Performance JavaScript Charts. This also demonstrates the use of DataLabelLayoutManager to Modify the positions of data labels from different series to prevent overlap
drawExample.ts
index.tsx
theme.ts
1import {
2    EAxisAlignment,
3    MouseWheelZoomModifier,
4    NumberRange,
5    NumericAxis,
6    XyDataSeries,
7    ZoomExtentsModifier,
8    SciChartSurface,
9    ENumericFormat,
10    EColumnDataLabelPosition,
11    StackedColumnRenderableSeries,
12    Thickness,
13    LegendModifier,
14    StackedColumnCollection,
15    IDataLabelLayoutManager,
16    RenderPassInfo,
17    IRenderableSeries,
18    IStackedColumnSeriesDataLabelProviderOptions,
19    BottomAlignedOuterHorizontallyStackedAxisLayoutStrategy,
20    ELegendPlacement,
21    WaveAnimation,
22} from "scichart";
23import { appTheme } from "../../../theme";
24
25// custom label manager to avoid overlapping labels
26class CustomDataLabelManager implements IDataLabelLayoutManager {
27    performTextLayout(sciChartSurface: SciChartSurface, renderPassInfo: RenderPassInfo): void {
28        const renderableSeries = sciChartSurface.renderableSeries.asArray() as IRenderableSeries[];
29
30        for (let i = 0; i < renderableSeries.length; i++) {
31            // loop through all series (i.e. 2 stacked series - Male and Female)
32
33            const currentSeries = renderableSeries[i] as StackedColumnRenderableSeries;
34            if (currentSeries instanceof StackedColumnCollection) {
35                // @ts-ignore
36                const stackedSeries: StackedColumnRenderableSeries[] = currentSeries.asArray();
37
38                const outerSeries = stackedSeries[1]; // the outer Series (i.e. Africa),
39                const innerSeries = stackedSeries[0]; // the inner Series (i.e. Europe)
40
41                if (!innerSeries.isVisible) {
42                    continue; // to NOT use accumulated value to outer series if inner series is hidden
43                }
44
45                const outerLabels = outerSeries.dataLabelProvider?.dataLabels || [];
46                const innerLabels = innerSeries.dataLabelProvider?.dataLabels || [];
47
48                let outerIndex = 0; // used to sync the outer labels with the inner labels
49
50                for (let k = 0; k < innerLabels.length; k++) {
51                    const outerLabel = outerLabels[outerIndex];
52                    const innerLabel = innerLabels[k];
53
54                    if (outerLabel && innerLabel) {
55                        const outerLabelPosition = outerLabel.position;
56                        const innerLabelPosition = innerLabel.position;
57
58                        if (outerLabelPosition.y !== innerLabelPosition.y) {
59                            continue; // do not align labels if they are not on the same level
60                        }
61
62                        outerIndex++;
63
64                        // calculate threshold for overlapping
65                        const limitWidth = i == 0 ? outerLabel.rect.width : innerLabel.rect.width;
66
67                        // minimum margin between 2 labels, feel free to experiment with different values
68                        const marginBetweenLabels = 12;
69
70                        if (Math.abs(outerLabelPosition.x - innerLabelPosition.x) < limitWidth) {
71                            let newX;
72                            if (i == 0) {
73                                // if we are in Male (left) chart, draw left
74                                newX = innerLabel.position.x - outerLabel.rect.width - marginBetweenLabels;
75                            } else {
76                                // if we are in Female (right) chart, draw right
77                                newX = innerLabel.rect.right + marginBetweenLabels;
78                            }
79
80                            outerLabel.position = {
81                                x: newX,
82                                y: outerLabel.position.y,
83                            };
84                        }
85                    }
86                }
87            }
88        }
89    }
90}
91
92// Population Pyramid Data
93const PopulationData = {
94    xValues: [0, 5, 10, 15, 20, 25, 30, 35, 40, 45, 50, 55, 60, 65, 70, 75, 80, 85, 90, 95, 100],
95    yValues: {
96        Africa: {
97            male: [
98                35754890, 31813896, 28672207, 24967595, 20935790, 17178324, 14422055, 12271907, 10608417, 8608183,
99                6579937, 5035598, 3832420, 2738448, 1769284, 1013988, 470834, 144795, 26494, 2652, 140,
100            ],
101            female: [
102                34834623, 31000760, 27861135, 24206021, 20338468, 16815440, 14207659, 12167437, 10585531, 8658614,
103                6721555, 5291815, 4176910, 3076943, 2039952, 1199203, 591092, 203922, 45501, 5961, 425,
104            ],
105        },
106        Europe: {
107            male: [
108                4869936, 5186991, 5275063, 5286053, 5449038, 5752398, 6168124, 6375035, 6265554, 5900833, 6465830,
109                7108184, 6769524, 5676968, 4828153, 3734266, 2732054, 1633630, 587324, 128003, 12023,
110            ],
111            female: [
112                4641147, 4940521, 5010242, 5010526, 5160160, 5501673, 6022599, 6329356, 6299693, 5930345, 6509757,
113                7178487, 7011569, 6157651, 5547296, 4519433, 3704145, 2671974, 1276597, 399148, 60035,
114            ],
115        },
116    },
117};
118
119export const drawExample = async (rootElement: string | HTMLDivElement) => {
120    const { sciChartSurface, wasmContext } = await SciChartSurface.create(rootElement, {
121        theme: appTheme.SciChartJsTheme,
122    });
123
124    // Create XAxis, and the 2 YAxes
125    const xAxis = new NumericAxis(wasmContext, {
126        labelPrecision: 0,
127        autoTicks: false,
128        majorDelta: 5,
129        flippedCoordinates: true,
130        axisAlignment: EAxisAlignment.Left,
131        axisTitle: "Age",
132    });
133
134    // Force the visible range to always be a fixed value, overriding any zoom behaviour
135    xAxis.visibleRangeChanged.subscribe(() => {
136        xAxis.visibleRange = new NumberRange(-3, 103); // +-3 for extra padding
137    });
138
139    // 2 Y Axes (left and right)
140    const yAxisRight = new NumericAxis(wasmContext, {
141        axisAlignment: EAxisAlignment.Bottom,
142        flippedCoordinates: true,
143        axisTitle: "Female",
144        labelStyle: {
145            fontSize: 12,
146        },
147        growBy: new NumberRange(0, 0.15), // to have the furthest right labels visible
148        labelFormat: ENumericFormat.Engineering,
149        id: "femaleAxis",
150    });
151
152    // Sync the visible range of the 2 Y axes
153    yAxisRight.visibleRangeChanged.subscribe((args: any) => {
154        if (args.visibleRange.min > 0) {
155            yAxisRight.visibleRange = new NumberRange(0, args.visibleRange.max);
156        }
157        yAxisLeft.visibleRange = new NumberRange(0, args.visibleRange.max);
158    });
159
160    const yAxisLeft = new NumericAxis(wasmContext, {
161        axisAlignment: EAxisAlignment.Bottom,
162        axisTitle: "Male",
163        labelStyle: {
164            fontSize: 12,
165        },
166        growBy: new NumberRange(0, 0.15), // to have the furthest left labels visible
167        labelFormat: ENumericFormat.Engineering,
168        id: "maleAxis",
169    });
170
171    // Sync the visible range of the 2 Y axes
172    yAxisLeft.visibleRangeChanged.subscribe((args: any) => {
173        if (args.visibleRange.min > 0) {
174            yAxisLeft.visibleRange = new NumberRange(0, args.visibleRange.max);
175        }
176        yAxisRight.visibleRange = new NumberRange(0, args.visibleRange.max);
177    });
178
179    sciChartSurface.xAxes.add(xAxis);
180    sciChartSurface.yAxes.add(yAxisLeft, yAxisRight);
181
182    const dataLabels: IStackedColumnSeriesDataLabelProviderOptions = {
183        positionMode: EColumnDataLabelPosition.Outside,
184        style: {
185            fontFamily: "Arial",
186            fontSize: 12,
187            padding: new Thickness(0, 3, 0, 3),
188        },
189        color: "#EEEEEE",
190        numericFormat: ENumericFormat.Engineering,
191    };
192
193    // Create some RenderableSeries or each part of the stacked column
194    const maleChartEurope = new StackedColumnRenderableSeries(wasmContext, {
195        dataSeries: new XyDataSeries(wasmContext, {
196            xValues: PopulationData.xValues,
197            yValues: PopulationData.yValues.Europe.male,
198            dataSeriesName: "Male Europe",
199        }),
200        fill: appTheme.VividBlue + "99",
201        stackedGroupId: "MaleSeries",
202        dataLabels,
203    });
204
205    const maleChartAfrica = new StackedColumnRenderableSeries(wasmContext, {
206        dataSeries: new XyDataSeries(wasmContext, {
207            xValues: PopulationData.xValues,
208            yValues: PopulationData.yValues.Africa.male,
209            dataSeriesName: "Male Africa",
210        }),
211        fill: appTheme.VividBlue,
212        stackedGroupId: "MaleSeries",
213        dataLabels,
214    });
215
216    // female charts
217    const femaleChartEurope = new StackedColumnRenderableSeries(wasmContext, {
218        dataSeries: new XyDataSeries(wasmContext, {
219            xValues: PopulationData.xValues,
220            yValues: PopulationData.yValues.Europe.female,
221            dataSeriesName: "Female Europe",
222        }),
223        fill: appTheme.VividRed + "99",
224        stackedGroupId: "FemaleSeries",
225        dataLabels,
226    });
227
228    const femaleChartAfrica = new StackedColumnRenderableSeries(wasmContext, {
229        dataSeries: new XyDataSeries(wasmContext, {
230            xValues: PopulationData.xValues,
231            yValues: PopulationData.yValues.Africa.female,
232            dataSeriesName: "Female Africa",
233        }),
234        fill: appTheme.VividRed,
235        stackedGroupId: "FemaleSeries",
236        dataLabels,
237    });
238
239    const stackedColumnCollectionMale = new StackedColumnCollection(wasmContext, {
240        dataPointWidth: 0.9,
241        yAxisId: "maleAxis",
242    });
243    const stackedColumnCollectionFemale = new StackedColumnCollection(wasmContext, {
244        dataPointWidth: 0.9,
245        yAxisId: "femaleAxis",
246    });
247
248    stackedColumnCollectionMale.add(maleChartEurope, maleChartAfrica);
249    stackedColumnCollectionFemale.add(femaleChartEurope, femaleChartAfrica);
250
251    // add wave animation to the series
252    stackedColumnCollectionMale.animation = new WaveAnimation({ duration: 1000 });
253    stackedColumnCollectionFemale.animation = new WaveAnimation({ duration: 1000 });
254
255    // manage data labels overlapping with custom layout manager
256    sciChartSurface.dataLabelLayoutManager = new CustomDataLabelManager();
257
258    // Add the Stacked Column collection to the chart
259    sciChartSurface.renderableSeries.add(stackedColumnCollectionMale, stackedColumnCollectionFemale);
260
261    sciChartSurface.layoutManager.bottomOuterAxesLayoutStrategy =
262        new BottomAlignedOuterHorizontallyStackedAxisLayoutStrategy(); // stack and sync the 2 Y axes
263
264    const maleLegend = new LegendModifier({
265        showCheckboxes: true,
266        showSeriesMarkers: true,
267        showLegend: true,
268        backgroundColor: "#222",
269        placement: ELegendPlacement.TopLeft,
270    });
271
272    const femaleLegend = new LegendModifier({
273        showCheckboxes: true,
274        showSeriesMarkers: true,
275        showLegend: true,
276        backgroundColor: "#222",
277        placement: ELegendPlacement.TopRight,
278    });
279
280    // Add zooming and panning behaviour
281    sciChartSurface.chartModifiers.add(
282        new ZoomExtentsModifier(),
283        new MouseWheelZoomModifier(),
284        maleLegend,
285        femaleLegend
286    );
287
288    // exclude Male series for the Female legend
289    femaleLegend.includeSeries(maleChartEurope, false);
290    femaleLegend.includeSeries(maleChartAfrica, false);
291
292    // exclude Female series for the Male legend
293    maleLegend.includeSeries(femaleChartEurope, false);
294    maleLegend.includeSeries(femaleChartAfrica, false);
295
296    sciChartSurface.zoomExtents();
297
298    return { sciChartSurface, wasmContext };
299};
300
See Also: Performance Demos & Showcases (11 Demos)
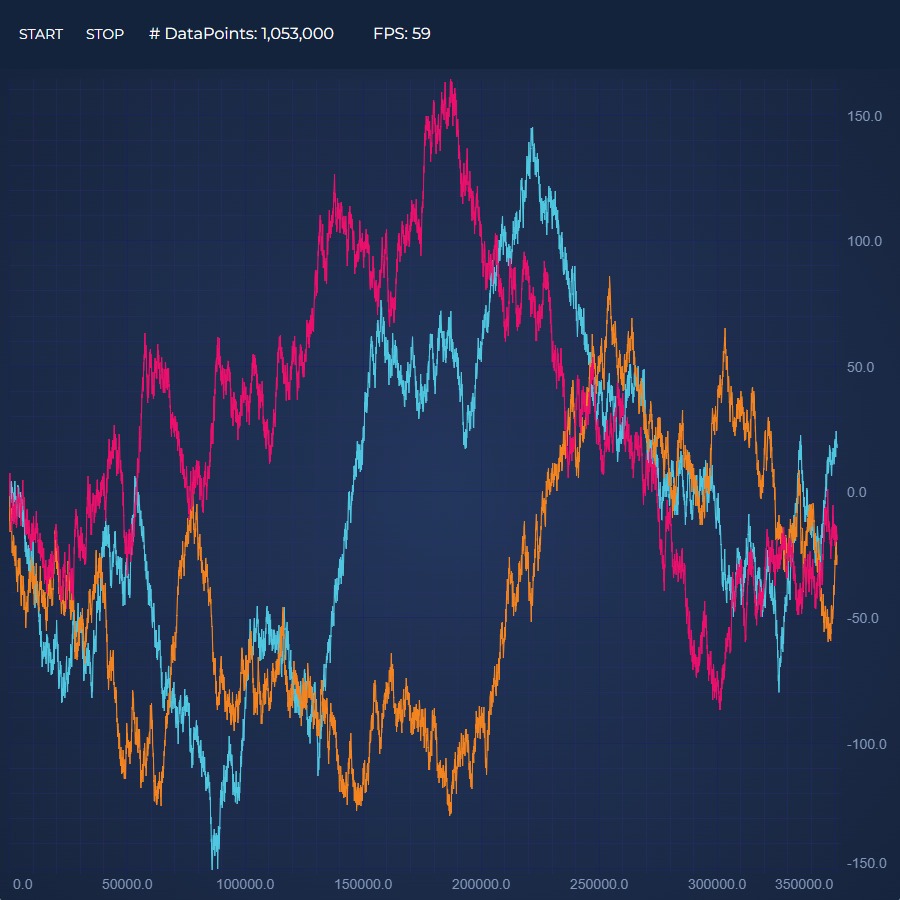
Realtime React Chart Performance Demo
This demo showcases the incredible realtime performance of our React charts by updating the series with millions of data-points!

Load 500 Series x 500 Points Performance Demo
This demo showcases the incredible performance of our React Chart by loading 500 series with 500 points (250k points) instantly!
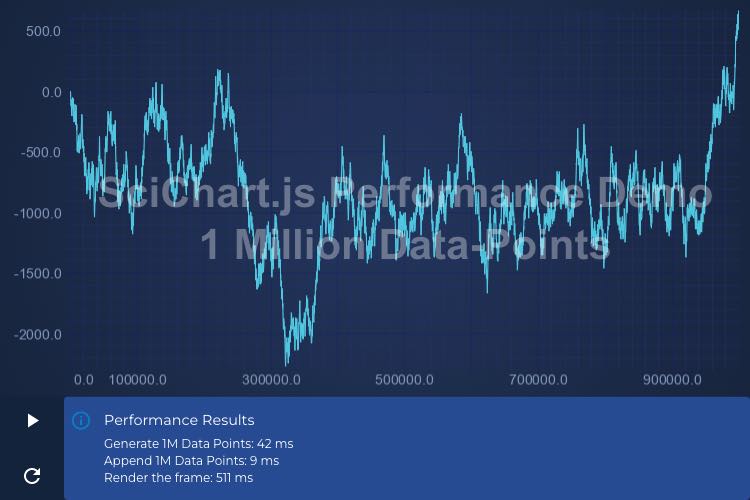
Load 1 Million Points Performance Demo
This demo showcases the incredible performance of our JavaScript Chart by loading a million points instantly.
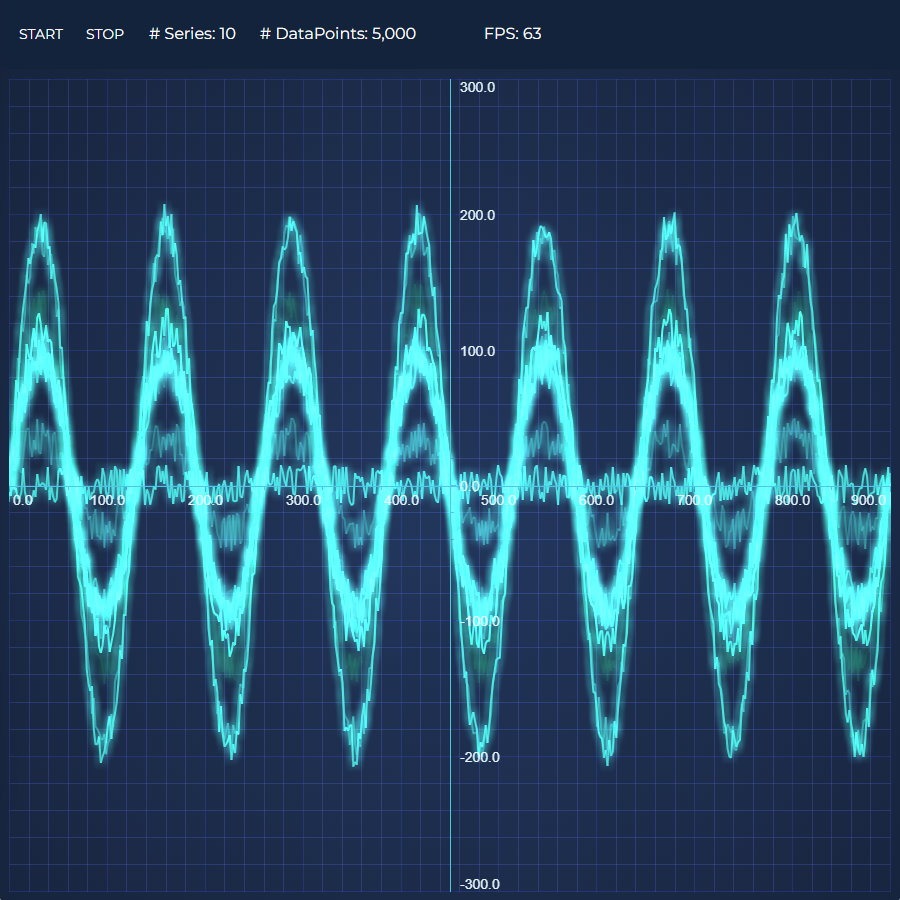
Realtime Ghosted Traces
This demo showcases the realtime performance of our React Chart by animating several series with thousands of data-points at 60 FPS

Realtime Audio Analyzer Demo
Demonstrating the capability of SciChart.js to create a JavaScript Audio Analyzer and visualize the Fourier-Transform of an audio waveform in realtime.
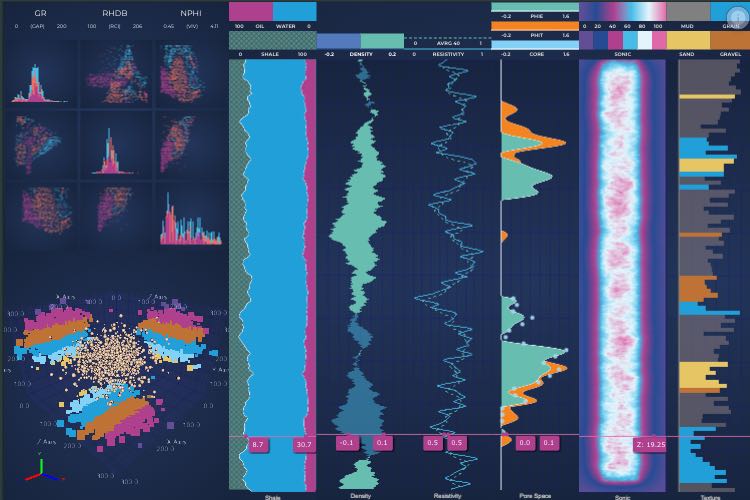
Oil & Gas Explorer React Dashboard
Demonstrates how to create Oil and Gas Dashboard
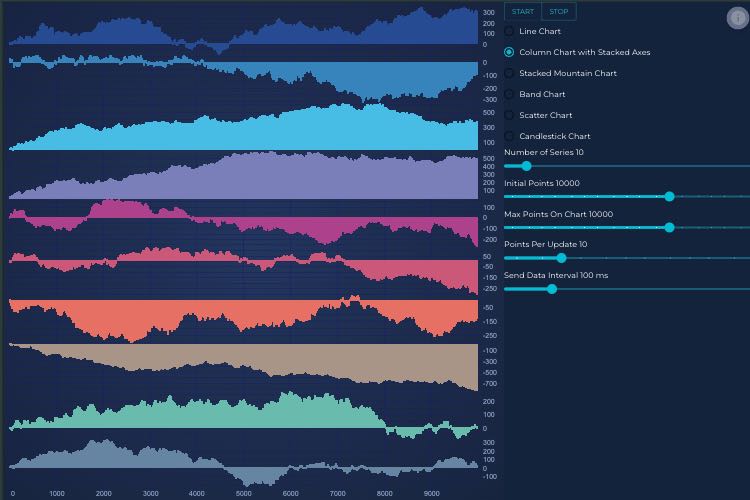
Client/Server Websocket Data Streaming
This demo showcases the incredible realtime performance of our JavaScript charts by updating the series with millions of data-points!
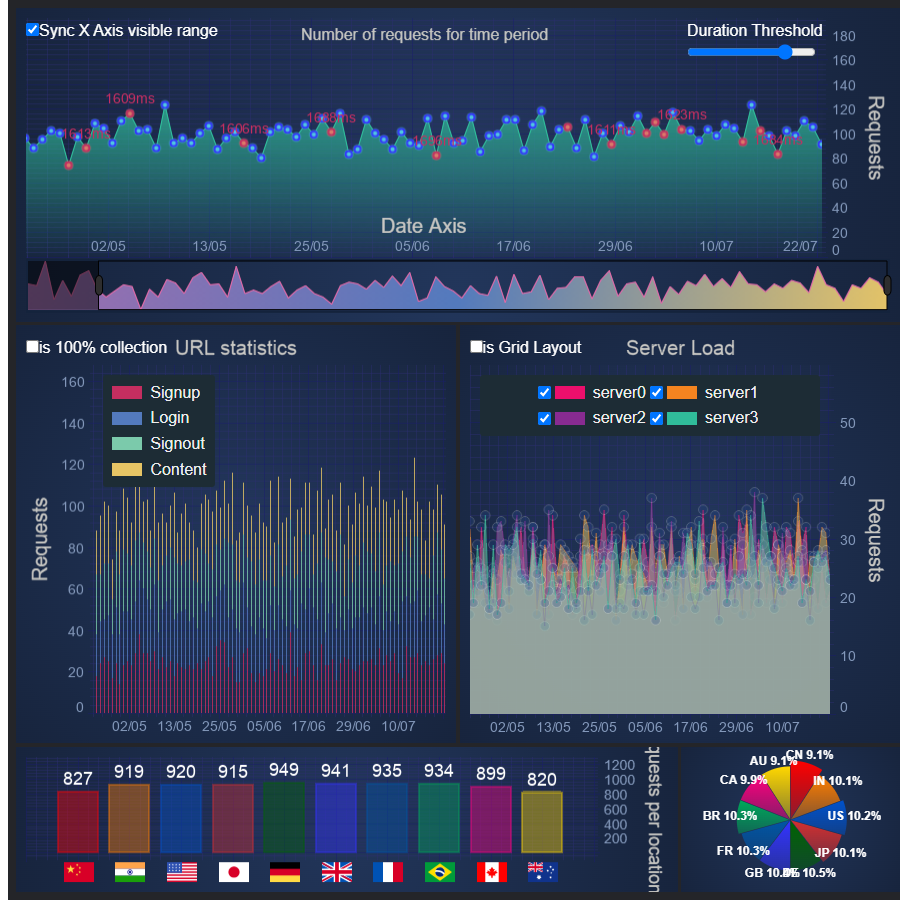
Server Traffic Dashboard
This dashboard demo showcases the incredible realtime performance of our React charts by updating the series with millions of data-points!
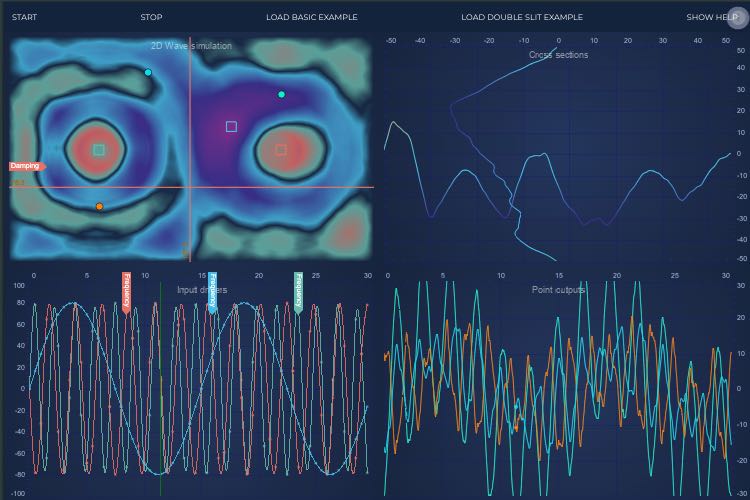
Rich Interactions Showcase
This demo showcases the incredible realtime performance of our React charts by updating the series with millions of data-points!
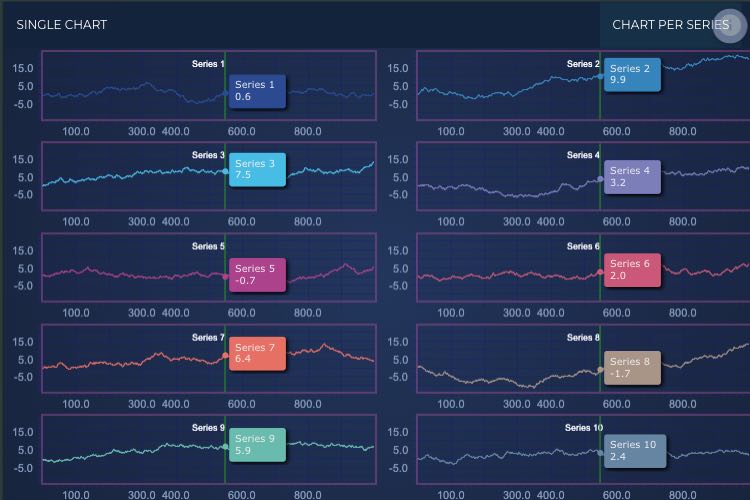
Dynamic Layout Showcase
Demonstrates a custom modifier which can convert from single chart to grid layout and back.
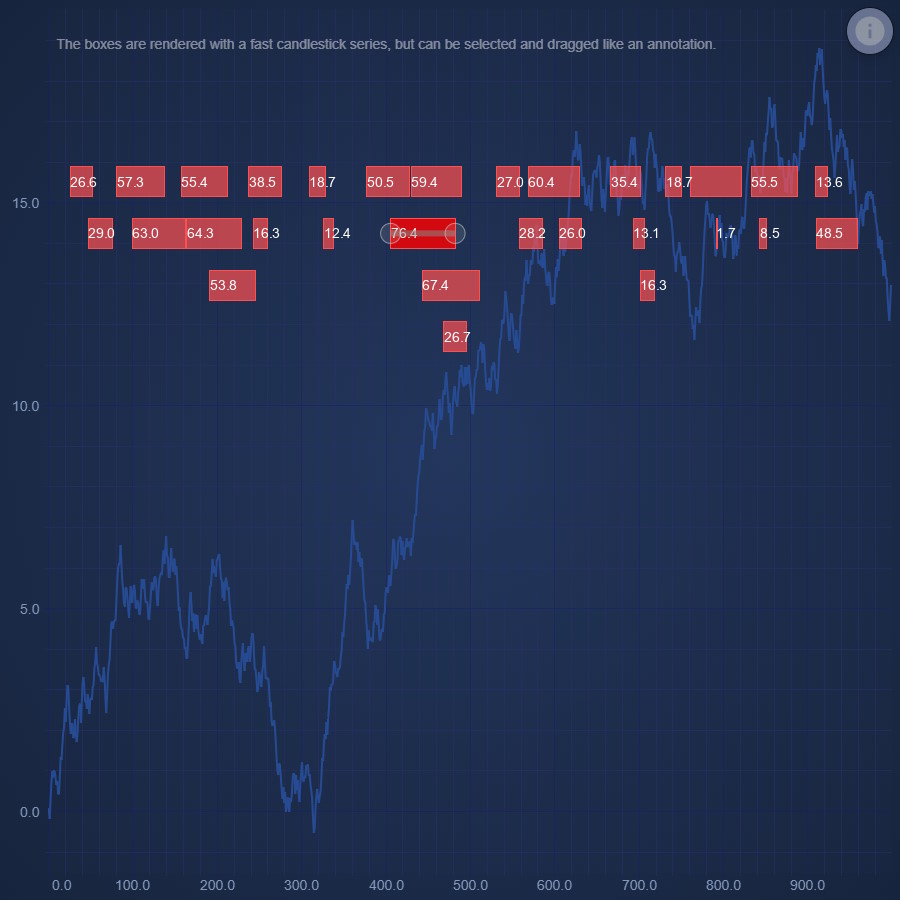
Dragabble Event Markers
Demonstrates how to repurpose a Candlestick Series into dragabble, labled, event markers