Oil & Gas Explorer React Dashboard
This is an example of the kind of complex, multi-chart dashboards used in the oil and gas industry.
index.tsx
ChartGroupLoader.tsx
3d.ts
chartUtils.ts
DensityChart.ts
eighth.ts
fifth.ts
first.ts
fourth.ts
ninth.ts
OIlGasStyles.css
PoreSpaceChart.ts
RangeFillPaletteProvider.ts
ResistivityChart.ts
second.ts
seventh.ts
ShaleChart.ts
sixth.ts
SonicChart.ts
TextureChart.ts
theme.ts
third.ts
vChartUtils.ts
Copy to clipboard
Minimise
Fullscreen
1import { ThemeProvider } from "scichart/Charting/Themes/IThemeProvider";
2import { SciChartJSDarkv2Theme } from "scichart/Charting/Themes/SciChartJSDarkv2Theme";
3import { SciChartJSLightTheme } from "scichart/Charting/Themes/SciChartJSLightTheme";
4import { SciChartJsNavyTheme } from "scichart/Charting/Themes/SciChartJsNavyTheme";
5
6export interface AppThemeBase {
7    SciChartJsTheme: ThemeProvider;
8
9    // General colours
10    LegendTextColor: string;
11    SidebarBackground: string;
12    SidebarTextColor: string;
13
14    // Charts grid colours
15    ChartsGridStroke1: string;
16    ChartsGridStroke2: string;
17    ChartsGridStroke3: string;
18
19    // 3D Chart colors
20    Chart3DScatterFill: string;
21    Chart3DColor1: string;
22    Chart3DColor2: string;
23    Chart3DColor3: string;
24    Chart3DColor4: string;
25    Chart3DColor5: string;
26    Chart3DColor6: string;
27    Chart3DColor7: string;
28
29    // Shale chart
30    ShaleBackgroundColor: string;
31    ShaleOilLegendColor: string;
32    ShaleWaterLegendColor: string;
33    ShaleWaterSeries: string;
34    ShaleSeriesStroke: string;
35
36    // Density chart
37    DensityLegendSeparator: string;
38    DensityBackgroundOne: string;
39    DensityBackgroundTwo: string;
40    DensityStrokeY: string;
41    DensityStrokeY1: string;
42    DensityFillY: string;
43    DensityFillY1: string;
44
45    // Resistivity Chart
46    ResistivityLineStroke: string;
47    ResistivityLineStroke2: string;
48
49    // Pore Space Chart
50    PoreSpaceStroke1: string;
51    PoreSpaceStroke2: string;
52    PoreSpacePhieFill: string;
53    PoreSpacePhitFill: string;
54    PoreSpaceScatterStroke: string;
55    PoreSpaceScatterFill: string;
56
57    // Sonic vertical
58    SonicGradient1: string;
59    SonicGradient2: string;
60    SonicGradient3: string;
61    SonicGradient4: string;
62    SonicGradient5: string;
63    SonicGradient6: string;
64
65    // Texture chart
66    TextureFill: string;
67    TextureLine: string;
68    TextureSandFill: string;
69    TextureGrainFill: string;
70    TextureGravelFill: string;
71    RolloverLineColor: string;
72    RolloverTooltipFill: string;
73    RolloverTooltipText: string;
74}
75
76// @ts-ignore
77export class App2022BrandTheme implements AppThemeBase {
78    SciChartJsTheme = new SciChartJsNavyTheme();
79
80    // general colours
81    LegendTextColor = "LightGray";
82    SidebarBackground = this.SciChartJsTheme.sciChartBackground;
83    SidebarTextColor = "#FFF";
84
85    // Charts grid colours
86    ChartsGridStroke1 = "#AE408E";
87    ChartsGridStroke2 = "#EA6F63";
88    ChartsGridStroke3 = "#45BEE8";
89
90    // 3D Chart colors
91    Chart3DScatterFill = "#F1CFB5";
92    Chart3DColor1 = "#28266D";
93    Chart3DColor2 = "#E7C565";
94    Chart3DColor3 = "#83D2F5";
95    Chart3DColor4 = "#209FD9";
96    Chart3DColor5 = "#BE7336";
97    Chart3DColor6 = "#AE408E";
98    Chart3DColor7 = "#634E97";
99
100    // Shale chart
101    ShaleBackgroundColor = "#67BDAFAA";
102    ShaleOilLegendColor = "#AE408E";
103    ShaleWaterLegendColor = "#209FD9";
104    ShaleWaterSeries = "#209FD9";
105    ShaleSeriesStroke = "#E4F5FC";
106
107    // Density chart
108    DensityLegendSeparator = "#264B93";
109    DensityBackgroundOne = "#537ABD";
110    DensityBackgroundTwo = "#67BDAF";
111    DensityStrokeY = "#45BEE8";
112    DensityStrokeY1 = "#AE408E";
113    DensityFillY = "#45BEE877";
114    DensityFillY1 = "#67BDAF";
115
116    // Resistivity Chart
117    ResistivityLineStroke = "#45BEE8";
118    ResistivityLineStroke2 = "#67BDAF";
119
120    // Pore Space Chart
121    PoreSpaceStroke1 = "#E4F5FC";
122    PoreSpaceStroke2 = "#F1CFB5";
123    PoreSpacePhieFill = "#67BDAF";
124    PoreSpacePhitFill = "#F48420";
125    PoreSpaceScatterStroke = "#FFF";
126    PoreSpaceScatterFill = "#83D2F5";
127
128    // Sonic vertical
129    SonicGradient1 = "#634E97";
130    SonicGradient2 = "#264B93";
131    SonicGradient3 = "#AE408E";
132    SonicGradient4 = "#45BEE8";
133    SonicGradient5 = "#E4F5FC";
134    SonicGradient6 = "#DF69A8";
135
136    // Texture chart
137    TextureFill = "#90808080";
138    TextureLine = "#808080";
139    TextureSandFill = "#E7C565";
140    TextureGrainFill = "#209FD9";
141    TextureGravelFill = "#BE7336";
142
143    // Cursors
144    RolloverLineColor = "#DF69A8";
145    RolloverTooltipFill = "#AE408E";
146    RolloverTooltipText = "#FFF";
147}
148
149// tslint:disable-next-line:max-classes-per-file
150export class AppDarkTheme implements AppThemeBase {
151    SciChartJsTheme = new SciChartJSDarkv2Theme();
152
153    // general colours
154    LegendTextColor = "LightGray";
155    SidebarBackground = this.SciChartJsTheme.sciChartBackground;
156    SidebarTextColor = "#FFF";
157
158    // Charts grid colours
159    ChartsGridStroke1 = "#d52aa7";
160    ChartsGridStroke2 = "#2bd452";
161    ChartsGridStroke3 = "#916eeb";
162
163    // 3D Chart colors
164    Chart3DScatterFill = "#a88d32";
165    Chart3DColor1 = "#0a0aae";
166    Chart3DColor2 = "#2964ba";
167    Chart3DColor3 = "#36e15a";
168    Chart3DColor4 = "#f7e24d";
169    Chart3DColor5 = "#b8e946";
170    Chart3DColor6 = "#dd8037";
171    Chart3DColor7 = "#a81d09";
172
173    // Shale chart
174    ShaleBackgroundColor = "#90EE90";
175    ShaleOilLegendColor = "#b22222";
176    ShaleWaterLegendColor = "#3333FF";
177    ShaleWaterSeries = "#E4E840";
178    ShaleSeriesStroke = "#474747";
179
180    // Density chart
181    DensityLegendSeparator = "#FF3333";
182    DensityBackgroundOne = "#228B22";
183    DensityBackgroundTwo = "#FFA500";
184    DensityStrokeY = "#1C1C1E";
185    DensityStrokeY1 = "#FF3333";
186    DensityFillY = "#228B22";
187    DensityFillY1 = "#FFA500";
188
189    // Resistivity Chart
190    ResistivityLineStroke = "#00BFFF";
191    ResistivityLineStroke2 = "#FF4500";
192
193    // Pore Space Chart
194    PoreSpaceStroke1 = "#4682B4";
195    PoreSpaceStroke2 = "#757000";
196    PoreSpacePhieFill = "#4682B490";
197    PoreSpacePhitFill = "#75700090";
198    PoreSpaceScatterStroke = "#FFF";
199    PoreSpaceScatterFill = "#005A9C";
200
201    // Sonic vertical
202    SonicGradient1 = "#00008B";
203    SonicGradient2 = "#3333FF";
204    SonicGradient3 = "#228B22";
205    SonicGradient4 = "#DFFF00";
206    SonicGradient5 = "#FFFF00";
207    SonicGradient6 = "#FF3333";
208
209    // Texture chart
210    TextureFill = "#90808080";
211    TextureLine = "#808080";
212    TextureSandFill = "#DAA520";
213    TextureGrainFill = "#008b8b";
214    TextureGravelFill = "#33FF33";
215
216    // Cursors
217    RolloverLineColor = "#AE408E";
218    RolloverTooltipFill = "#AE408E";
219    RolloverTooltipText = "#FFF";
220}
221
222// tslint:disable-next-line:max-classes-per-file
223export class AppLightTheme implements AppThemeBase {
224    SciChartJsTheme = new SciChartJSLightTheme();
225
226    // general colours
227    LegendTextColor = "#222";
228    SidebarBackground = this.SciChartJsTheme.sciChartBackground;
229    SidebarTextColor = "#222";
230
231    // Charts grid colours
232    ChartsGridStroke1 = "#DF69A8";
233    ChartsGridStroke2 = "#EA6F63";
234    ChartsGridStroke3 = "#45BEE8";
235
236    // 3D Chart colors
237    Chart3DScatterFill = "#DF69A8";
238    Chart3DColor1 = "#E4F5FC";
239    Chart3DColor2 = "#45BEE8";
240    Chart3DColor3 = "#45BEE8";
241    Chart3DColor4 = "#EA6F63";
242    Chart3DColor5 = "#DF69A8";
243    Chart3DColor6 = "#8065A3";
244    Chart3DColor7 = "#364BA0";
245
246    // Shale chart
247    ShaleBackgroundColor = "#B9E0D4";
248    ShaleOilLegendColor = "#DF69A8";
249    ShaleWaterLegendColor = "#45BEE8";
250    ShaleWaterSeries = "#45BEE877";
251    ShaleSeriesStroke = "#264B93";
252
253    // Density chart
254    DensityLegendSeparator = "#264B93";
255    DensityBackgroundOne = "#AE408E";
256    DensityBackgroundTwo = "#EA6F63AA";
257    DensityStrokeY = "#45BEE8";
258    DensityStrokeY1 = "#AE408E";
259    DensityFillY = "#AE408EAA";
260    DensityFillY1 = "#EA6F63AA";
261
262    // Resistivity Chart
263    ResistivityLineStroke = "#45BEE8";
264    ResistivityLineStroke2 = "#AE408E";
265
266    // Pore Space Chart
267    PoreSpaceStroke1 = "#E4F5FC";
268    PoreSpaceStroke2 = "#F1CFB5";
269    PoreSpacePhieFill = "#45BEE8";
270    PoreSpacePhitFill = "#AE408E";
271    PoreSpaceScatterStroke = "#EA6F63";
272    PoreSpaceScatterFill = "#EA6F63";
273
274    // Sonic vertical
275    SonicGradient1 = "#634E9733";
276    SonicGradient2 = "#264B9355";
277    SonicGradient3 = "#AE408E77";
278    SonicGradient4 = "#45BEE899";
279    SonicGradient5 = "#E4F5FCAA";
280    SonicGradient6 = "#DF69A8";
281
282    // Texture chart
283    TextureFill = "#90808080";
284    TextureLine = "#808080";
285    TextureSandFill = "#E7C565";
286    TextureGrainFill = "#209FD9";
287    TextureGravelFill = "#BE7336";
288
289    // Cursors
290    RolloverLineColor = "#364BA0";
291    RolloverTooltipFill = "#364BA0";
292    RolloverTooltipText = "#FFF";
293}
294
295export const appTheme: AppThemeBase = new App2022BrandTheme();
296
See Also: Performance Demos & Showcases (11 Demos)
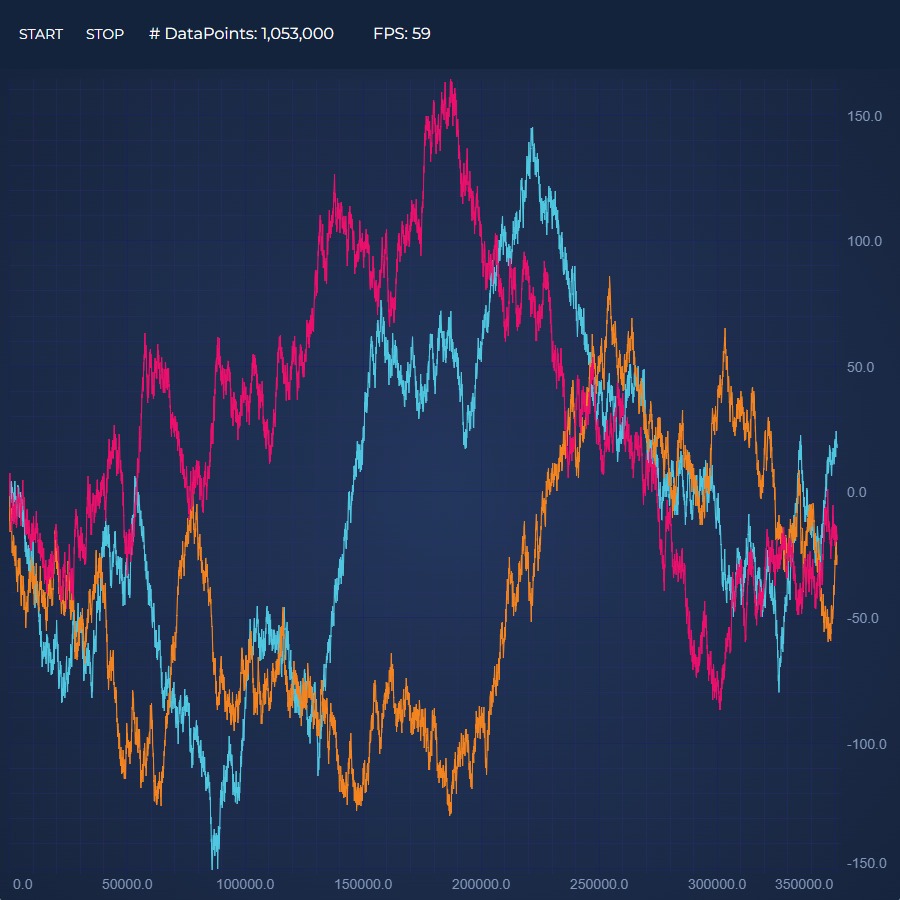
Realtime React Chart Performance Demo
This demo showcases the incredible realtime performance of our React charts by updating the series with millions of data-points!
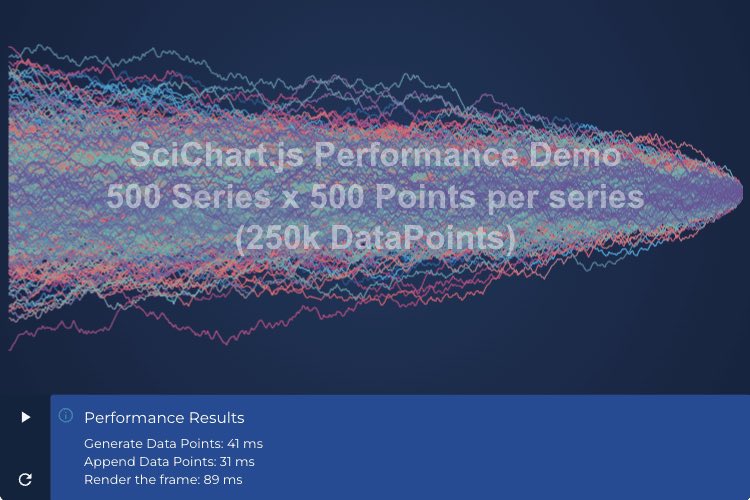
Load 500 Series x 500 Points Performance Demo
This demo showcases the incredible performance of our React Chart by loading 500 series with 500 points (250k points) instantly!
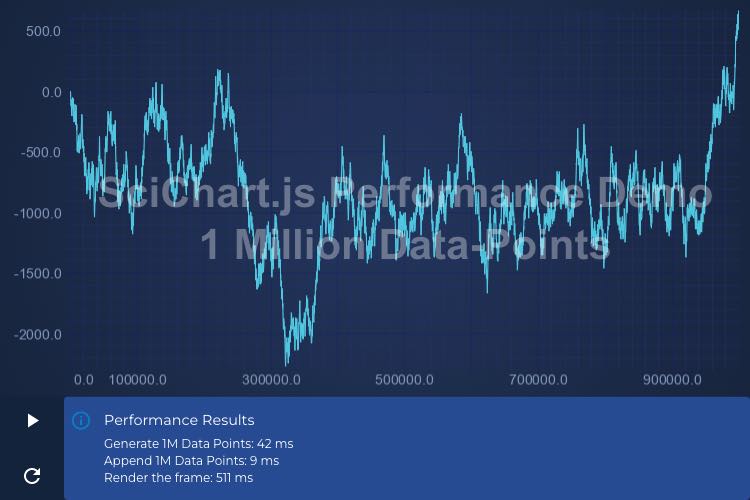
Load 1 Million Points Performance Demo
This demo showcases the incredible performance of our JavaScript Chart by loading a million points instantly.
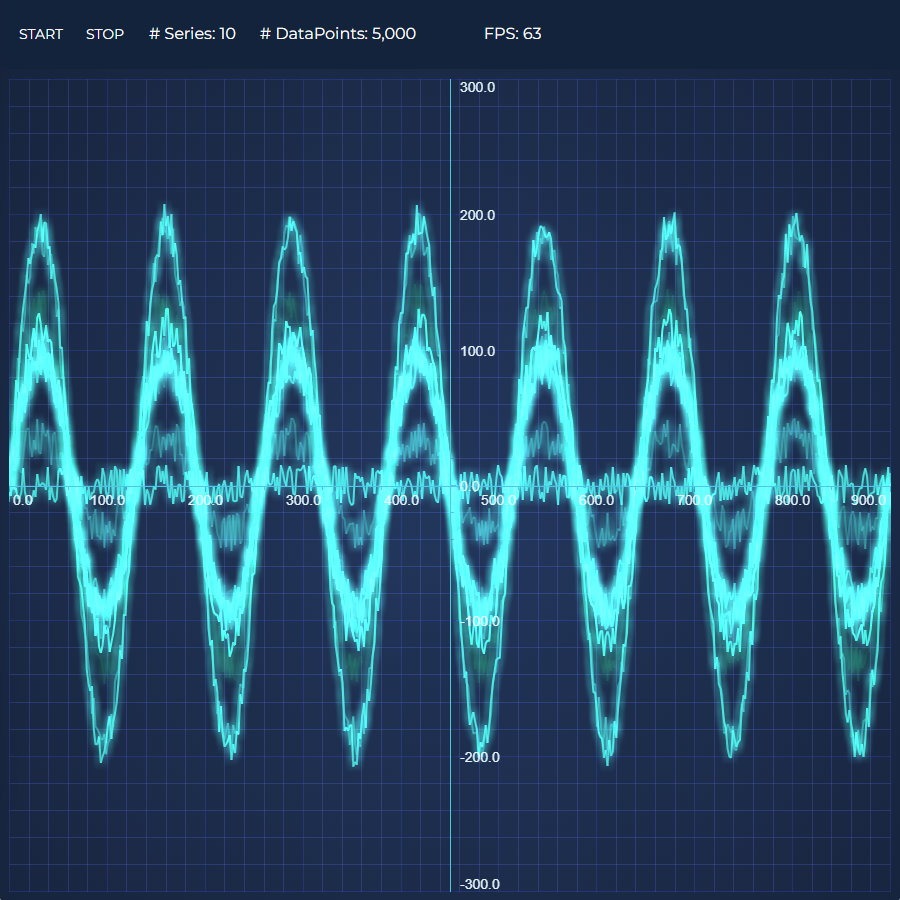
Realtime Ghosted Traces
This demo showcases the realtime performance of our React Chart by animating several series with thousands of data-points at 60 FPS

Realtime Audio Analyzer Demo
Demonstrating the capability of SciChart.js to create a JavaScript Audio Analyzer and visualize the Fourier-Transform of an audio waveform in realtime.
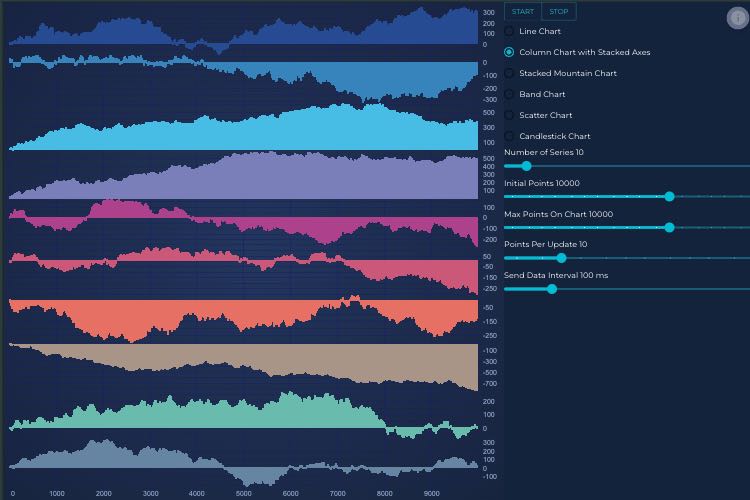
Client/Server Websocket Data Streaming
This demo showcases the incredible realtime performance of our JavaScript charts by updating the series with millions of data-points!
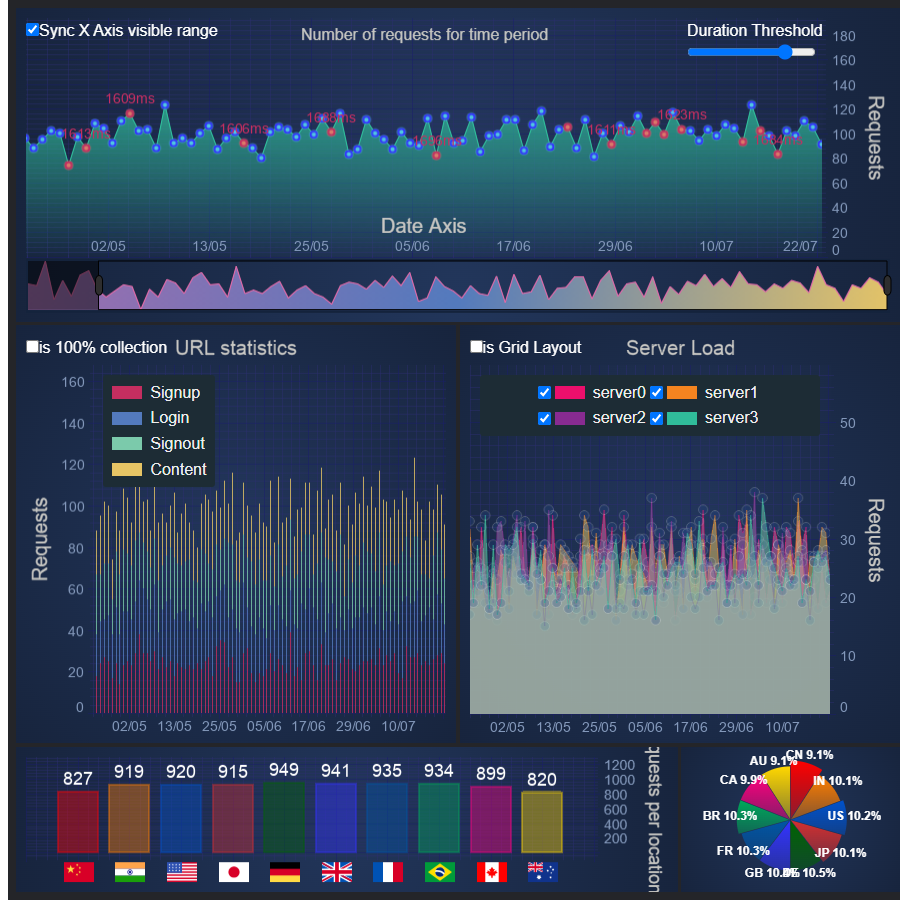
Server Traffic Dashboard
This dashboard demo showcases the incredible realtime performance of our React charts by updating the series with millions of data-points!
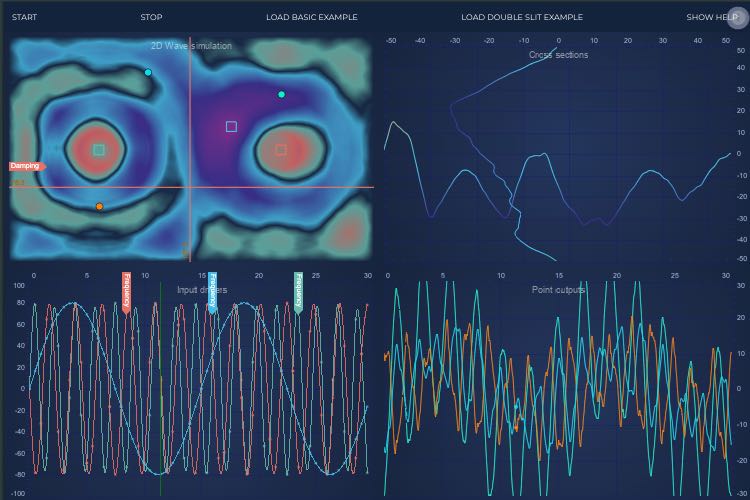
Rich Interactions Showcase
This demo showcases the incredible realtime performance of our React charts by updating the series with millions of data-points!
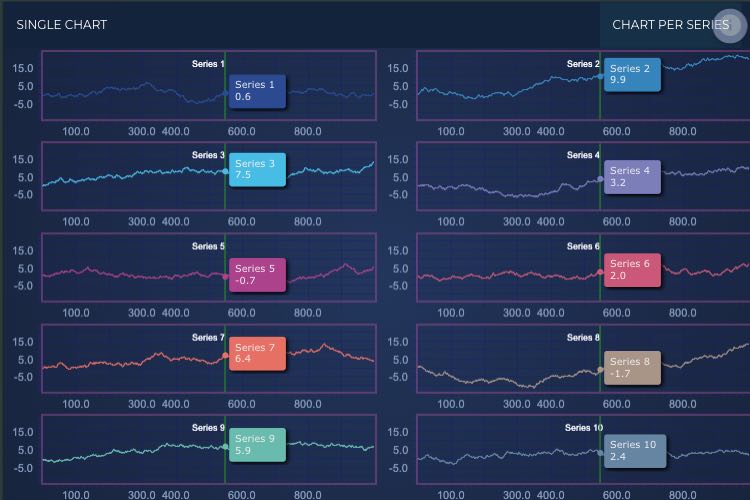
Dynamic Layout Showcase
Demonstrates a custom modifier which can convert from single chart to grid layout and back.
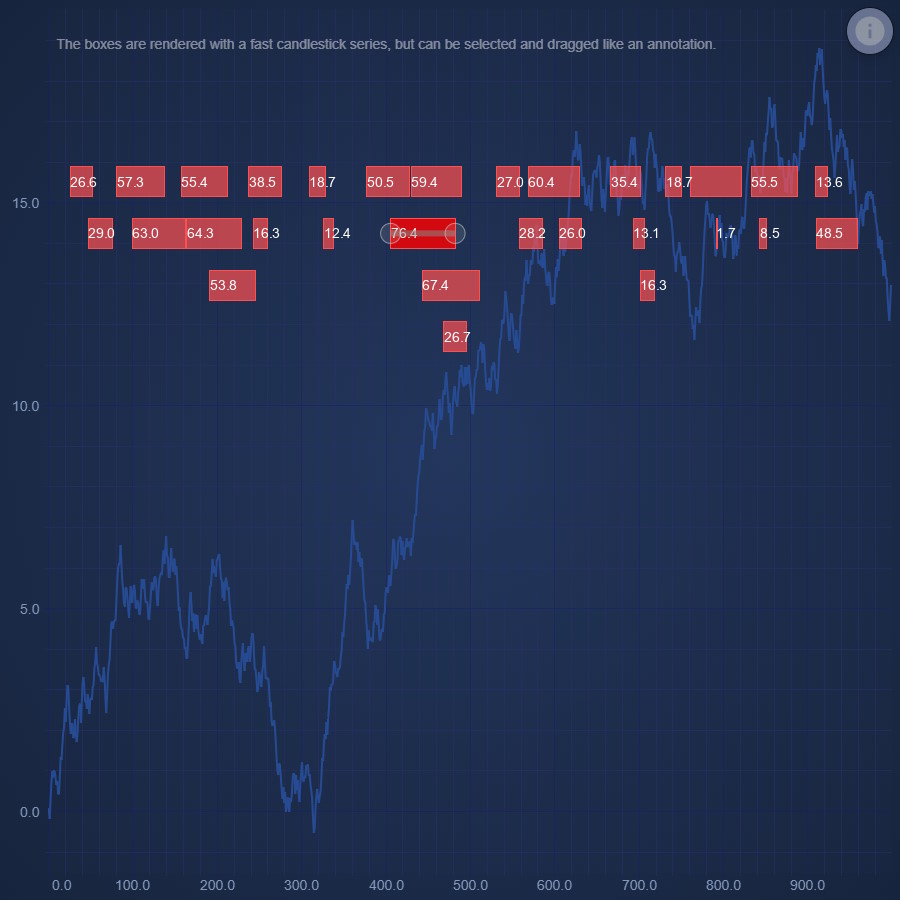
Dragabble Event Markers
Demonstrates how to repurpose a Candlestick Series into dragabble, labled, event markers
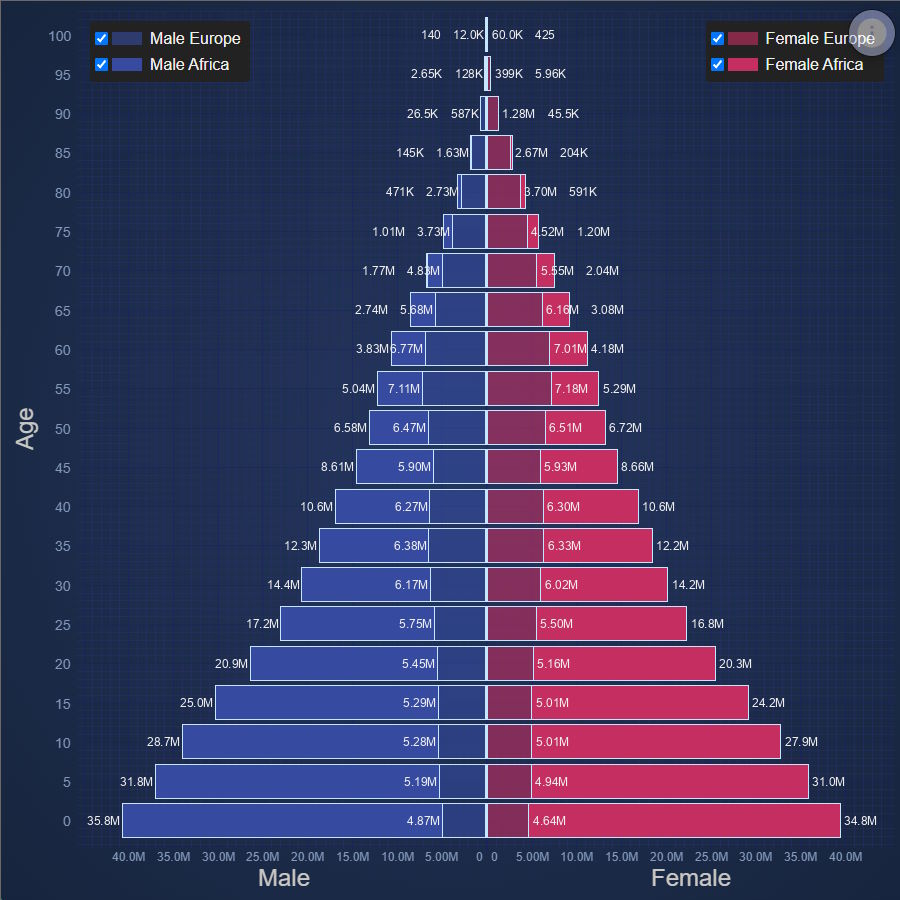
React Population Pyramid
Population Pyramid of Europe and Africa
Quick Links
Useful Links
SciChart Ltd, 16 Beaufort Court, Admirals Way, Docklands, London, E14 9XL.