React Chart with Multi-Style Series
Demonstrates how to use multiple styles on a single series on React Charts using SciChart.js, High Performance JavaScript Charts. This uses a RenderDataTransform to split the data so that we can draw the selected points using additional customised drawingProviders. This means that modifiers still see a single series with the original data.
drawExample.ts
index.tsx
theme.ts
1import {
2    BaseRenderDataTransform,
3    XyyPointSeriesResampled,
4    NumberRange,
5    RenderPassData,
6    IPointSeries,
7    XyDataSeries,
8    SciChartSurface,
9    NumericAxis,
10    TrianglePointMarker,
11    XyScatterRenderableSeries,
12    EllipsePointMarker,
13    PointMarkerDrawingProvider,
14    IXyyPointSeries,
15    IPointMarker,
16    FastColumnRenderableSeries,
17    GradientParams,
18    Point,
19    ColumnSeriesDrawingProvider,
20    ZoomExtentsModifier,
21    MouseWheelZoomModifier,
22    DataPointSelectionModifier,
23    LineSeriesDrawingProvider,
24    FastLineRenderableSeries,
25    ILineSeriesDrawingProviderProperties,
26    ELineDrawMode,
27    OhlcPointSeriesResampled,
28    IOhlcPointSeries,
29    RolloverModifier,
30    IPointMetadata,
31    SeriesInfo,
32    NativeTextAnnotation,
33    ECoordinateMode,
34    EHorizontalAnchorPoint,
35    EVerticalAnchorPoint,
36    IStrokePaletteProvider,
37    parseColorToUIntArgb,
38    EStrokePaletteMode,
39    IRenderableSeries,
40} from "scichart";
41import { appTheme } from "../../../theme";
42
43/**
44 * This transform turns xy data into ohlc.  Unselected points are in y (close).
45 * Selected points in low for pointmarkers, and selected plus points either side in high for lines.
46 * If you only need this for points or columns, you could transform to Xyy instead
47 */
48class SplitRenderDataTransform extends BaseRenderDataTransform<OhlcPointSeriesResampled> {
49    protected createPointSeries(): OhlcPointSeriesResampled {
50        return new OhlcPointSeriesResampled(this.wasmContext, new NumberRange(0, 0));
51    }
52    protected runTransformInternal(renderPassData: RenderPassData): IPointSeries {
53        const { xValues: oldX, yValues: oldY, indexes: oldI, resampled } = renderPassData.pointSeries;
54        // this.pointSeries is the target.  Clear the existing values
55        const { xValues, yValues, highValues, lowValues, indexes } = this.pointSeries;
56        xValues.clear();
57        yValues.clear();
58        highValues.clear();
59        lowValues.clear();
60        indexes.clear();
61        // This shows how to properly handled resampled data, though this is not necessary here.
62        const iStart = resampled ? 0 : renderPassData.indexRange.min;
63        const iEnd = resampled ? oldX.size() - 1 : renderPassData.indexRange?.max;
64        const ds = this.parentSeries.dataSeries as XyDataSeries;
65        let prevSelected = false;
66        for (let i = iStart; i <= iEnd; i++) {
67            const index = resampled ? oldI.get(i) : i;
68            const md = ds.getMetadataAt(index);
69            xValues.push_back(oldX.get(i));
70            indexes.push_back(oldI.get(i));
71            let nextSelected = false;
72            if (i < iEnd) {
73                const nextmd = ds.getMetadataAt(index + 1);
74                nextSelected = nextmd.isSelected;
75            }
76            yValues.push_back(md.isSelected ? NaN : oldY.get(i));
77            // For pointmarkers we just need the point itself
78            lowValues.push_back(md.isSelected ? oldY.get(i) : NaN);
79            // need points either side of the selected value for the line to draw.
80            highValues.push_back(prevSelected || md.isSelected || nextSelected ? oldY.get(i) : NaN);
81            prevSelected = md.isSelected;
82        }
83        return this.pointSeries;
84    }
85}
86
87export const drawExample = async (rootElement: string | HTMLDivElement) => {
88    // Create a SciChartSurface
89    const { sciChartSurface, wasmContext } = await SciChartSurface.create(rootElement, {
90        theme: appTheme.SciChartJsTheme,
91    });
92
93    // Create X,Y Axis
94    sciChartSurface.xAxes.add(new NumericAxis(wasmContext, { growBy: new NumberRange(0.05, 0.05) }));
95    sciChartSurface.yAxes.add(new NumericAxis(wasmContext, { growBy: new NumberRange(0, 0.05) }));
96
97    // Column series with different gradient fill for selected columns
98    const xValues = Array.from({ length: 20 }, (x, i) => i);
99    const colyValues = xValues.map((x) => 10 + Math.random() * 40);
100    const colmetadata = xValues.map((x) => ({
101        isSelected: Math.random() < 0.3,
102    }));
103    const columnSeries = new FastColumnRenderableSeries(wasmContext, {
104        fillLinearGradient: new GradientParams(new Point(0, 0), new Point(0, 1), [
105            { color: appTheme.MutedRed, offset: 0 },
106            { color: appTheme.MutedTeal, offset: 1 },
107        ]),
108        dataSeries: new XyDataSeries(wasmContext, {
109            xValues: xValues,
110            yValues: colyValues,
111            metadata: colmetadata,
112            containsNaN: true,
113        }),
114        stroke: "transparent",
115    });
116    // We cannot use a paletteProvider to change a gradient fill, so we have to use a second drawingProvider
117    const selectedColDP = new ColumnSeriesDrawingProvider(
118        wasmContext,
119        columnSeries,
120        // configure this to draw using the selected points
121        (ps) => (ps as IOhlcPointSeries).lowValues
122    );
123    selectedColDP.getProperties = (parentSeries) => {
124        const { stroke, strokeThickness, fill } = parentSeries;
125        return {
126            opacity: 1,
127            // Opacity setting does not currently apply to the gradient colors, so we have to apply it individually
128            fillLinearGradient: new GradientParams(new Point(0, 0), new Point(0, 1), [
129                { color: appTheme.MutedRed + "88", offset: 0 },
130                { color: appTheme.MutedSkyBlue + "88", offset: 1 },
131            ]),
132            stroke,
133            strokeThickness,
134            fill,
135        };
136    };
137    columnSeries.drawingProviders.push(selectedColDP);
138    columnSeries.renderDataTransform = new SplitRenderDataTransform(
139        columnSeries,
140        wasmContext,
141        columnSeries.drawingProviders
142    );
143    sciChartSurface.renderableSeries.add(columnSeries);
144
145    const lineyValues = xValues.map((x) => 30 + x + x * Math.random());
146    const linemetadata = xValues.map((x) => ({
147        isSelected: Math.random() < 0.3,
148    }));
149    // Line series with different pointmarker and dashed line for selected sections
150    const lineSeries = new FastLineRenderableSeries(wasmContext, {
151        dataSeries: new XyDataSeries(wasmContext, {
152            xValues: xValues,
153            yValues: lineyValues,
154            metadata: linemetadata,
155            containsNaN: true,
156        }),
157        pointMarker: new EllipsePointMarker(wasmContext, {
158            width: 14,
159            height: 14,
160            strokeThickness: 0,
161            fill: appTheme.VividSkyBlue,
162        }),
163        stroke: appTheme.VividTeal,
164        strokeThickness: 3,
165        drawNaNAs: ELineDrawMode.DiscontinuousLine,
166    });
167
168    const trianglePM = new TrianglePointMarker(wasmContext, {
169        width: 15,
170        height: 15,
171        strokeThickness: 0,
172        fill: appTheme.VividOrange,
173    });
174    // Additional line drawing for selected segments
175    const selectedLineDP = new LineSeriesDrawingProvider(
176        wasmContext,
177        lineSeries,
178        (ps) => (ps as IOhlcPointSeries).highValues
179    );
180    // Make this drawingProvider used dashed lines
181    selectedLineDP.getProperties = (parentSeries) => {
182        const { stroke, strokeThickness, opacity, isDigitalLine, lineType, drawNaNAs } = parentSeries;
183        return {
184            stroke,
185            strokeThickness,
186            strokeDashArray: [3, 4],
187            isDigitalLine,
188            lineType,
189            drawNaNAs,
190            containsNaN: true,
191        } as ILineSeriesDrawingProviderProperties;
192    };
193    // Add this as the first drawingProviders so it draws behind all pointmarkers
194    lineSeries.drawingProviders.unshift(selectedLineDP);
195
196    // Additional point drawing for selecetd points
197    const triangleDP = new PointMarkerDrawingProvider(
198        wasmContext,
199        lineSeries,
200        (ps) => (ps as IOhlcPointSeries).lowValues
201    );
202    triangleDP.getProperties = (series) => {
203        return { pointMarker: trianglePM as IPointMarker };
204    };
205    lineSeries.drawingProviders.push(triangleDP);
206
207    // Apply the transform to all the drawingProviders
208    lineSeries.renderDataTransform = new SplitRenderDataTransform(lineSeries, wasmContext, lineSeries.drawingProviders);
209    sciChartSurface.renderableSeries.add(lineSeries);
210
211    sciChartSurface.annotations.add(
212        new NativeTextAnnotation({
213            xCoordinateMode: ECoordinateMode.Pixel,
214            yCoordinateMode: ECoordinateMode.Pixel,
215            x1: 20,
216            y1: 20,
217            horizontalAnchorPoint: EHorizontalAnchorPoint.Left,
218            verticalAnchorPoint: EVerticalAnchorPoint.Top,
219            text: "Selected points are styled differently.  Click and drag to change the selection",
220            textColor: appTheme.ForegroundColor,
221            fontSize: 16,
222            opacity: 0.77,
223        })
224    );
225
226    // Optional: Add Interactivity Modifiers
227    sciChartSurface.chartModifiers.add(
228        new DataPointSelectionModifier({
229            allowClickSelect: true,
230            onSelectionChanged: (args) => {
231                lineSeries.renderDataTransform.requiresTransform = true;
232                columnSeries.renderDataTransform.requiresTransform = true;
233            },
234        })
235    );
236    // sciChartSurface.chartModifiers.add(new RolloverModifier({
237    //     tooltipDataTemplate: (seriesInfo: SeriesInfo) => {
238    //         const vals: string[] = [];
239    //         vals.push(`X ${seriesInfo.formattedXValue}`);
240    //         vals.push(`Y ${seriesInfo.formattedYValue}`);
241    //         vals.push(`selected ${(seriesInfo.pointMetadata as IPointMetadata).isSelected}`);
242    //         return vals;
243    //     }
244    // }));
245
246    sciChartSurface.zoomExtents();
247    return { sciChartSurface, wasmContext };
248};
249
See Also: Styling and Theming (10 Demos)
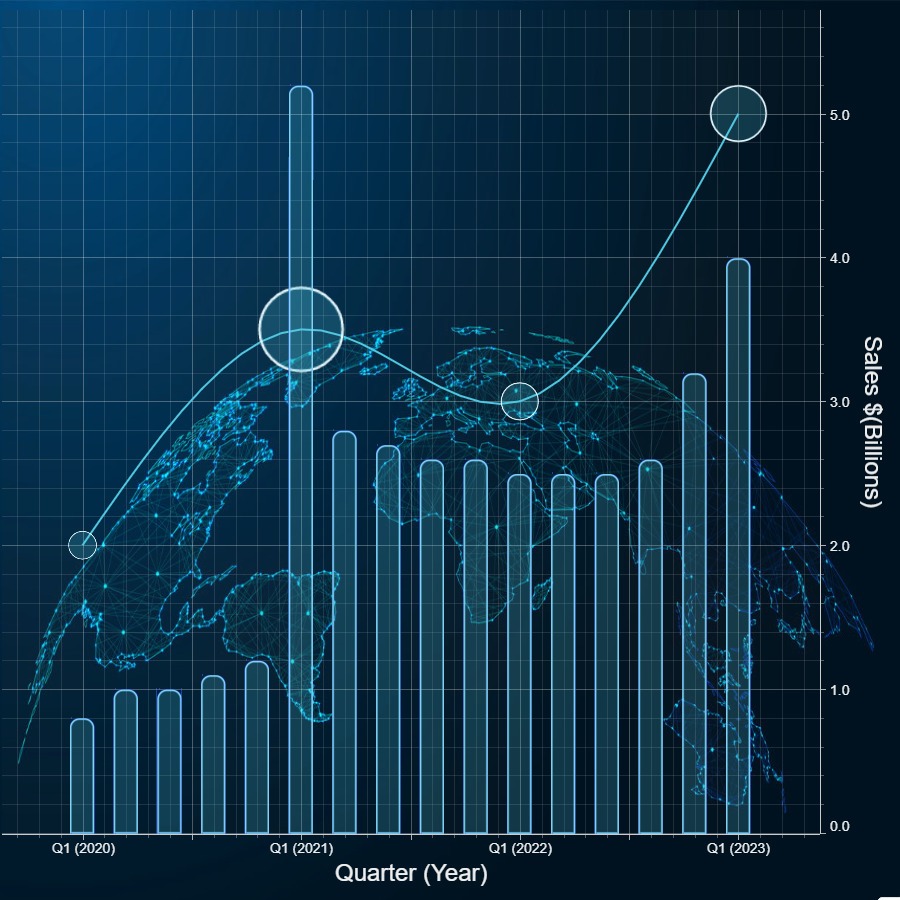
Background Image with Transparency
Demonstrates how to create a React Chart with background image using transparency in SciChart.js
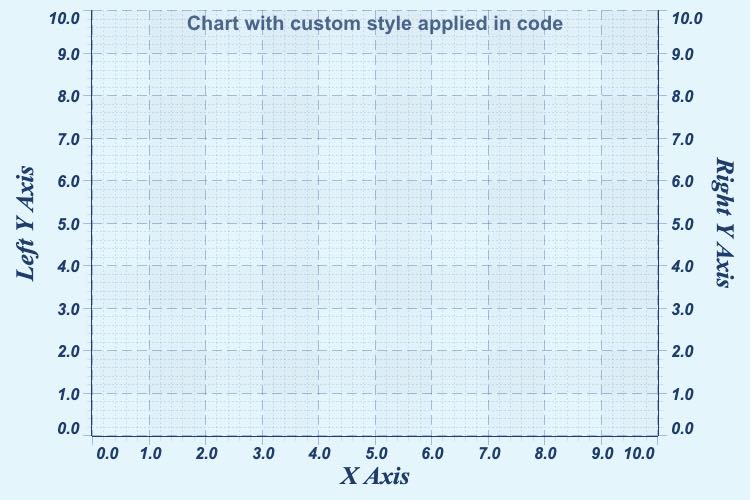
Styling a React Chart in Code
Demonstrates how to style a React Chart entirely in code with SciChart.js themeing API
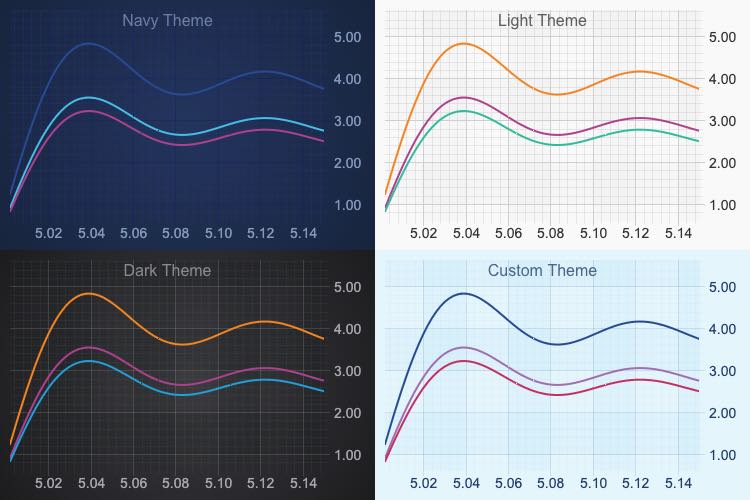
Using Theme Manager in React Chart
Demonstrates our Light and Dark Themes for React Charts with SciChart.js ThemeManager API
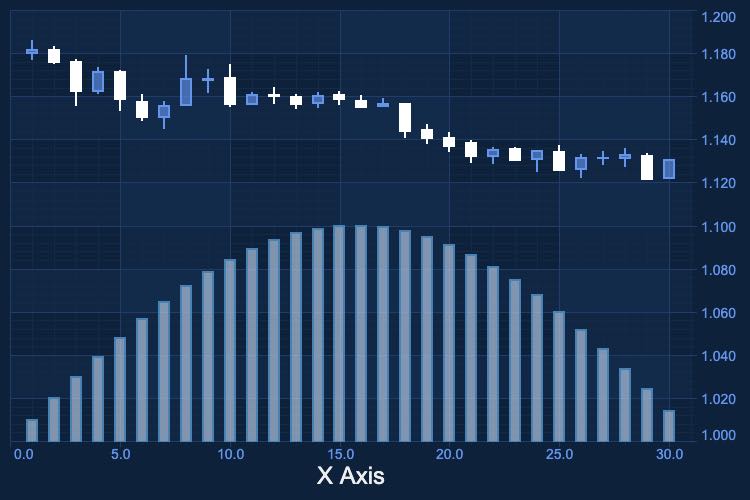
Create a Custom Theme for React Chart
Demonstrates how to create a Custom Theme for a SciChart.js React Chart using our Theming API
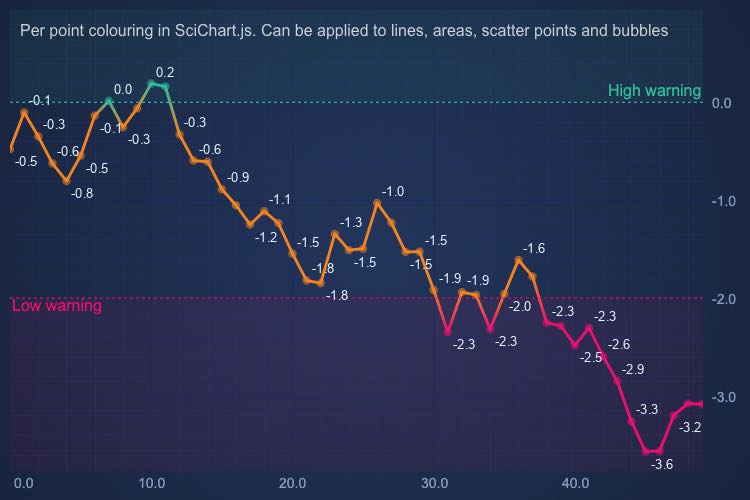
Coloring Series per-point using the PaletteProvider
Demonstrates per-point coloring in JavaScript chart types with SciChart.js PaletteProvider API
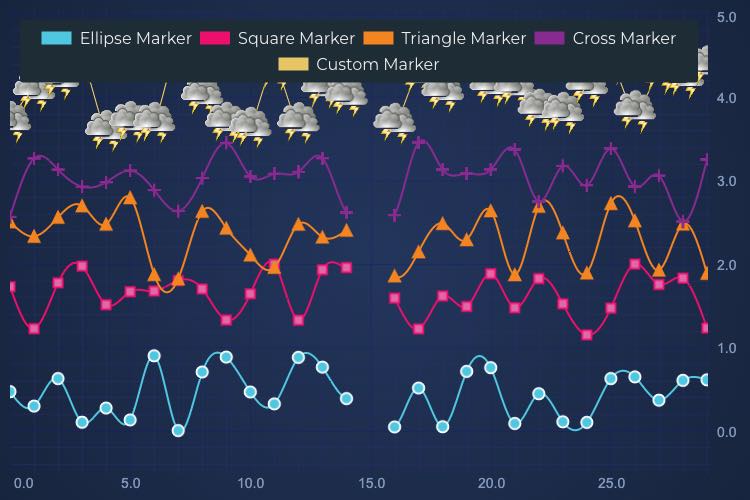
React Point-Markers Chart
Demonstrates the different point-marker types for React Scatter charts (Square, Circle, Triangle and Custom image point-marker)
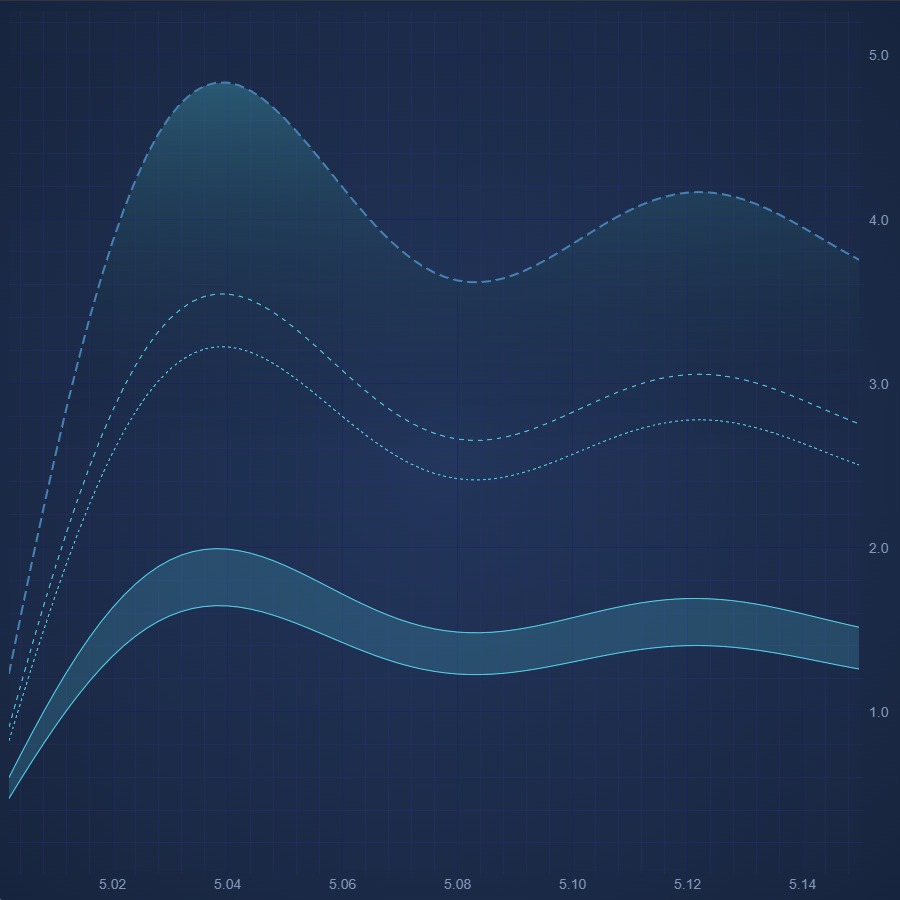
Dashed Line Styling
Demonstrates dashed line series in React Charts with SciChart.js
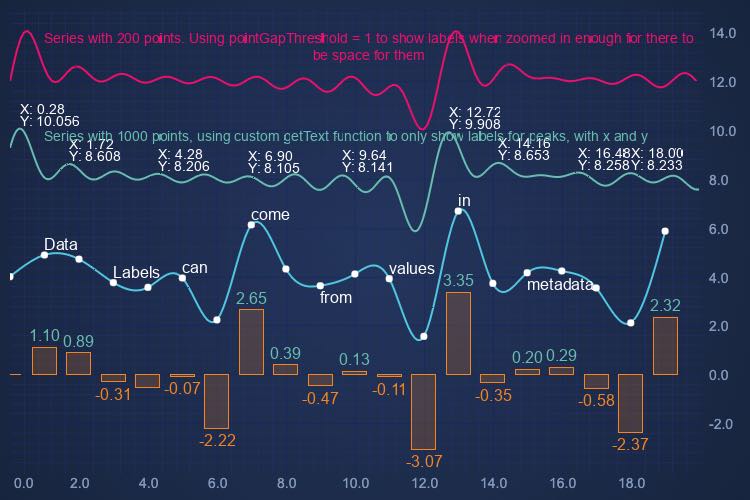
Data Labels
Show data labels on React Chart. Get your free demo now.
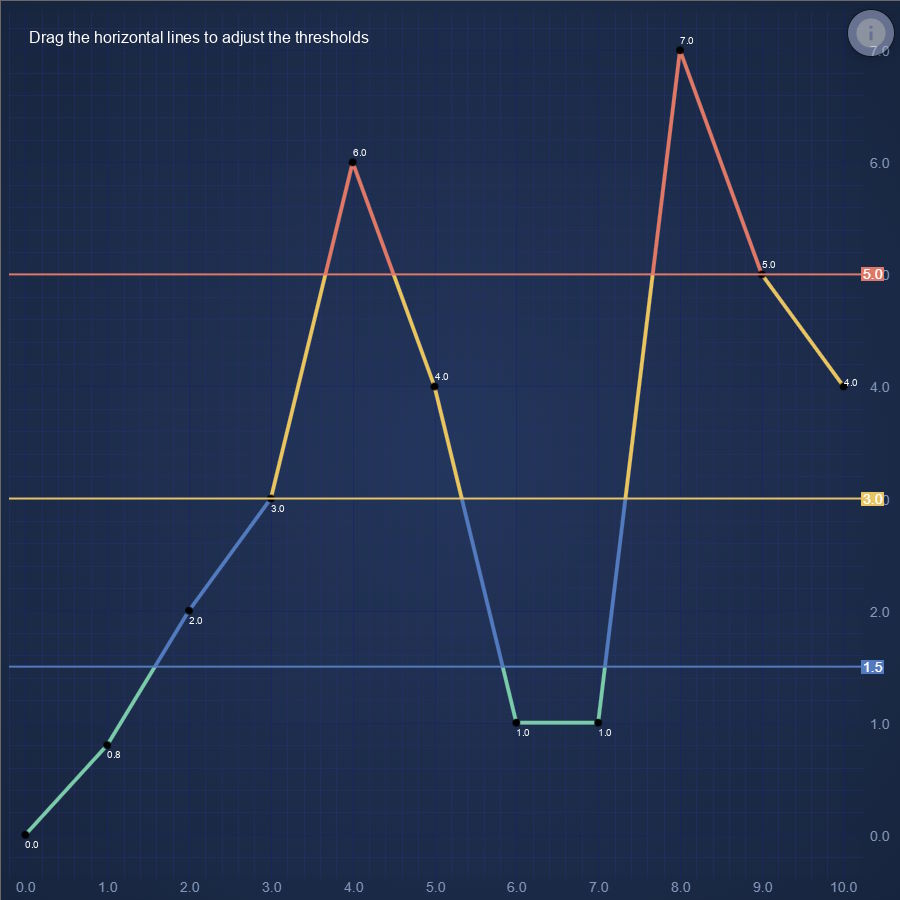
React Chart with lines split by thresholds
Demonstrates how to use a RenderDataTransform to split lines into multiple segments so they can be individually colored according to thresholds
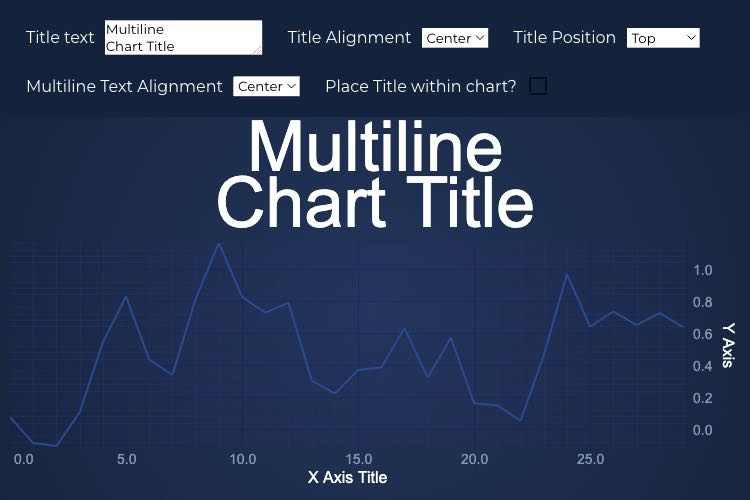
React Chart Title
Demonstrates chart title with different position and alignment options