React Line Chart
Demonstrates all the permutations of JavaScript Line Chart using SciChart.js, including Digital Line chart, Tooltips, Dashed lines, Gradient lines, Hovering/selecting lines, vertical lines and paletted lines.
drawExample.ts
index.tsx
ChartGroupLoader.tsx
ExampleDataProvider.ts
RandomWalkGenerator.ts
theme.ts
1import {
2 BoxAnnotation,
3 EAnimationType,
4 EAxisAlignment,
5 ECoordinateMode,
6 EDataLabelSkipMode,
7 ELabelPlacement,
8 ELineDrawMode,
9 EllipsePointMarker,
10 EStrokePaletteMode,
11 EVerticalTextPosition,
12 FastLineRenderableSeries,
13 GradientParams,
14 HorizontalLineAnnotation,
15 IPointMetadata,
16 IRenderableSeries,
17 IStrokePaletteProvider,
18 NumberRange,
19 NumericAxis,
20 PaletteFactory,
21 parseColorToUIntArgb,
22 Point,
23 RolloverModifier,
24 SciChartSurface,
25 SeriesSelectionModifier,
26 Thickness,
27 VerticalSliceModifier,
28 XyDataSeries,
29} from "scichart";
30import { ExampleDataProvider } from "../../../ExampleData/ExampleDataProvider";
31import { RandomWalkGenerator } from "../../../ExampleData/RandomWalkGenerator";
32import { appTheme } from "../../../theme";
33
34export const getChartsInitializationAPI = () => {
35 const createChartCommon = async (divId: string | HTMLDivElement, title: string, isVertical: boolean = false) => {
36 // Create a SciChartSurface
37 const { sciChartSurface, wasmContext } = await SciChartSurface.create(divId, {
38 theme: appTheme.SciChartJsTheme,
39 padding: new Thickness(5, 5, 5, 5),
40 title,
41 disableAspect: true,
42 titleStyle: {
43 placeWithinChart: true,
44 color: appTheme.ForegroundColor + "C4",
45 fontSize: 16,
46 },
47 });
48
49 sciChartSurface.background = "transparent";
50
51 const xAxis = new NumericAxis(wasmContext, { maxAutoTicks: 5 });
52 sciChartSurface.xAxes.add(xAxis);
53
54 const yAxis = new NumericAxis(wasmContext, { maxAutoTicks: 5, growBy: new NumberRange(0.05, 0.25) });
55 sciChartSurface.yAxes.add(yAxis);
56
57 xAxis.isVisible = false;
58 yAxis.isVisible = false;
59
60 if (isVertical) {
61 // We also want our padding on the xaxis at the start for vertical
62 sciChartSurface.xAxes.get(0).growBy = new NumberRange(0.2, 0.05);
63 }
64 return { sciChartSurface, wasmContext };
65 };
66
67 const createLineData = (whichSeries: number) => {
68 const data = ExampleDataProvider.getFourierSeriesZoomed(1.0, 0.1, 5.0, 5.15);
69
70 return {
71 xValues: data.xValues,
72 yValues: data.yValues.map((y) => (whichSeries === 0 ? y : whichSeries === 1 ? y * 1.1 : y * 1.5)),
73 };
74 };
75
76 const initJustLineCharts = async (rootElement: string | HTMLDivElement) => {
77 const { sciChartSurface, wasmContext } = await createChartCommon(rootElement, "Simple Line Chart");
78
79 let data = createLineData(2);
80
81 // Create and add a line series to the chart
82 sciChartSurface.renderableSeries.add(
83 new FastLineRenderableSeries(wasmContext, {
84 dataSeries: new XyDataSeries(wasmContext, { xValues: data.xValues, yValues: data.yValues }),
85 stroke: appTheme.VividOrange,
86 strokeThickness: 3,
87 opacity: 1,
88 animation: {
89 type: EAnimationType.Sweep,
90 options: { duration: 500 },
91 },
92 })
93 );
94
95 data = createLineData(0);
96
97 // Create and add a line series to the chart
98 sciChartSurface.renderableSeries.add(
99 new FastLineRenderableSeries(wasmContext, {
100 dataSeries: new XyDataSeries(wasmContext, { xValues: data.xValues, yValues: data.yValues }),
101 stroke: appTheme.VividTeal,
102 strokeThickness: 3,
103 opacity: 1,
104 animation: {
105 type: EAnimationType.Sweep,
106 options: { duration: 500 },
107 },
108 })
109 );
110
111 return { sciChartSurface, wasmContext };
112 };
113
114 const initDigitalLineCharts = async (rootElement: string | HTMLDivElement) => {
115 const { sciChartSurface, wasmContext } = await createChartCommon(rootElement, "Digital (Step) Line Charts");
116
117 const xValues = [0, 1, 2, 3, 4, 5, 6, 7, 8];
118 const yValues = [1, 2, 3, 2, 0.5, 1, 2.5, 1, 1];
119
120 // Create the Digital Line chart
121 sciChartSurface.renderableSeries.add(
122 new FastLineRenderableSeries(wasmContext, {
123 dataSeries: new XyDataSeries(wasmContext, { xValues, yValues }),
124 stroke: appTheme.VividOrange,
125 strokeThickness: 3,
126 // Digital (step) lines are enabled by setting isDigitalLine: true
127 isDigitalLine: true,
128 // Optional pointmarkers may be added via this property.
129 pointMarker: new EllipsePointMarker(wasmContext, {
130 width: 9,
131 height: 9,
132 fill: appTheme.ForegroundColor,
133 strokeThickness: 0,
134 }),
135 animation: {
136 type: EAnimationType.Wave,
137 options: { duration: 500, delay: 200 },
138 },
139 // Optional DataLabels may be added via this property.
140 dataLabels: {
141 style: { fontFamily: "Arial", fontSize: 11, padding: new Thickness(5, 5, 5, 5) },
142 color: appTheme.ForegroundColor,
143 aboveBelow: false,
144 verticalTextPosition: EVerticalTextPosition.Above,
145 },
146 })
147 );
148
149 return { sciChartSurface, wasmContext };
150 };
151
152 const initTooltipsOnLineCharts = async (rootElement: string | HTMLDivElement) => {
153 const { sciChartSurface, wasmContext } = await createChartCommon(rootElement, "Tooltips on Line Charts");
154
155 const { xValues, yValues } = new RandomWalkGenerator().Seed(1337).getRandomWalkSeries(25);
156
157 sciChartSurface.renderableSeries.add(
158 new FastLineRenderableSeries(wasmContext, {
159 dataSeries: new XyDataSeries(wasmContext, { xValues, yValues }),
160 stroke: appTheme.VividOrange,
161 strokeThickness: 3,
162 animation: {
163 type: EAnimationType.Wave,
164 options: { duration: 500, delay: 200 },
165 },
166 })
167 );
168
169 // The RolloverModifier adds tooltip behaviour to the chart
170 sciChartSurface.chartModifiers.add(
171 new RolloverModifier({
172 rolloverLineStroke: appTheme.VividOrange,
173 rolloverLineStrokeThickness: 2,
174 rolloverLineStrokeDashArray: [2, 2],
175 }),
176 new VerticalSliceModifier({
177 rolloverLineStroke: appTheme.VividOrange,
178 rolloverLineStrokeThickness: 2,
179 xCoordinateMode: ECoordinateMode.DataValue,
180 x1: 15,
181 })
182 );
183
184 return { sciChartSurface, wasmContext };
185 };
186
187 const initDashedLineCharts = async (rootElement: string | HTMLDivElement) => {
188 const { sciChartSurface, wasmContext } = await createChartCommon(rootElement, "Dashed Line Charts");
189
190 // Create some xValues, yValues arrays
191 let data = createLineData(0);
192
193 // Create and add a line series to the chart
194 sciChartSurface.renderableSeries.add(
195 new FastLineRenderableSeries(wasmContext, {
196 dataSeries: new XyDataSeries(wasmContext, { xValues: data.xValues, yValues: data.yValues }),
197 stroke: appTheme.VividOrange,
198 strokeThickness: 3,
199 // Dashed line charts are enabled by setting the StrokeDashArray property. The array defines draw & gap pixel length
200 strokeDashArray: [2, 2],
201 animation: {
202 type: EAnimationType.Sweep,
203 options: { duration: 750 },
204 },
205 })
206 );
207
208 data = createLineData(1);
209
210 // Create and add a line series to the chart
211 sciChartSurface.renderableSeries.add(
212 new FastLineRenderableSeries(wasmContext, {
213 dataSeries: new XyDataSeries(wasmContext, { xValues: data.xValues, yValues: data.yValues }),
214 stroke: appTheme.VividOrange,
215 strokeThickness: 3,
216 opacity: 0.77,
217 strokeDashArray: [3, 3],
218 animation: {
219 type: EAnimationType.Sweep,
220 options: { duration: 500 },
221 },
222 })
223 );
224
225 data = createLineData(2);
226
227 // Create and add a line series to the chart
228 sciChartSurface.renderableSeries.add(
229 new FastLineRenderableSeries(wasmContext, {
230 dataSeries: new XyDataSeries(wasmContext, { xValues: data.xValues, yValues: data.yValues }),
231 stroke: appTheme.VividOrange,
232 strokeThickness: 3,
233 opacity: 0.55,
234 strokeDashArray: [10, 5],
235 animation: {
236 type: EAnimationType.Sweep,
237 options: { duration: 500 },
238 },
239 })
240 );
241
242 return { sciChartSurface, wasmContext };
243 };
244
245 const initPalettedLineCharts = async (rootElement: string | HTMLDivElement) => {
246 const { sciChartSurface, wasmContext } = await createChartCommon(rootElement, "Gradient Line Charts");
247
248 const data = createLineData(3);
249
250 // Returns IStrokePaletteProvider, preconfigured to colour each point with a gradient
251 // Can be fully customised to execute any rule on x,y,index or metadata per-point to colour the series
252 // See PaletteProvider documentation for more details
253 const xGradientPalette = PaletteFactory.createGradient(
254 wasmContext,
255 new GradientParams(new Point(0, 0), new Point(1, 1), [
256 { offset: 0, color: appTheme.VividOrange },
257 { offset: 0.5, color: appTheme.VividTeal },
258 { offset: 1.0, color: appTheme.VividSkyBlue },
259 ])
260 );
261
262 // Y gradient
263 const yGradientPalette = PaletteFactory.createYGradient(
264 wasmContext,
265 new GradientParams(new Point(0, 0), new Point(1, 1), [
266 { offset: 0, color: appTheme.VividOrange },
267 { offset: 0.5, color: appTheme.VividSkyBlue },
268 { offset: 1, color: appTheme.VividTeal },
269 ]),
270 new NumberRange(2, 4) // the range of y-values to apply the gradient to
271 );
272
273 // decresing Sine wave
274 var yValues = [];
275 for (var i = 0; i < 75; i++) {
276 yValues.push(3 + Math.sin((i * Math.PI) / 16) * (2 - i / 50));
277 }
278
279 sciChartSurface.renderableSeries.add(
280 new FastLineRenderableSeries(wasmContext, {
281 dataSeries: new XyDataSeries(wasmContext, { xValues: data.xValues, yValues: data.yValues }),
282 paletteProvider: xGradientPalette,
283 strokeThickness: 5,
284 animation: {
285 type: EAnimationType.Sweep,
286 options: { duration: 500 },
287 },
288 }),
289
290 new FastLineRenderableSeries(wasmContext, {
291 dataSeries: new XyDataSeries(wasmContext, { xValues: data.xValues, yValues: yValues }),
292 paletteProvider: yGradientPalette,
293 strokeThickness: 5,
294 animation: {
295 type: EAnimationType.Sweep,
296 options: { duration: 500 },
297 },
298 })
299 );
300
301 return { sciChartSurface, wasmContext };
302 };
303
304 const initHoveredLineCharts = async (rootElement: string | HTMLDivElement) => {
305 const { sciChartSurface, wasmContext } = await createChartCommon(rootElement, "Hover/Select Line Charts");
306
307 // Create some xValues, yValues arrays
308 let data = createLineData(0);
309
310 const onHoveredChanged = (series: IRenderableSeries, isHovered: boolean) => {
311 series.opacity = isHovered ? 1.0 : 0.7;
312 series.strokeThickness = isHovered ? 4 : 3;
313 };
314
315 const onSelectedChanged = (series: IRenderableSeries, isSelected: boolean) => {
316 series.strokeThickness = isSelected ? 5 : 3;
317 series.stroke = isSelected ? appTheme.VividSkyBlue : appTheme.VividOrange;
318 };
319
320 // Create and add a line series to the chart
321 sciChartSurface.renderableSeries.add(
322 new FastLineRenderableSeries(wasmContext, {
323 dataSeries: new XyDataSeries(wasmContext, { xValues: data.xValues, yValues: data.yValues }),
324 stroke: appTheme.VividOrange,
325 strokeThickness: 3,
326 opacity: 0.7,
327 onHoveredChanged,
328 onSelectedChanged,
329 animation: {
330 type: EAnimationType.Sweep,
331 options: { duration: 750 },
332 },
333 })
334 );
335
336 data = createLineData(1);
337
338 // Create and add a line series to the chart
339 sciChartSurface.renderableSeries.add(
340 new FastLineRenderableSeries(wasmContext, {
341 dataSeries: new XyDataSeries(wasmContext, { xValues: data.xValues, yValues: data.yValues }),
342 stroke: appTheme.VividOrange,
343 strokeThickness: 3,
344 opacity: 0.7,
345 onHoveredChanged,
346 onSelectedChanged,
347 animation: {
348 type: EAnimationType.Sweep,
349 options: { duration: 500 },
350 },
351 })
352 );
353
354 data = createLineData(2);
355
356 // Create and add a line series to the chart
357 sciChartSurface.renderableSeries.add(
358 new FastLineRenderableSeries(wasmContext, {
359 dataSeries: new XyDataSeries(wasmContext, { xValues: data.xValues, yValues: data.yValues }),
360 stroke: appTheme.VividOrange,
361 strokeThickness: 3,
362 opacity: 0.7,
363 onHoveredChanged,
364 onSelectedChanged,
365 animation: {
366 type: EAnimationType.Sweep,
367 options: { duration: 500 },
368 },
369 })
370 );
371
372 // SeriesSelectionModifier adds the hover/select behaviour to the chart
373 // This has a global hovered/selected callback and there are also callbacks per-series (see above)
374 sciChartSurface.chartModifiers.add(new SeriesSelectionModifier({ enableHover: true, enableSelection: true }));
375
376 sciChartSurface.renderableSeries.get(2).isSelected = true;
377
378 return { sciChartSurface, wasmContext };
379 };
380
381 const initVerticalLineCharts = async (rootElement: string | HTMLDivElement) => {
382 const { sciChartSurface, wasmContext } = await createChartCommon(rootElement, "Vertical Line Charts", true);
383
384 // Setting xAxis.alignment = left/right and yAxis.alignemnt = top/bottom
385 // is all that's required to rotate a chart, including all drawing and interactions in scichart
386 sciChartSurface.xAxes.get(0).axisAlignment = EAxisAlignment.Right;
387 sciChartSurface.yAxes.get(0).axisAlignment = EAxisAlignment.Bottom;
388
389 let data = new RandomWalkGenerator().Seed(1337).getRandomWalkSeries(50);
390
391 sciChartSurface.renderableSeries.add(
392 new FastLineRenderableSeries(wasmContext, {
393 dataSeries: new XyDataSeries(wasmContext, { xValues: data.xValues, yValues: data.yValues }),
394 strokeThickness: 3,
395 stroke: appTheme.VividOrange,
396 pointMarker: new EllipsePointMarker(wasmContext, {
397 width: 5,
398 height: 5,
399 fill: appTheme.VividOrange,
400 strokeThickness: 0,
401 }),
402 animation: {
403 type: EAnimationType.Sweep,
404 options: { duration: 400, delay: 250 },
405 },
406 })
407 );
408
409 data = new RandomWalkGenerator().Seed(12345).getRandomWalkSeries(50);
410
411 sciChartSurface.renderableSeries.add(
412 new FastLineRenderableSeries(wasmContext, {
413 dataSeries: new XyDataSeries(wasmContext, { xValues: data.xValues, yValues: data.yValues }),
414 strokeThickness: 3,
415 stroke: appTheme.VividTeal,
416 pointMarker: new EllipsePointMarker(wasmContext, {
417 width: 5,
418 height: 5,
419 fill: appTheme.VividTeal,
420 strokeThickness: 0,
421 }),
422 animation: {
423 type: EAnimationType.Sweep,
424 options: { duration: 400, delay: 250 },
425 },
426 })
427 );
428
429 return { sciChartSurface, wasmContext };
430 };
431
432 const initGapsInLineCharts = async (rootElement: string | HTMLDivElement) => {
433 const { sciChartSurface, wasmContext } = await createChartCommon(rootElement, "Gaps in Line Charts");
434
435 const xValues = [0, 1, 2, 3, 4, 5, 6, 7, 8, 9, 10, 11, 12, 13, 14, 15, 16, 17, 18, 19, 20, 21, 22, 23, 24];
436
437 // When yValues has NaN in it, LineSeries.drawNaNAs can draw them as gaps or closed lines
438 const yValues = [
439 0.3933834,
440 -0.0493884,
441 0.4083136,
442 -0.0458077,
443 -0.5242618,
444 -0.9631066,
445 -0.6873195,
446 NaN,
447 -0.1682597,
448 0.1255406,
449 -0.0313127,
450 -0.3261995,
451 -0.5490017,
452 -0.2462973,
453 0.2475873,
454 0.15,
455 -0.2443795,
456 -0.7002707,
457 NaN,
458 -1.24664,
459 -0.8722853,
460 -1.1531512,
461 -0.7264951,
462 -0.9779677,
463 -0.5377044,
464 ];
465
466 sciChartSurface.renderableSeries.add(
467 new FastLineRenderableSeries(wasmContext, {
468 dataSeries: new XyDataSeries(wasmContext, { xValues, yValues }),
469 strokeThickness: 3,
470 stroke: appTheme.VividTeal,
471 drawNaNAs: ELineDrawMode.DiscontinuousLine,
472 pointMarker: new EllipsePointMarker(wasmContext, {
473 width: 5,
474 height: 5,
475 fill: appTheme.VividTeal,
476 strokeThickness: 0,
477 }),
478 animation: {
479 type: EAnimationType.Fade,
480 options: {
481 duration: 400,
482 delay: 250,
483 onCompleted: () => {
484 // Highlight the gaps with annotations stretched vertically
485 sciChartSurface.annotations.add(
486 new BoxAnnotation({
487 x1: 6,
488 x2: 8,
489 y1: 0.1,
490 y2: 1.0,
491 yCoordinateMode: ECoordinateMode.Relative,
492 fill: appTheme.MutedTeal + "33",
493 strokeThickness: 0,
494 }),
495 new BoxAnnotation({
496 x1: 17,
497 x2: 19,
498 y1: 0.1,
499 y2: 1,
500 yCoordinateMode: ECoordinateMode.Relative,
501 fill: appTheme.MutedTeal + "33",
502 strokeThickness: 0,
503 })
504 );
505 },
506 },
507 },
508 })
509 );
510
511 return { sciChartSurface, wasmContext };
512 };
513
514 const initThresholdedLineCharts = async (rootElement: string | HTMLDivElement) => {
515 const { sciChartSurface, wasmContext } = await createChartCommon(rootElement, "Thresholded Line Charts");
516
517 const { xValues, yValues } = new RandomWalkGenerator().Seed(1337).getRandomWalkSeries(50);
518
519 const THRESHOLD_HIGH_LEVEL = 0;
520 const THRESHOLD_LOW_LEVEL = -2;
521 const THRESHOLD_LOW_COLOR_ARGB = parseColorToUIntArgb(appTheme.VividPink);
522 const THRESHOLD_HIGH_COLOR_ARGB = parseColorToUIntArgb(appTheme.VividTeal);
523
524 // PaletteProvider API allows for per-point colouring, filling of points based on a rule
525 // see PaletteProvider API for more details
526 const paletteProvider: IStrokePaletteProvider = {
527 strokePaletteMode: EStrokePaletteMode.GRADIENT,
528 onAttached(parentSeries: IRenderableSeries): void {},
529 onDetached(): void {},
530 // This function called once per data-point. Colors returned must be in ARGB format (uint) e.g. 0xFF0000FF is Red
531 overrideStrokeArgb(
532 xValue: number,
533 yValue: number,
534 index: number,
535 opacity?: number,
536 metadata?: IPointMetadata
537 ): number {
538 if (yValue < THRESHOLD_LOW_LEVEL) {
539 return THRESHOLD_LOW_COLOR_ARGB;
540 }
541 if (yValue > THRESHOLD_HIGH_LEVEL) {
542 return THRESHOLD_HIGH_COLOR_ARGB;
543 }
544 // Undefined means use default series stroke on this data-point
545 return undefined;
546 },
547 };
548
549 // Create a line series with threshold palette provider
550 sciChartSurface.renderableSeries.add(
551 new FastLineRenderableSeries(wasmContext, {
552 dataSeries: new XyDataSeries(wasmContext, { xValues, yValues }),
553 strokeThickness: 3,
554 stroke: appTheme.VividOrange,
555 // paletteprovider allows per-point colouring
556 paletteProvider,
557 // Datalabels may be shown using this property
558 dataLabels: {
559 style: { fontFamily: "Arial", fontSize: 8 },
560 color: appTheme.PaleSkyBlue,
561 skipMode: EDataLabelSkipMode.SkipIfOverlapPrevious,
562 },
563 animation: {
564 type: EAnimationType.Wave,
565 options: {
566 duration: 400,
567 delay: 250,
568 onCompleted: () => {
569 // Add annotations to show the thresholds
570 sciChartSurface.annotations.add(
571 new HorizontalLineAnnotation({
572 stroke: appTheme.VividTeal,
573 strokeDashArray: [2, 2],
574 y1: THRESHOLD_HIGH_LEVEL,
575 labelPlacement: ELabelPlacement.TopRight,
576 labelValue: "High warning",
577 axisLabelFill: appTheme.VividTeal,
578 showLabel: true,
579 })
580 );
581 sciChartSurface.annotations.add(
582 new HorizontalLineAnnotation({
583 stroke: appTheme.VividPink,
584 strokeDashArray: [2, 2],
585 labelPlacement: ELabelPlacement.BottomLeft,
586 y1: THRESHOLD_LOW_LEVEL,
587 labelValue: "Low warning",
588 axisLabelFill: appTheme.VividPink,
589 showLabel: true,
590 })
591 );
592 },
593 },
594 },
595 })
596 );
597
598 return { sciChartSurface, wasmContext };
599 };
600
601 return {
602 initJustLineCharts,
603 initDigitalLineCharts,
604 initTooltipsOnLineCharts,
605 initDashedLineCharts,
606 initPalettedLineCharts,
607 initHoveredLineCharts,
608 initGapsInLineCharts,
609 initVerticalLineCharts,
610 initThresholdedLineCharts,
611 };
612};
613See Also: JavaScript Chart Types (28 Demos)
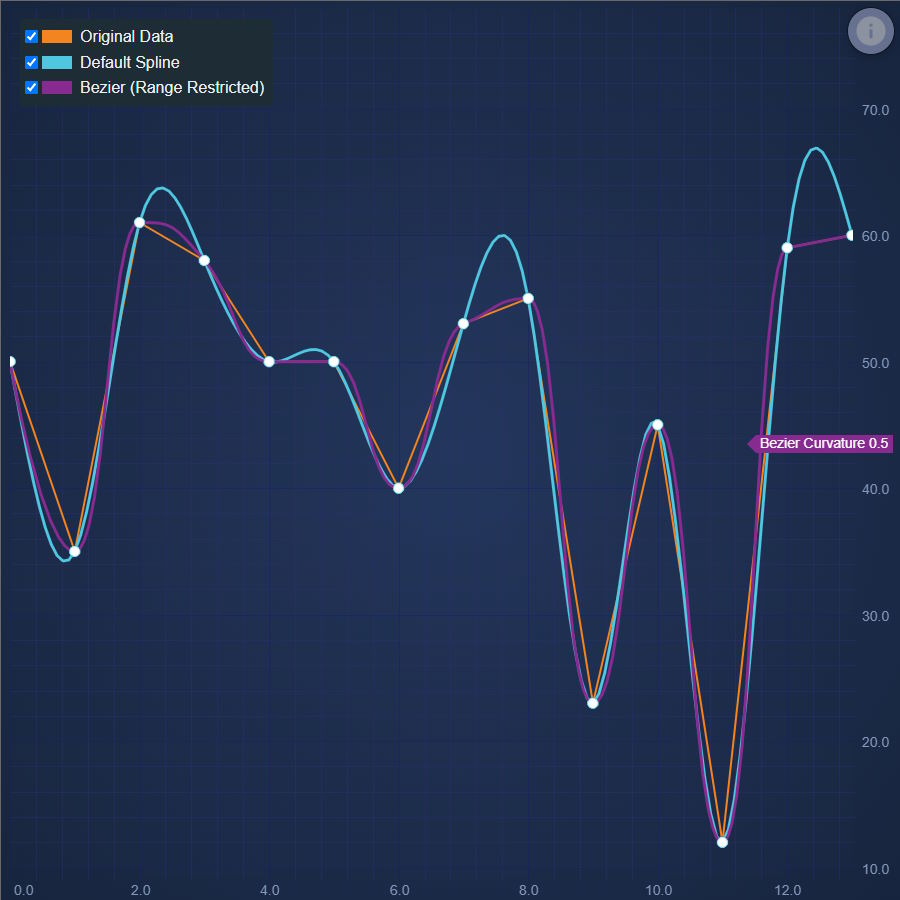
React Spline Line Chart
Discover how to create a React Spline Line Chart with SciChart. Demo includes algorithm for smoother lines. Get your free trial now.
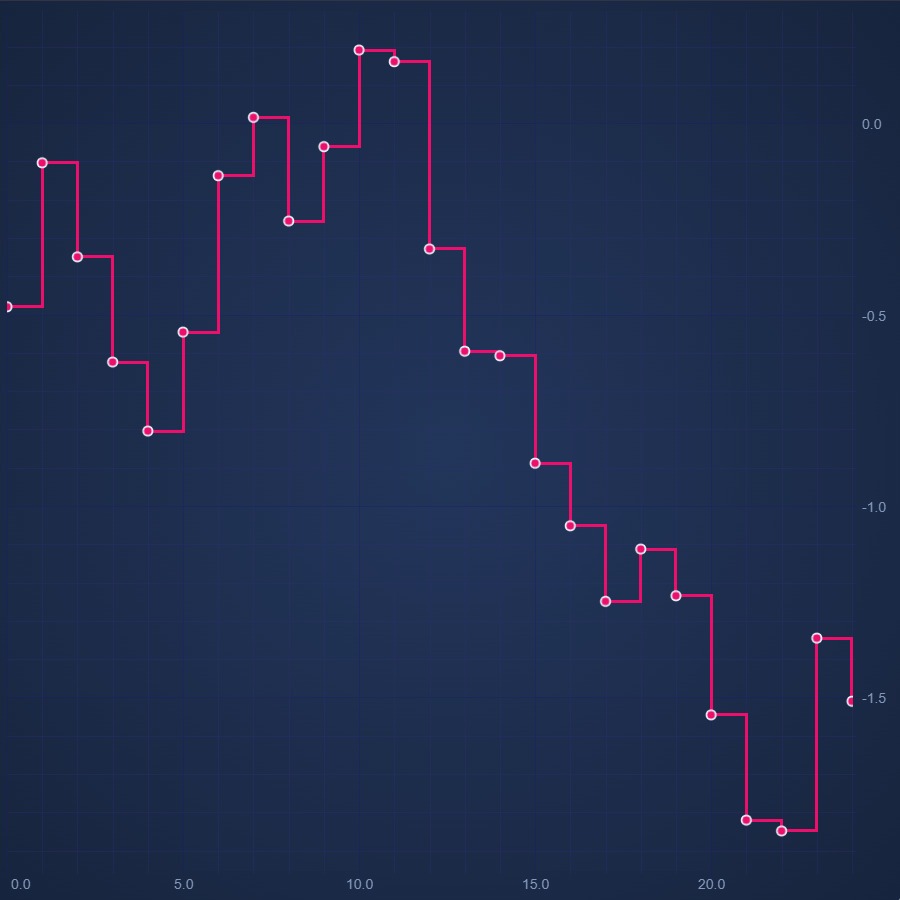
React Digital Line Chart
Discover how to create a React Digital Line Chart with SciChart - your feature-rich JavaScript Chart Library. Get your free demo now.
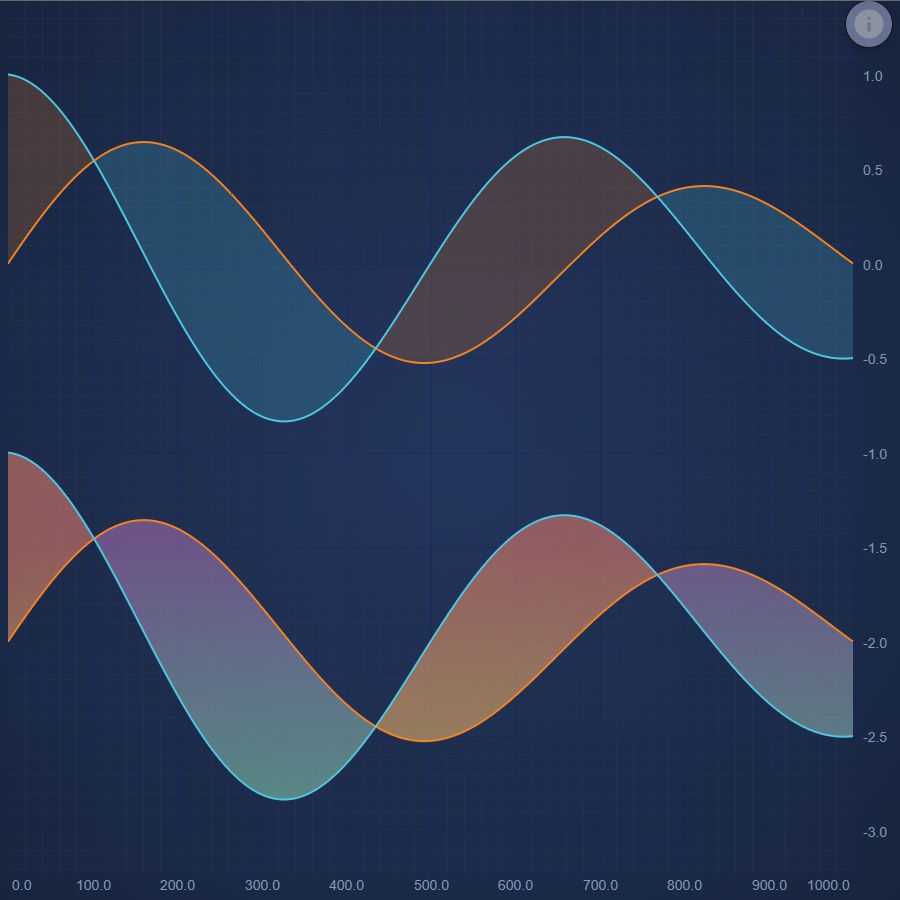
React Band Chart
Easily create a React Band Chart or High-Low Fill with SciChart - high performance JavaScript Chart Library. Get your free trial now.
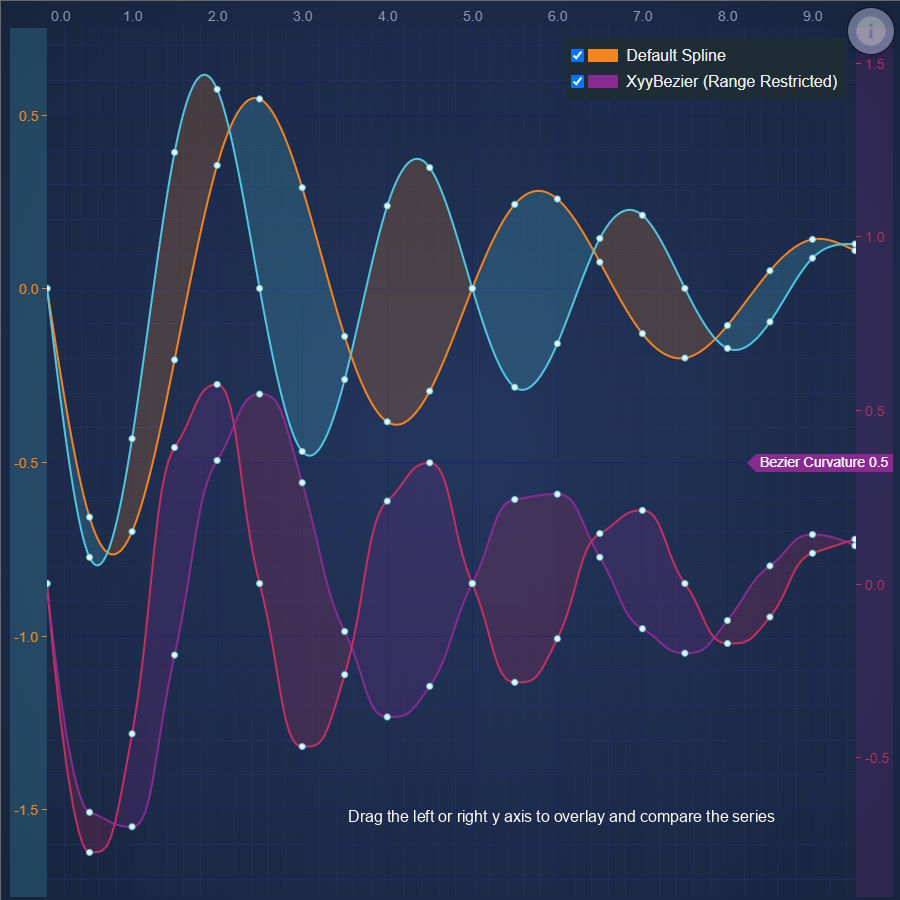
React Spline Band Chart
SciChart's React Spline Band Chart makes it easy to draw thresholds or fills between two lines on a chart. Get your free demo today.
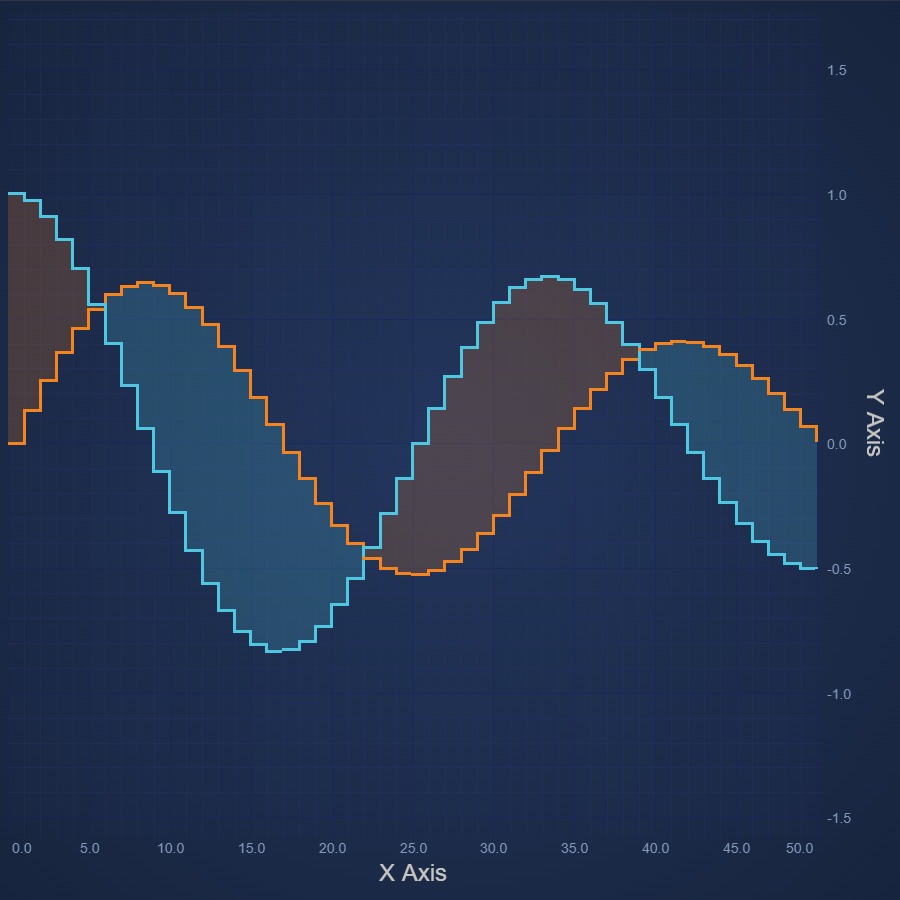
React Digital Band Chart
Learn how to create a React Digital Band Chart or High-Low Fill Chart with SciChart's easy-to-follow demos. Get your free trial today.
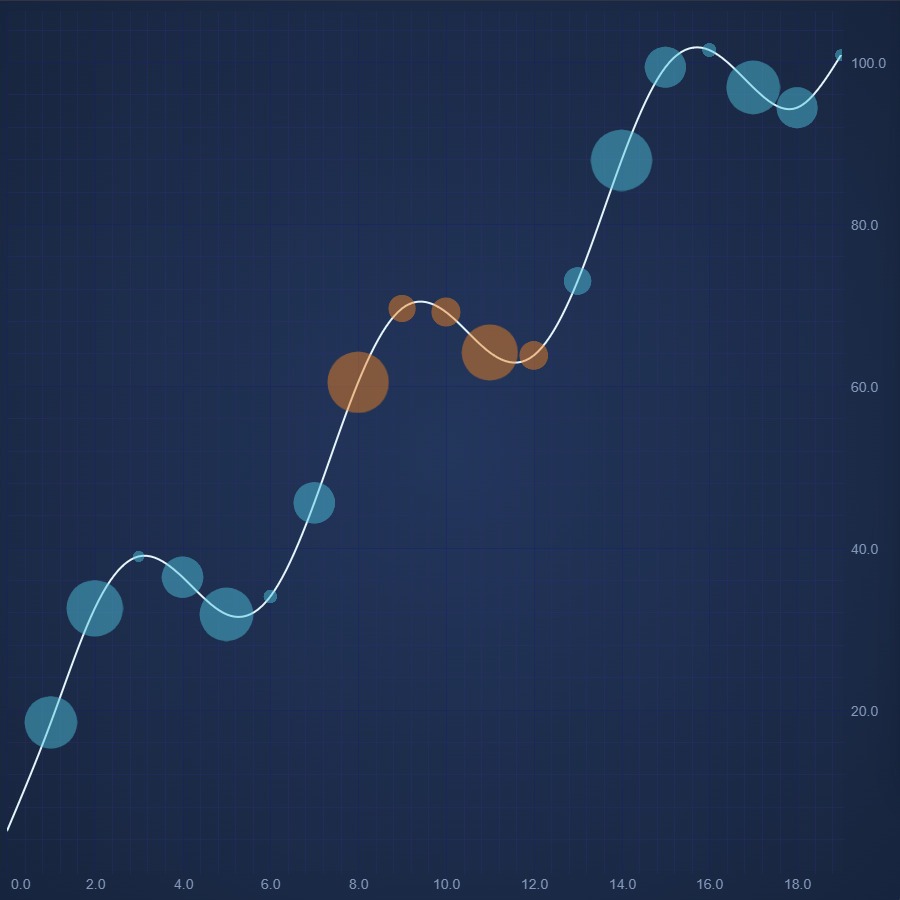
React Bubble Chart
Create a high performance React Bubble Chart with Sci-Chart. Demo shows how to draw point-markers at X,Y locations. Get your free demo now.

React Candlestick Chart
Discover how to create a React Candlestick Chart or Stock Chart using SciChart.js. For high Performance JavaScript Charts, get your free demo now.
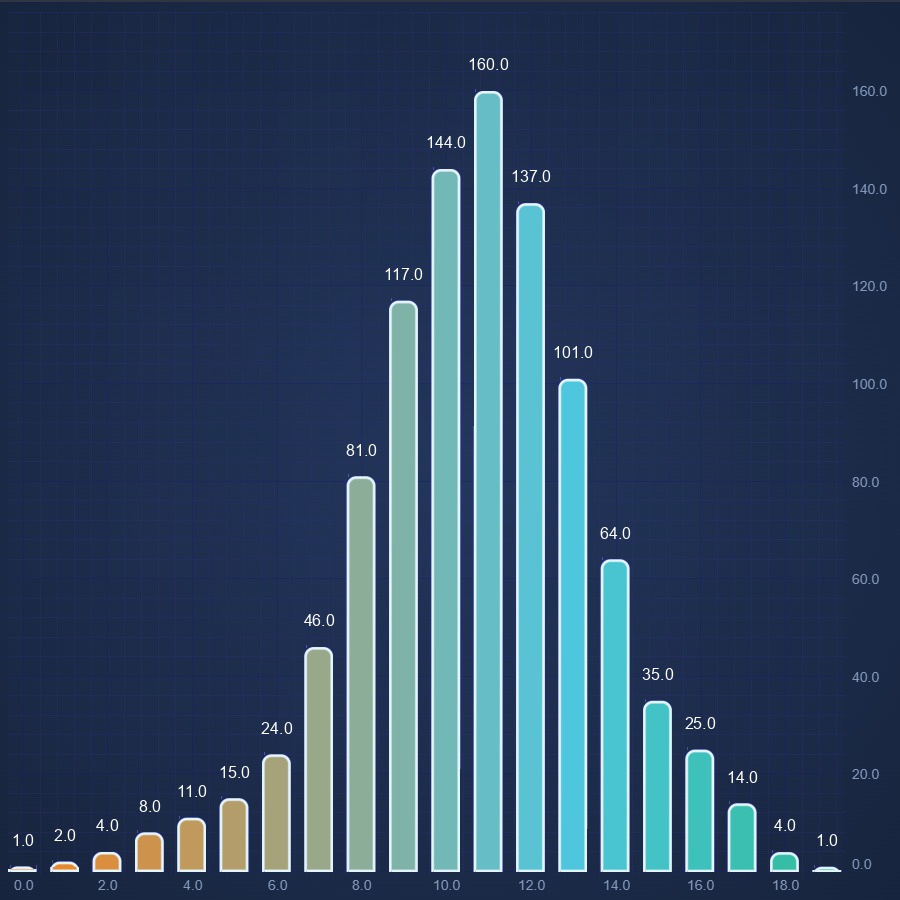
React Column Chart
React Column Chart demo by SciChart supports gradient fill and paletteproviders for more custom coloring options. Get your free demo now.
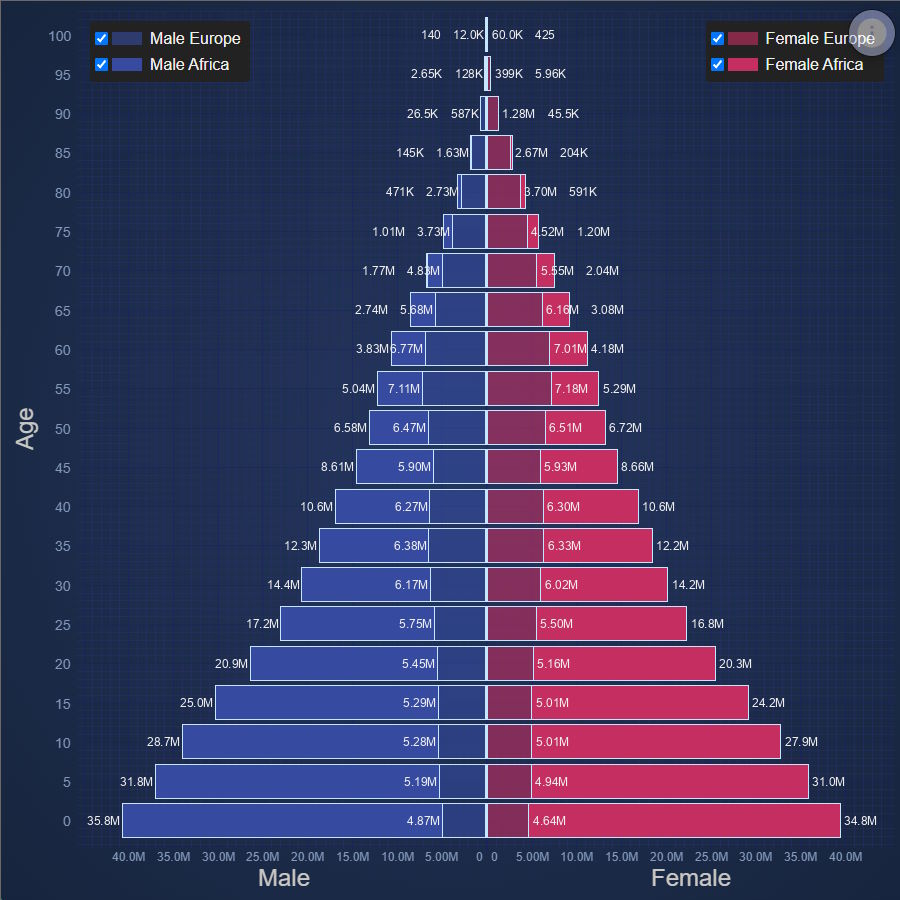
React Population Pyramid
Population Pyramid of Europe and Africa
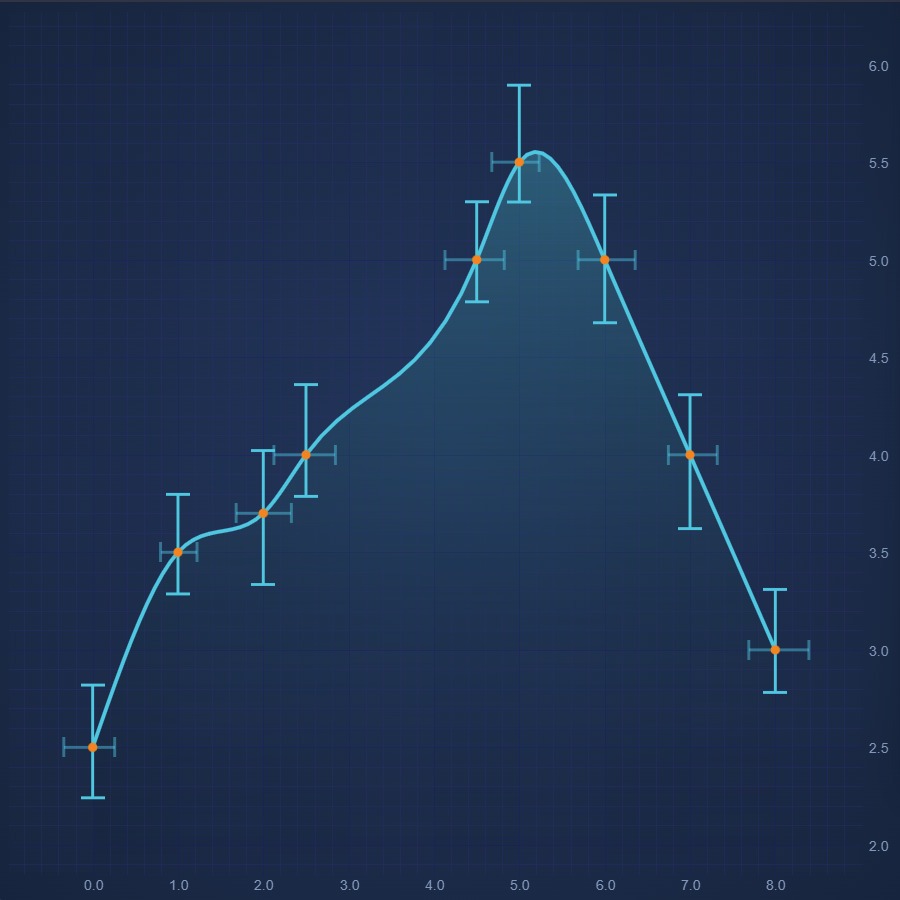
React Error Bars Chart
Create React Error Bars Chart using high performance SciChart.js. Display uncertainty or statistical confidence of a data-point. Get free demo now.
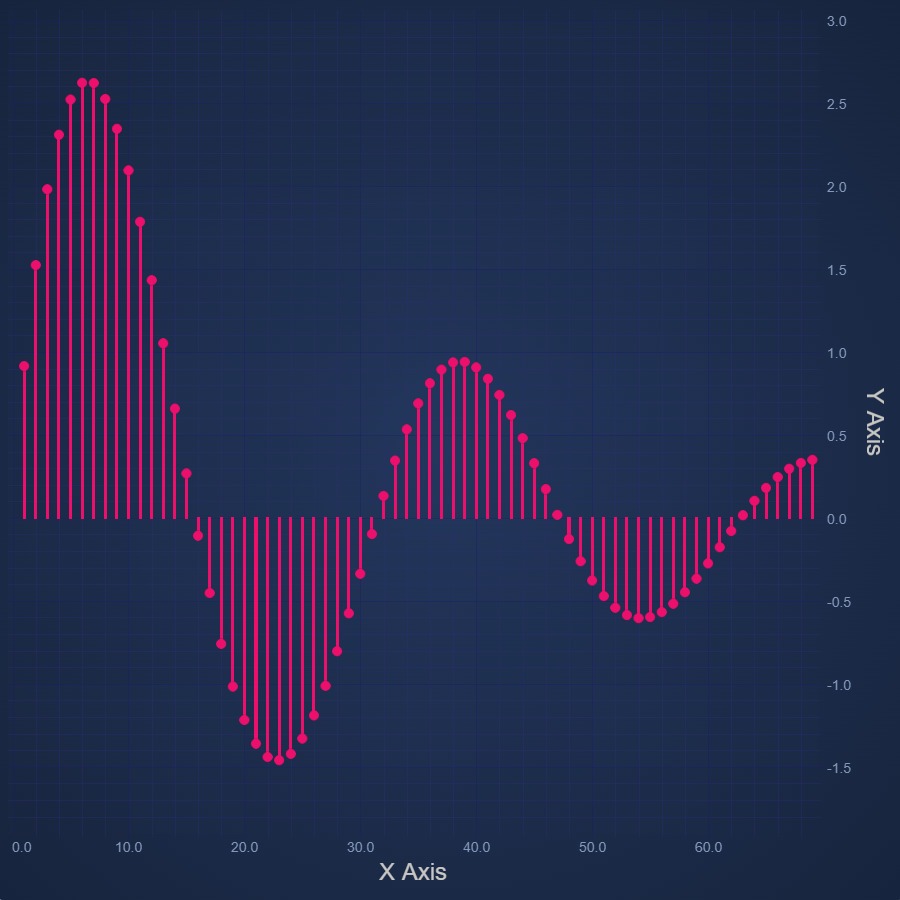
React Impulse Chart
Easily create React Impulse Chart or Stem Chart using SciChart.js - our own high performance JavaScript Chart Library. Get your free trial now.
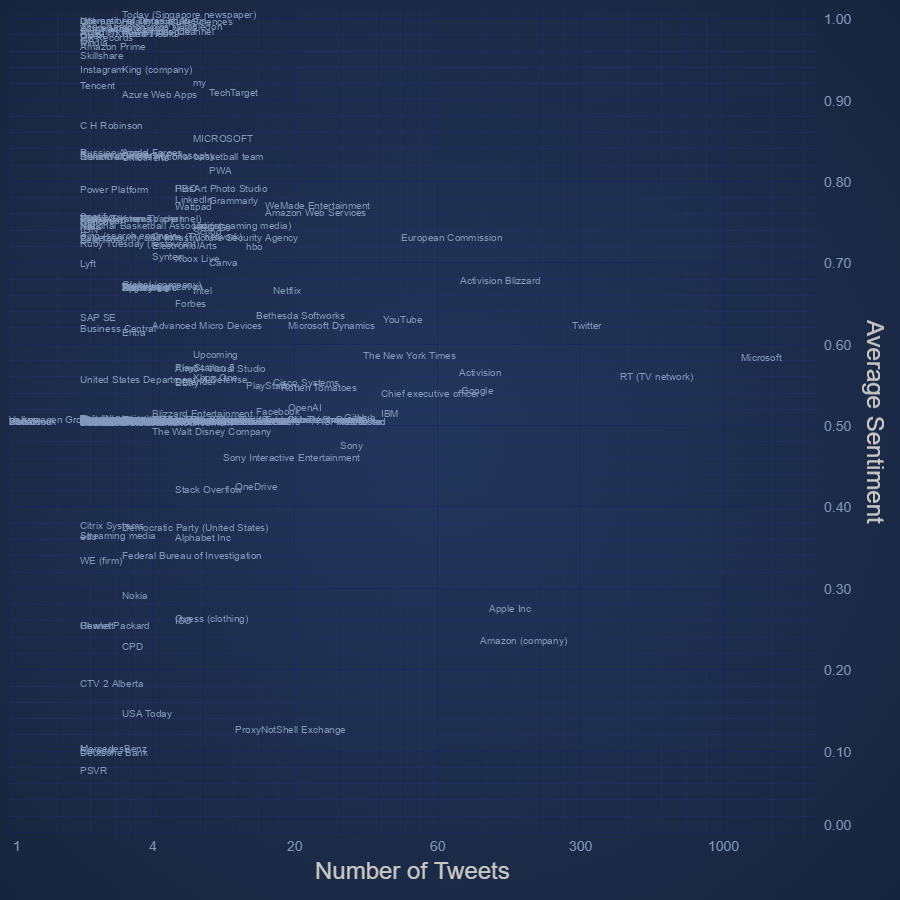
React Text Chart
Create React Text Chart with high performance SciChart.js.
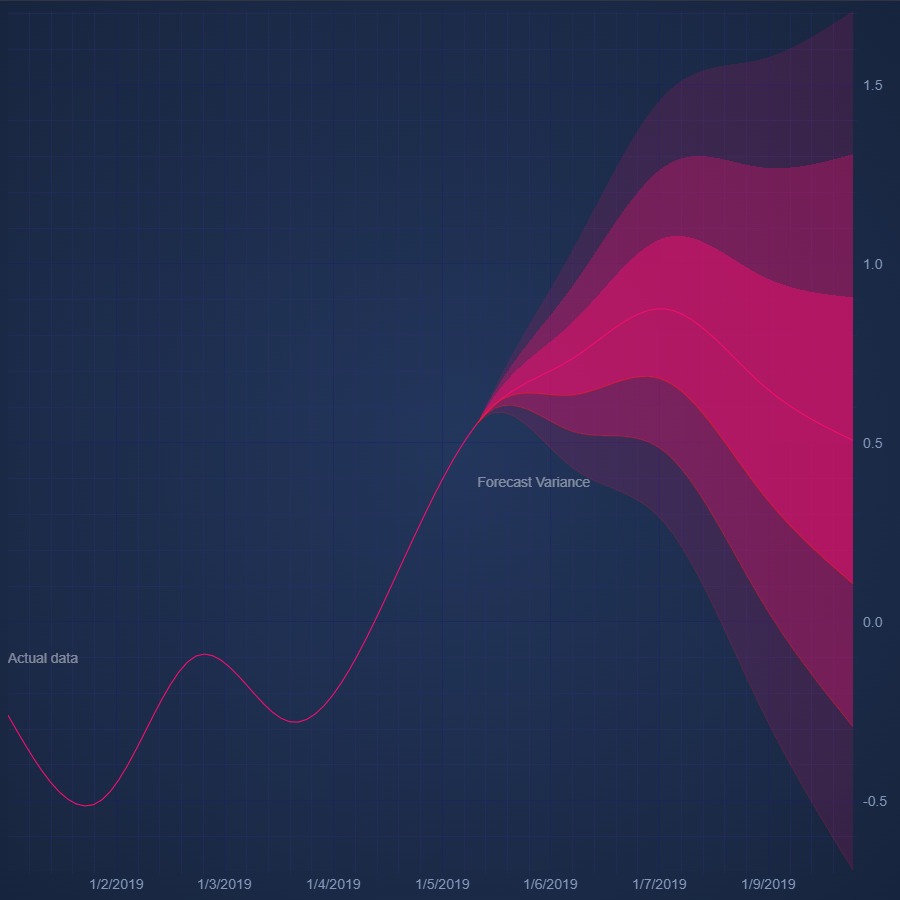
React Fan Chart
Discover how to create React Fan Chart with SciChart. Zoom in to see the detail you can go to using our JavaScript Charts. Get your free demo today.

React Heatmap Chart
Easily create a high performance React Heatmap Chart with SciChart. Get your free trial of our 5-star rated JavaScript Chart Component today.
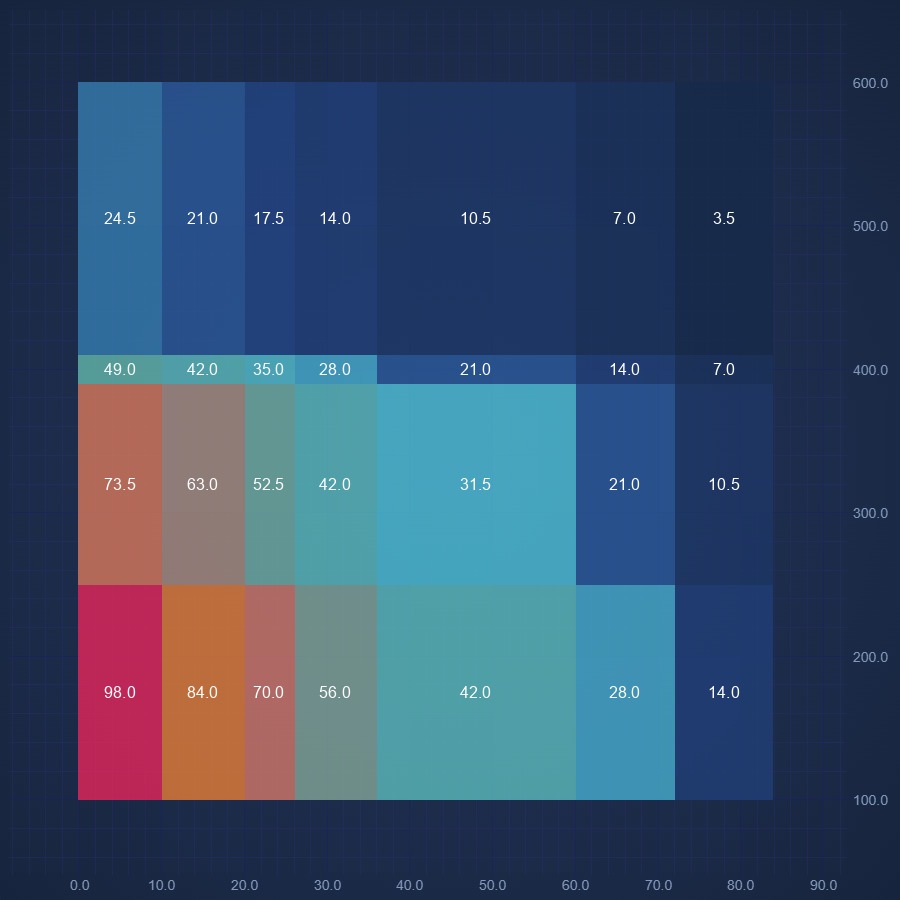
React Non Uniform Heatmap Chart
Create React Non Uniform Chart using high performance SciChart.js. Display Heatmap with variable cell sizes. Get free demo now.
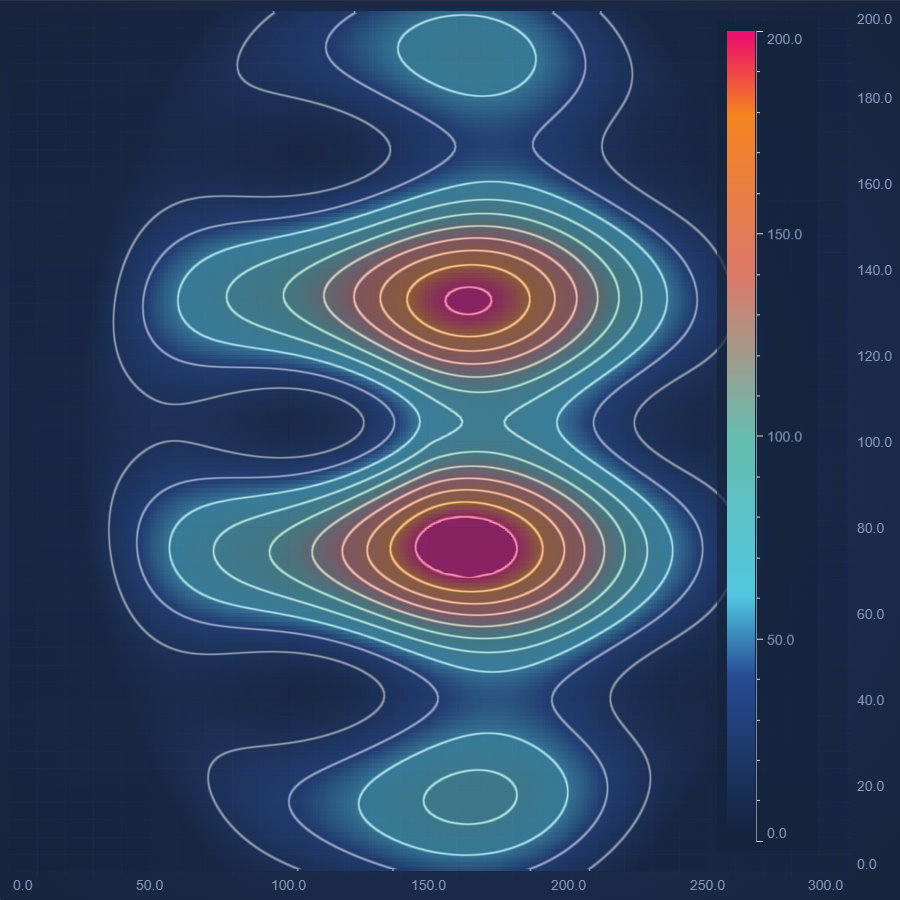
React Heatmap Chart With Contours
Design a highly dynamic React Heatmap Chart With Contours with SciChart's feature-rich JavaScript Chart Library. Get your free demo today.
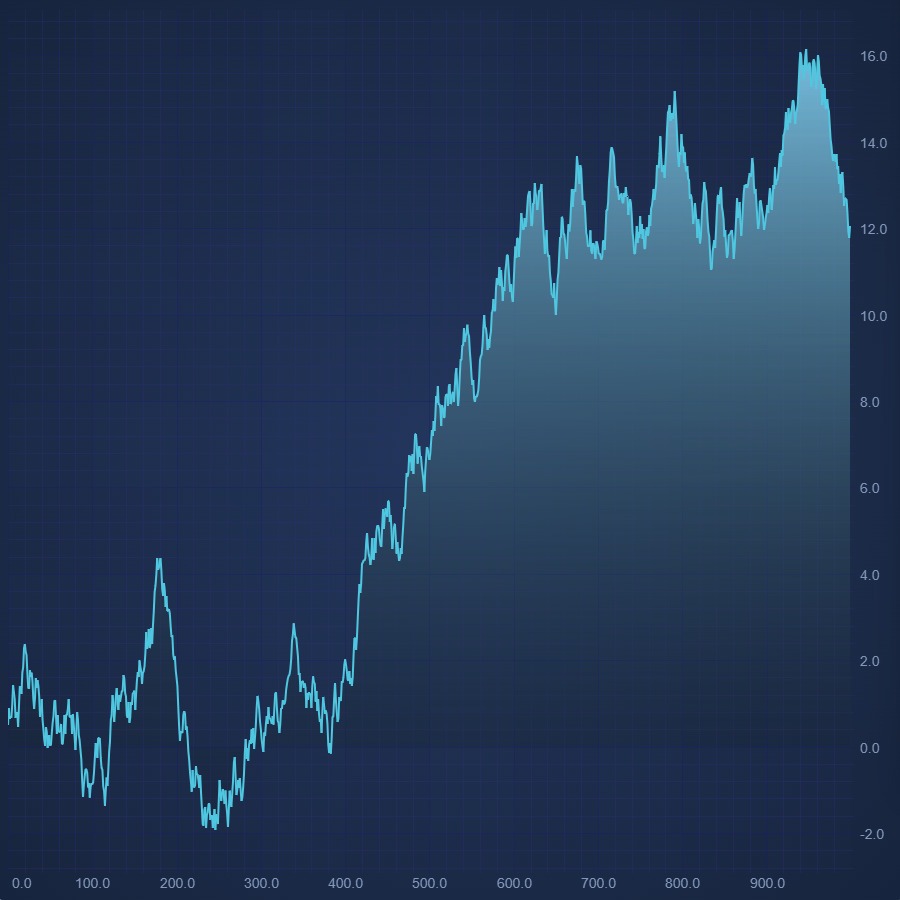
React Mountain Chart
Create React Mountain Chart with SciChart.js. Zero line can be zero or a specific value. Fill color can be solid or gradient as well. Get a free demo now.
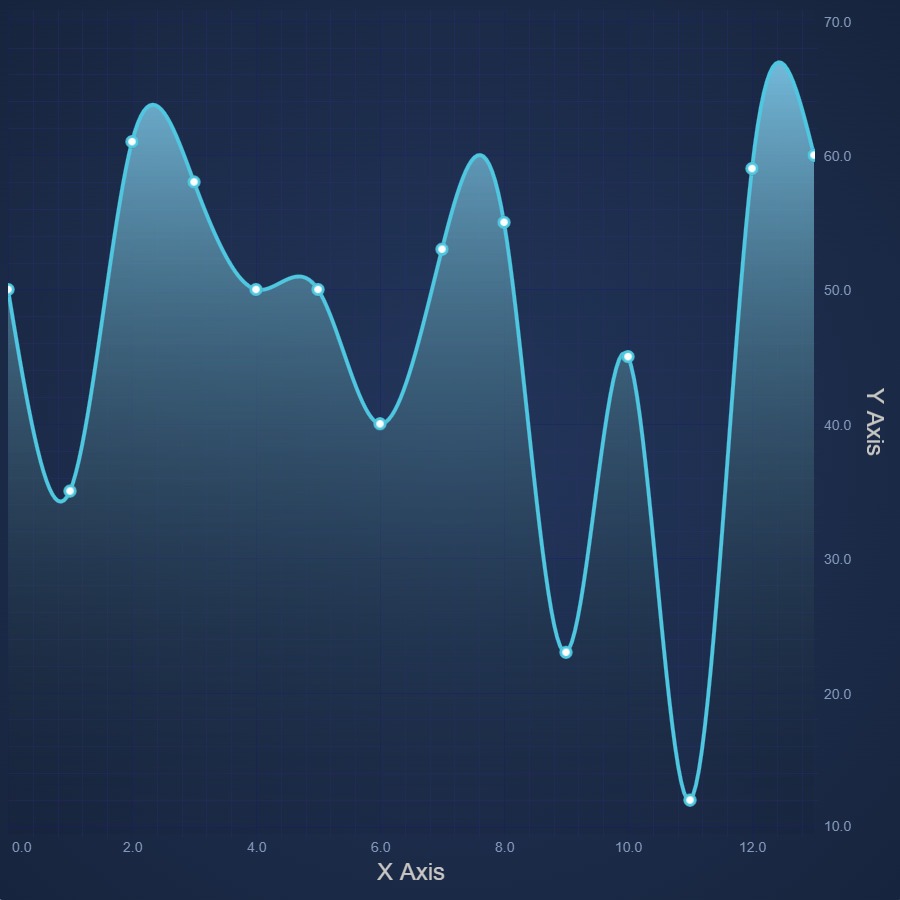
React Spline Mountain Chart
React Spline Mountain Chart design made easy. Use SciChart.js' JavaScript Charts for high performance, feature-rich designs. Get free demo now.
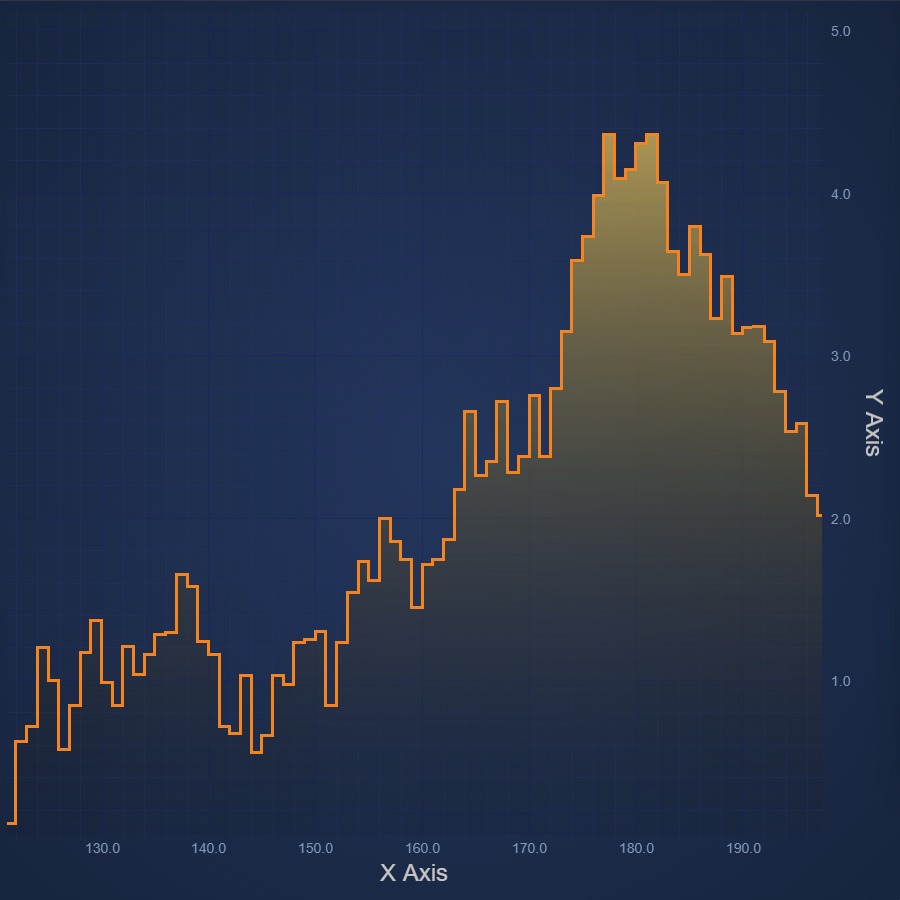
React Digital Mountain Chart
Create React Digital Mountain Chart with a stepped-line visual effect. Get your free trial of SciChart's 5-star rated JavaScript Chart Component now.
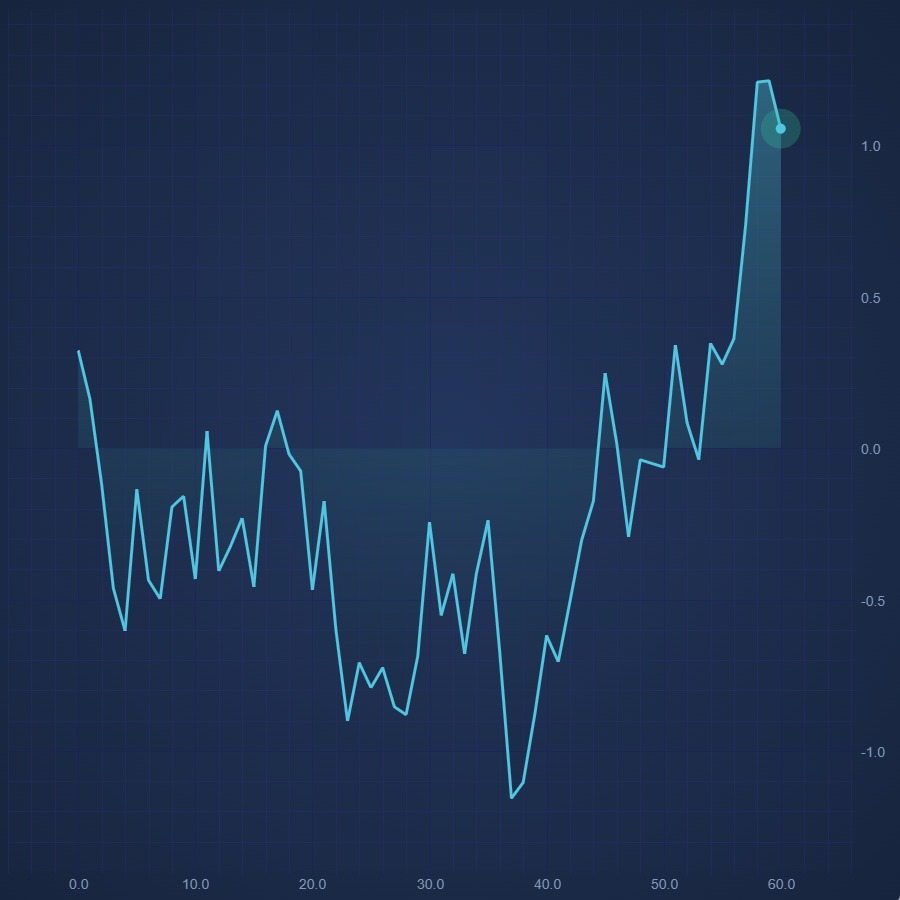
React Realtime Mountain Chart
React Realtime Mountain Chart made easy. Add animated, real-time updates with SciChart.js - high performance JavaScript Charts. Get free trial now.
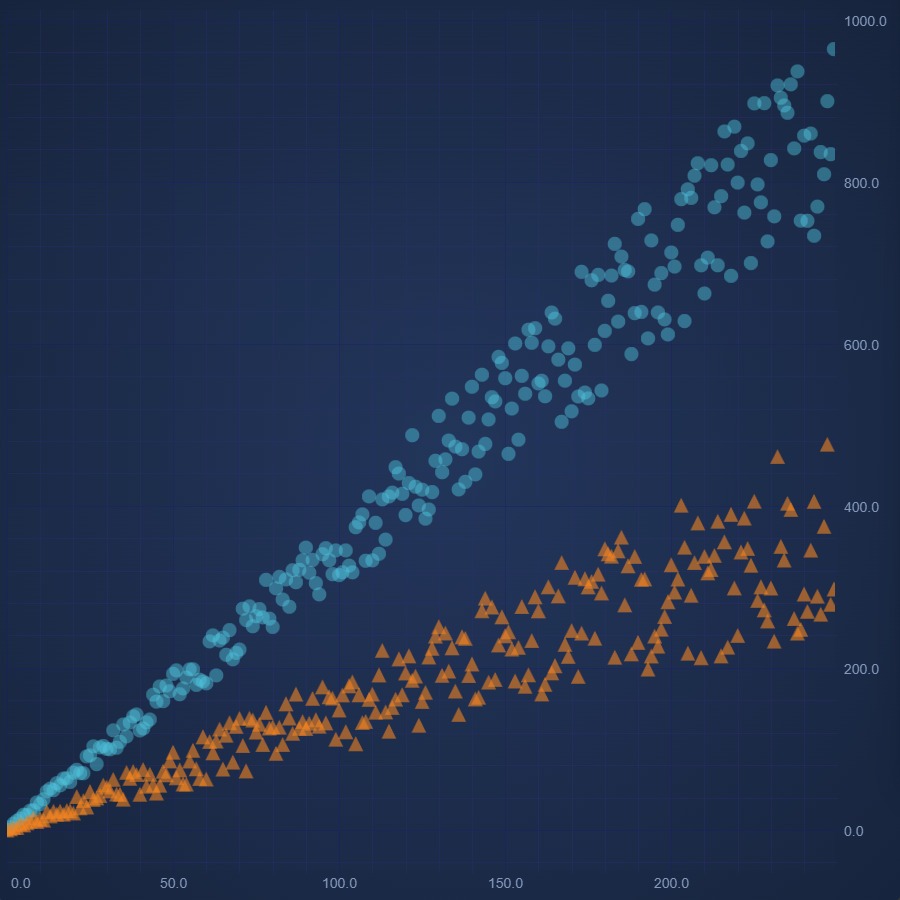
React Scatter Chart
Create React Scatter Chart with high performance SciChart.js. Easily render pre-defined point types. Supports custom shapes. Get your free trial now.
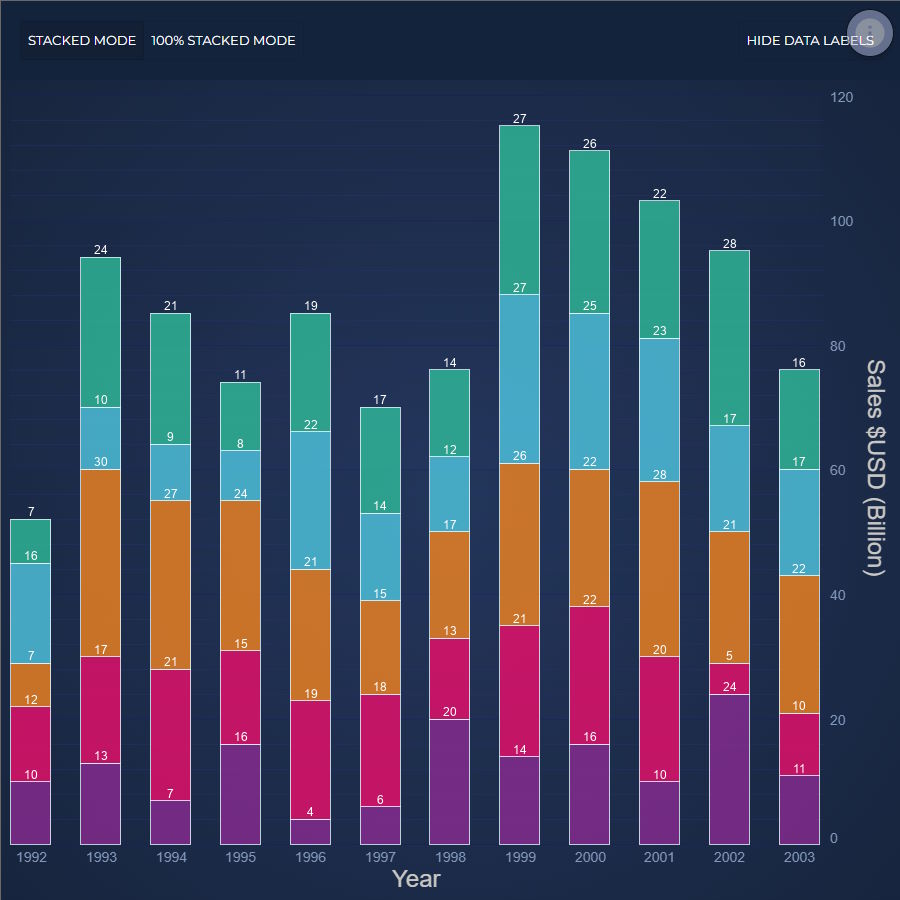
React Stacked Column Chart
Discover how to create a React Stacked Column Chart using our feature-rich JavaScript Chart Library, SciChart.js. Get your free demo today!
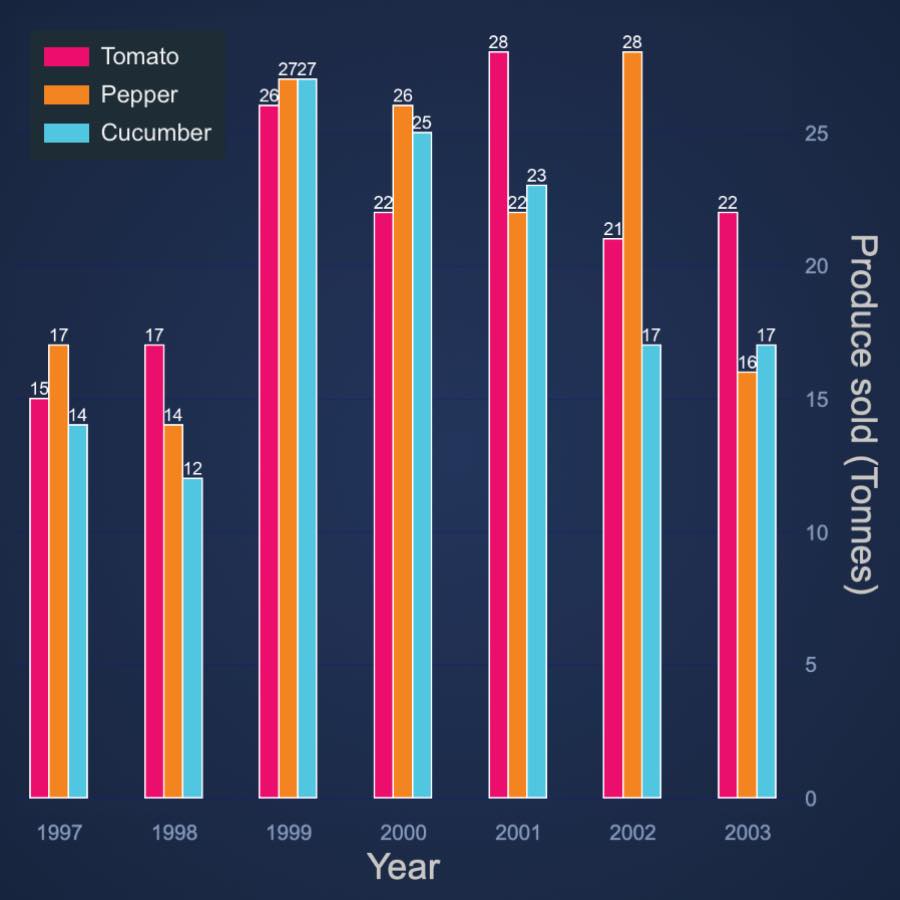
React Stacked Column Side by Side
Design React Stacked Group Column Chart side-by-side using our 5-star rated JavaScript Chart Framework, SciChart.js. Get your free demo now.
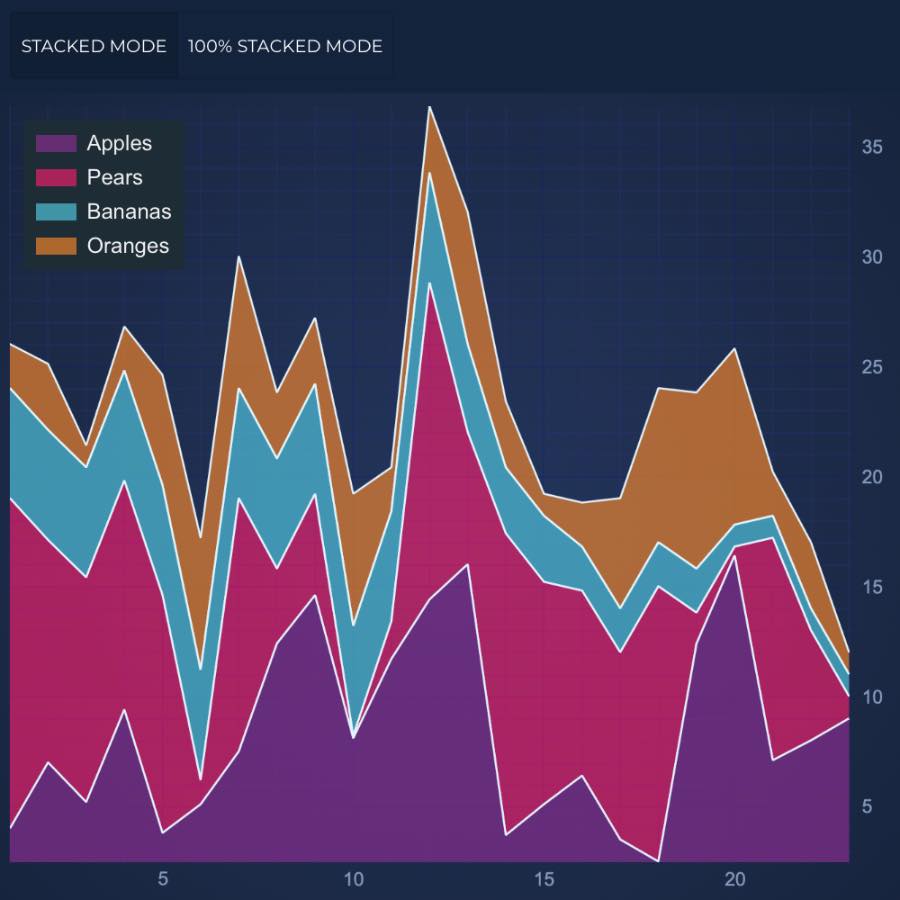
React Stacked Mountain Chart
Design a high performance React Stacked Mountain Chart with SciChart.js - your one-stop JavaScript chart library. Get free demo now to get started.
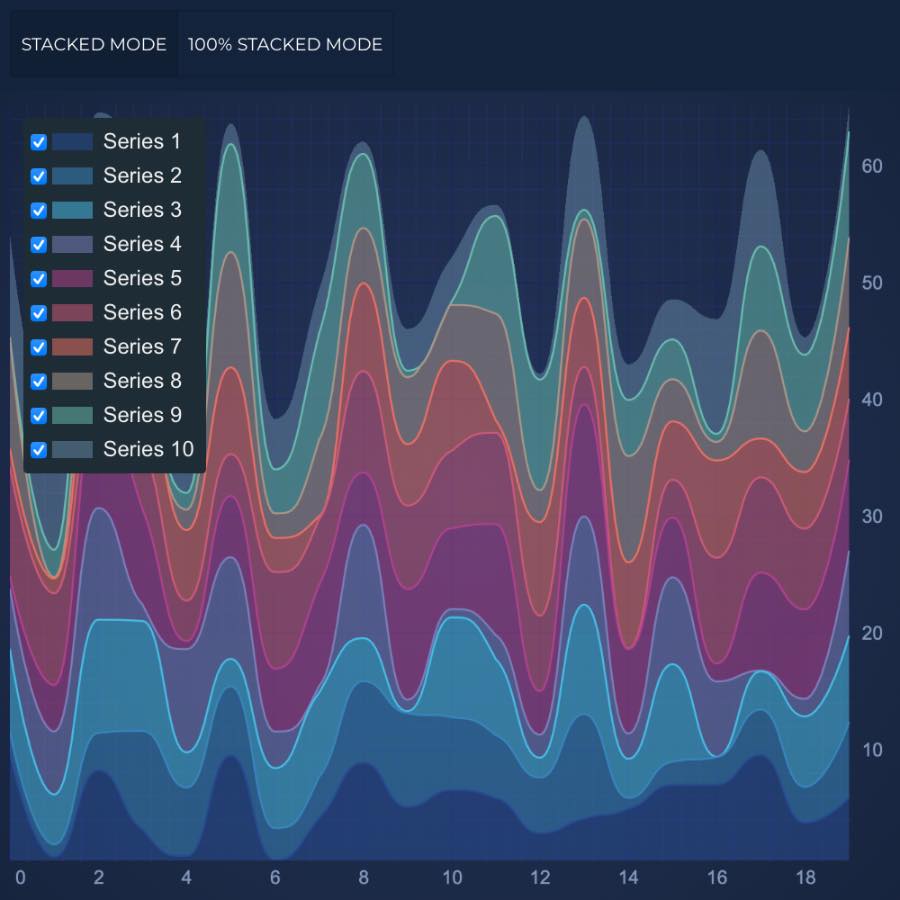
React Smooth Stacked Mountain Chart
Design a high performance React Stacked Mountain Chart with SciChart.js - your one-stop JavaScript chart library. Get free demo now to get started.
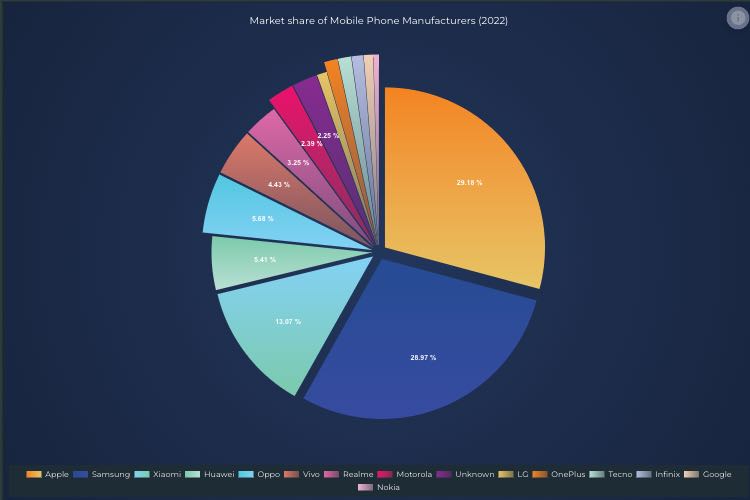
React Pie Chart
Easily create and customise a high performance React Pie Chart with 5-star rated SciChart.js. Get your free trial now to access the whole library.
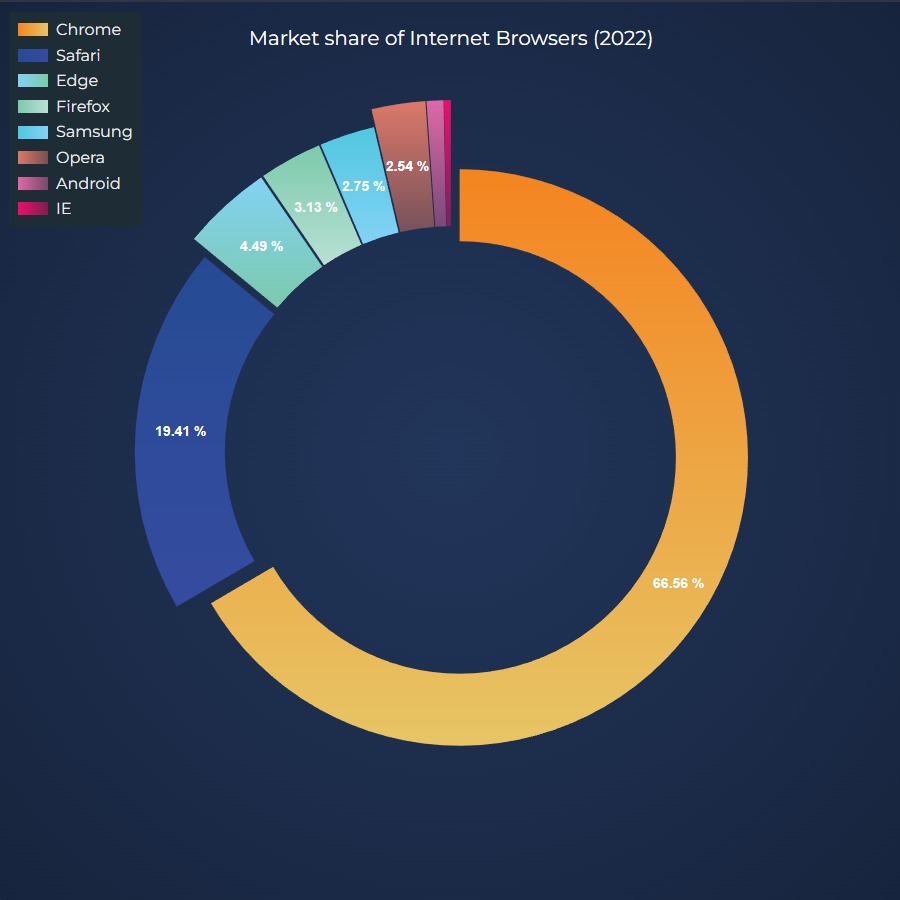
React Donut Chart
Create React Donut Chart with 5-star rated SciChart.js chart library. Supports legends, text labels, animated updates and more. Get free trial now.
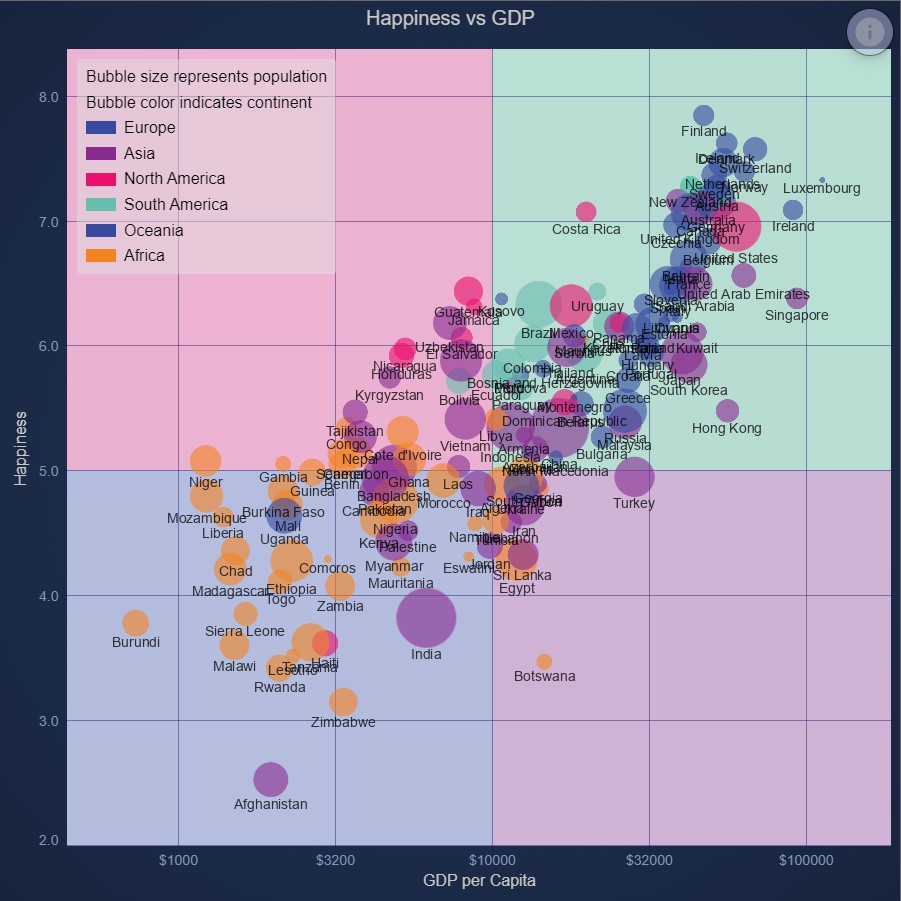
React Quadrant Chart using Background Annotations
Demonstrates how to color areas of the chart surface using background Annotations using SciChart.js Annotations API