Using CursorModifier Crosshairs
Demonstrates how to create crosshairs on mouseover using SciChart.js, High Performance JavaScript Charts
drawExample.ts
index.html
vanilla.ts
ExampleDataProvider.ts
theme.ts
1import { appTheme } from "../../../theme";
2import { ExampleDataProvider } from "../../../ExampleData/ExampleDataProvider";
3import {
4    NumericAxis,
5    NumberRange,
6    SciChartSurface,
7    XyDataSeries,
8    ENumericFormat,
9    FastLineRenderableSeries,
10    EllipsePointMarker,
11    CursorModifier,
12    ZoomPanModifier,
13    ZoomExtentsModifier,
14    MouseWheelZoomModifier,
15    SeriesInfo,
16    CursorTooltipSvgAnnotation,
17} from "scichart";
18
19export const drawExample = async (rootElement: string | HTMLDivElement) => {
20    // Create a SciChartSurface with X,Y Axis
21    const { sciChartSurface, wasmContext } = await SciChartSurface.create(rootElement, {
22        theme: appTheme.SciChartJsTheme,
23    });
24
25    sciChartSurface.xAxes.add(
26        new NumericAxis(wasmContext, {
27            growBy: new NumberRange(0.05, 0.05),
28            labelFormat: ENumericFormat.Decimal,
29            labelPrecision: 4,
30        })
31    );
32
33    sciChartSurface.yAxes.add(
34        new NumericAxis(wasmContext, {
35            growBy: new NumberRange(0.1, 0.1),
36            labelFormat: ENumericFormat.Decimal,
37            labelPrecision: 4,
38        })
39    );
40
41    // Add some data
42    const data1 = ExampleDataProvider.getFourierSeriesZoomed(0.6, 0.13, 5.0, 5.15);
43    sciChartSurface.renderableSeries.add(
44        new FastLineRenderableSeries(wasmContext, {
45            dataSeries: new XyDataSeries(wasmContext, {
46                xValues: data1.xValues,
47                yValues: data1.yValues,
48                dataSeriesName: "First Line Series",
49            }),
50            strokeThickness: 3,
51            stroke: appTheme.VividSkyBlue,
52            pointMarker: new EllipsePointMarker(wasmContext, {
53                width: 7,
54                height: 7,
55                strokeThickness: 0,
56                fill: appTheme.VividSkyBlue,
57            }),
58        })
59    );
60
61    const data2 = ExampleDataProvider.getFourierSeriesZoomed(0.5, 0.12, 5.0, 5.15);
62    sciChartSurface.renderableSeries.add(
63        new FastLineRenderableSeries(wasmContext, {
64            dataSeries: new XyDataSeries(wasmContext, {
65                xValues: data2.xValues,
66                yValues: data2.yValues,
67                dataSeriesName: "Second Line Series",
68            }),
69            strokeThickness: 3,
70            stroke: appTheme.VividOrange,
71            pointMarker: new EllipsePointMarker(wasmContext, {
72                width: 7,
73                height: 7,
74                strokeThickness: 0,
75                fill: appTheme.VividOrange,
76            }),
77        })
78    );
79
80    const data3 = ExampleDataProvider.getFourierSeriesZoomed(0.4, 0.11, 5.0, 5.15);
81    sciChartSurface.renderableSeries.add(
82        new FastLineRenderableSeries(wasmContext, {
83            dataSeries: new XyDataSeries(wasmContext, {
84                xValues: data3.xValues,
85                yValues: data3.yValues,
86                dataSeriesName: "Third Line Series",
87            }),
88            strokeThickness: 3,
89            stroke: appTheme.MutedPink,
90            pointMarker: new EllipsePointMarker(wasmContext, {
91                width: 7,
92                height: 7,
93                strokeThickness: 0,
94                fill: appTheme.MutedPink,
95            }),
96        })
97    );
98
99    // Here is where we add cursor behaviour
100    //
101    sciChartSurface.chartModifiers.add(
102        // Add the CursorModifier (crosshairs) behaviour
103        new CursorModifier({
104            // Defines if crosshair is shown
105            crosshairStroke: appTheme.VividOrange,
106            crosshairStrokeThickness: 1,
107            showXLine: true,
108            showYLine: true,
109            // Shows the default tooltip
110            showTooltip: true,
111            tooltipContainerBackground: appTheme.VividOrange,
112            tooltipTextStroke: appTheme.ForegroundColor,
113            // Defines the axis label colours
114            axisLabelFill: appTheme.VividOrange,
115            axisLabelStroke: appTheme.ForegroundColor,
116            // Shows an additional legend in top left of the screen
117            tooltipLegendTemplate: getTooltipLegendTemplate,
118        }),
119        // Add further zooming and panning behaviours
120        new ZoomPanModifier({ enableZoom: true }),
121        new ZoomExtentsModifier(),
122        new MouseWheelZoomModifier()
123    );
124
125    return { sciChartSurface, wasmContext };
126};
127
128// Override the standard tooltip displayed by CursorModifier
129const getTooltipLegendTemplate = (seriesInfos: SeriesInfo[], svgAnnotation: CursorTooltipSvgAnnotation) => {
130    let outputSvgString = "";
131
132    // Foreach series there will be a seriesInfo supplied by SciChart. This contains info about the series under the house
133    seriesInfos.forEach((seriesInfo, index) => {
134        const lineHeight = 30;
135        const y = 20 + index * lineHeight;
136        // Use the series stroke for legend text colour
137        const textColor = seriesInfo.stroke;
138        // Use the seriesInfo formattedX/YValue for text on the
139        outputSvgString += `<text x="8" y="${y}" font-size="16" font-family="Verdana" fill="${textColor}">
140            ${seriesInfo.seriesName}: X=${seriesInfo.formattedXValue}, Y=${seriesInfo.formattedYValue}
141        </text>`;
142    });
143
144    return `<svg width="100%" height="100%">
145                ${outputSvgString}
146            </svg>`;
147};
148
See Also: Tooltips and Hit-Test (6 Demos)
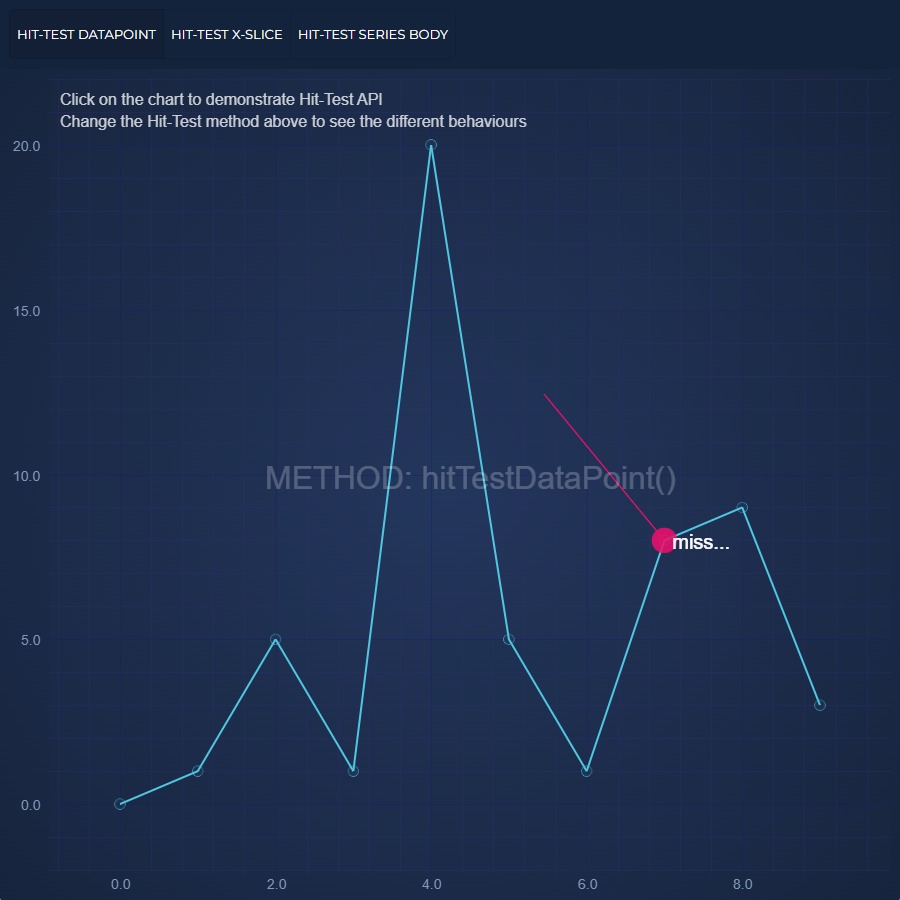
JavaScript Chart Hit-Test API
Demonstrates Hit-Testing a JavaScript Chart - point and click on the chart and get feedback about what data-points were clicked
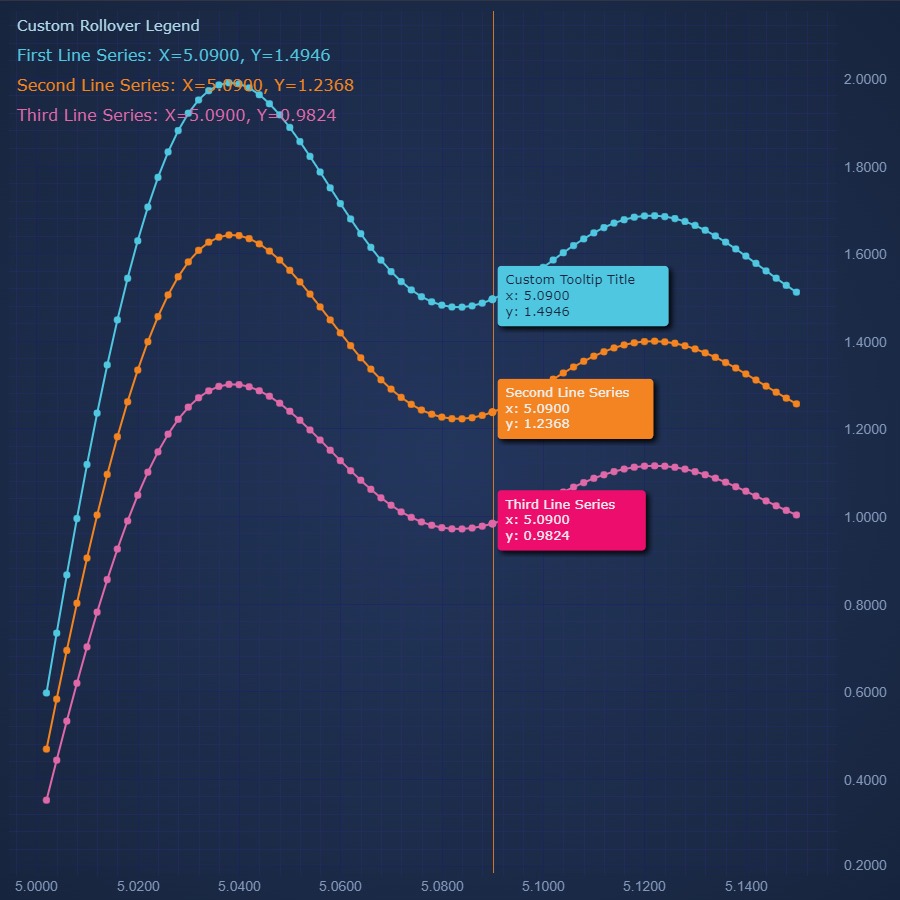
Using Rollover Modifier Tooltips
Demonstrates adding Tooltips on mouse-move to a JavaScript Chart with SciChart.js RolloverModifier
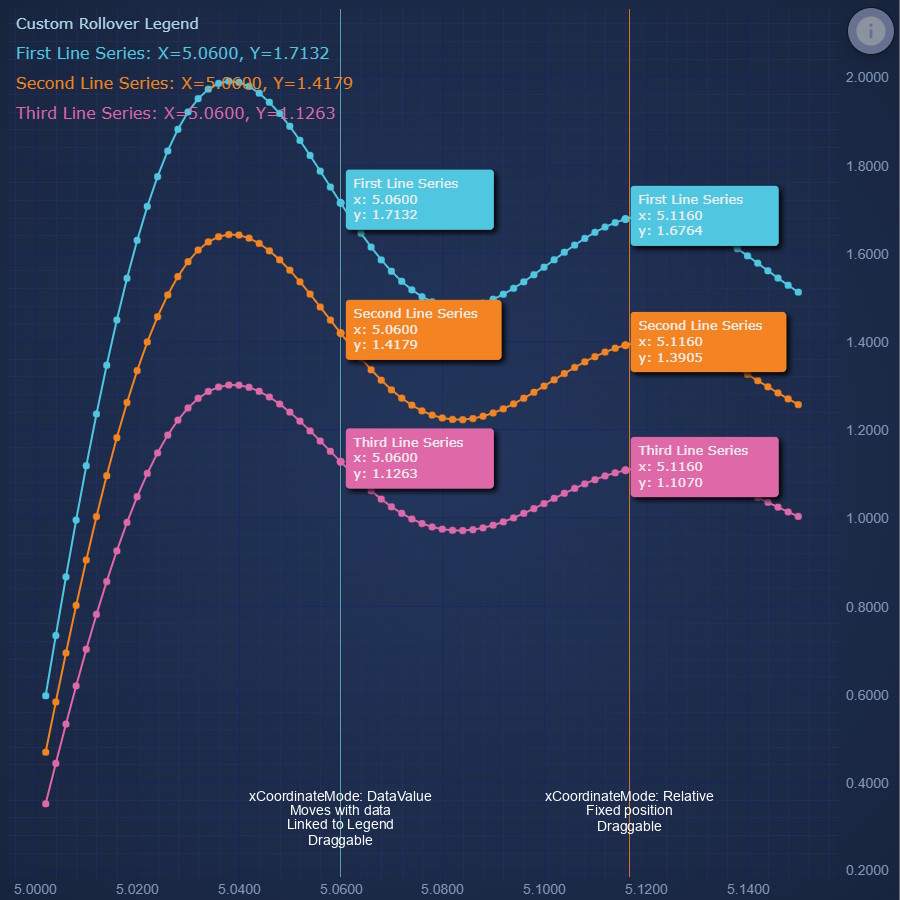
Using VerticalSliceModifier
Demonstrates adding Tooltips at certain positions to a JavaScript Chart with SciChart.js VerticalSliceModifier
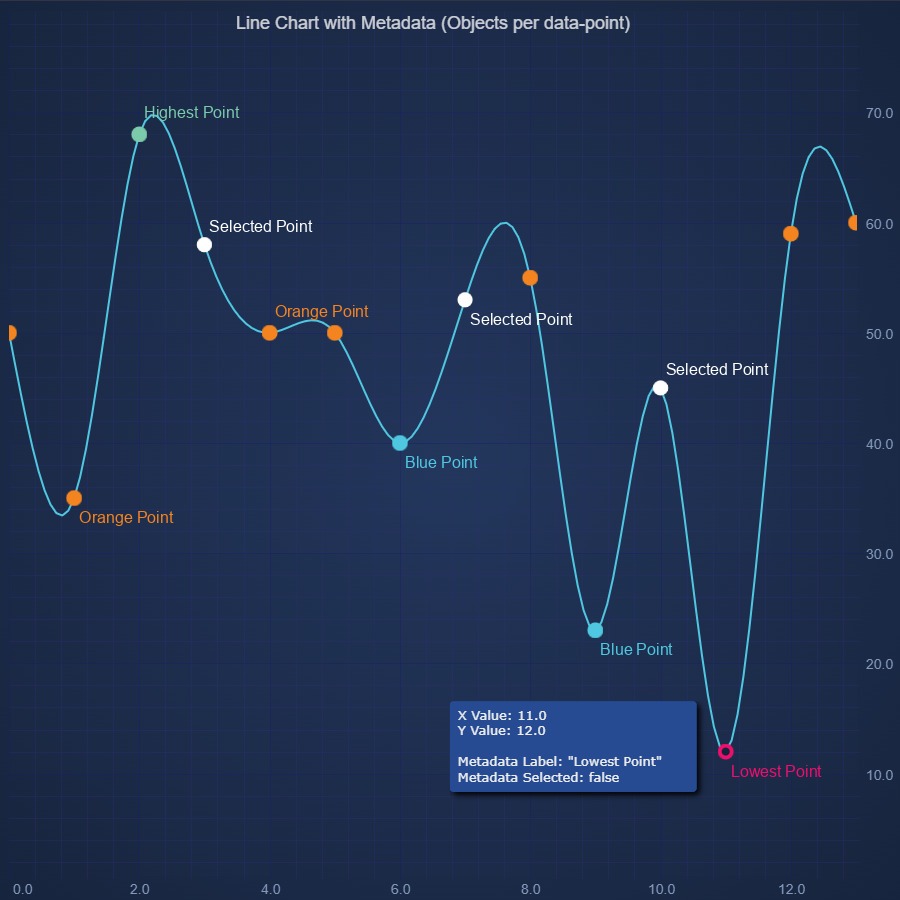
Datapoint Metadata Tooltips on JavaScript Chart
Demonstrates using MetaData in a JavaScript Chart - add custom data to points for display or to drive visual customisation
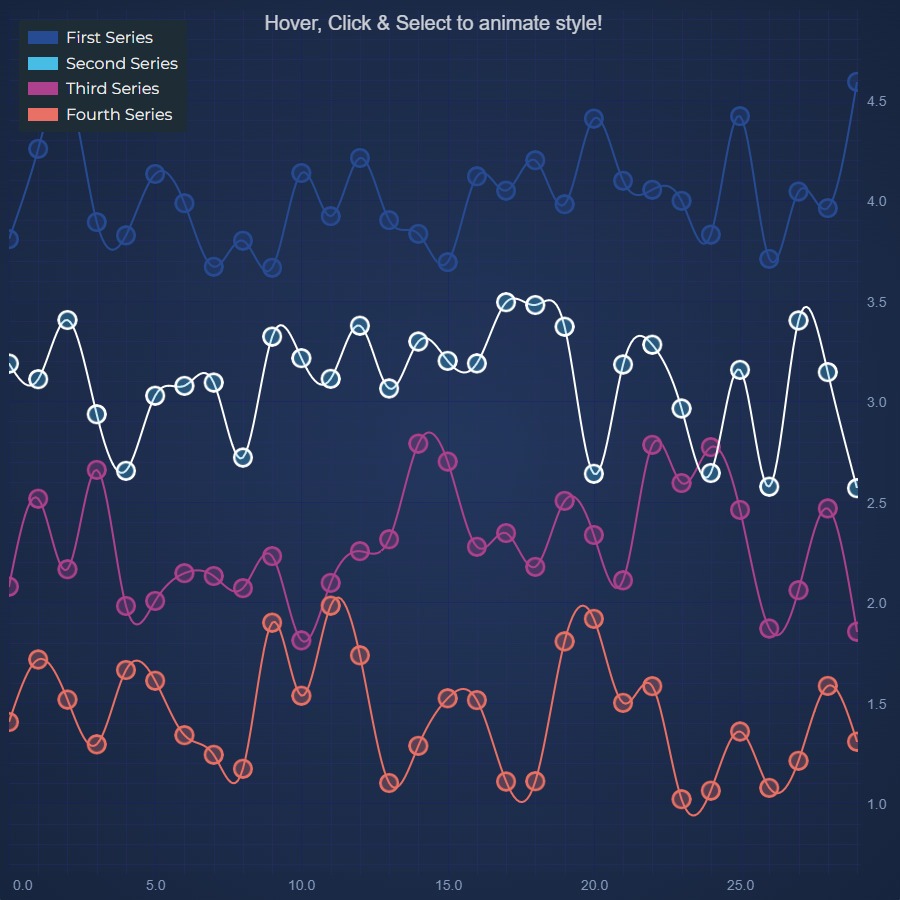
Using Series Selection
Demonstrates Hit-Testing a JavaScript Chart - point and click on the chart and get feedback about what data-points were clicked
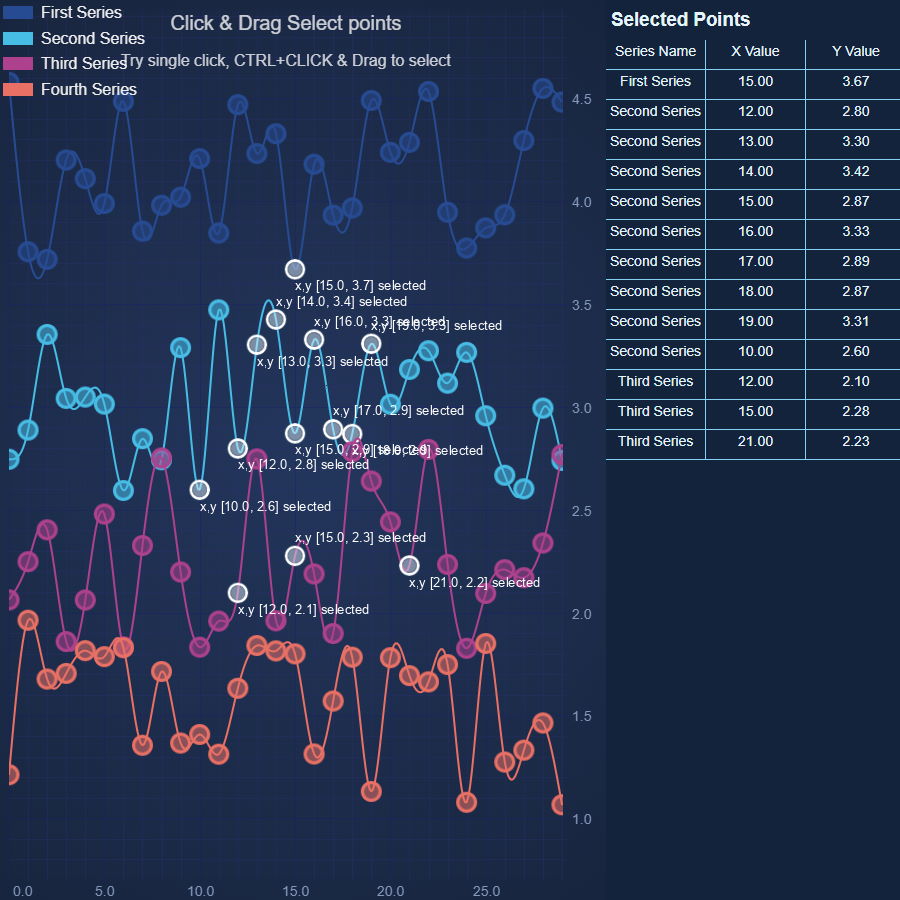
JavaScript Chart Data Point Selection
Demonstrates the DatapointSelectionModifier, which provides a UI to select one or many data points, and works with DataPointSelectionPaletteProvider to change the appearance of selected points