Dashed Line Styling
Demonstrates how create React Charts with dashed lines using SciChart.js, High Performance JavaScript Charts
drawExample.ts
index.tsx
ExampleDataProvider.ts
theme.ts
1import { appTheme } from "../../../theme";
2import { ExampleDataProvider } from "../../../ExampleData/ExampleDataProvider";
3
4import {
5    ENumericFormat,
6    FastBandRenderableSeries,
7    FastLineRenderableSeries,
8    FastMountainRenderableSeries,
9    GradientParams,
10    MouseWheelZoomModifier,
11    NumberRange,
12    NumericAxis,
13    Point,
14    SciChartSurface,
15    TSciChart,
16    XyDataSeries,
17    XyyDataSeries,
18    ZoomExtentsModifier,
19    ZoomPanModifier,
20} from "scichart";
21
22// tslint:disable:no-empty
23// tslint:disable:max-classes-per-file
24
25export const drawExample = async (rootElement: string | HTMLDivElement) => {
26    const { sciChartSurface, wasmContext } = await SciChartSurface.create(rootElement, {
27        theme: appTheme.SciChartJsTheme,
28    });
29
30    // Create XAxis
31    sciChartSurface.xAxes.add(new NumericAxis(wasmContext, { labelFormat: ENumericFormat.Decimal, labelPrecision: 2 }));
32
33    // Create YAxis
34    sciChartSurface.yAxes.add(
35        new NumericAxis(wasmContext, {
36            growBy: new NumberRange(0.1, 0.1),
37        })
38    );
39
40    // Create a Mountain series with a dashed line
41    sciChartSurface.renderableSeries.add(
42        new FastMountainRenderableSeries(wasmContext, {
43            stroke: "SteelBlue",
44            fillLinearGradient: new GradientParams(new Point(0, 0), new Point(0, 1), [
45                { color: appTheme.VividSkyBlue + "77", offset: 0 },
46                { color: "Transparent", offset: 0.5 },
47            ]),
48            strokeThickness: 3,
49            dataSeries: createLineData(wasmContext, 2),
50            // Strokedash array defines the stroke dash. [10,5] means draw for 10pts, gap for 5pts
51            strokeDashArray: [10, 5],
52        })
53    );
54
55    // Create a line series with a dotted line
56    sciChartSurface.renderableSeries.add(
57        new FastLineRenderableSeries(wasmContext, {
58            stroke: appTheme.VividSkyBlue,
59            strokeThickness: 2,
60            dataSeries: createLineData(wasmContext, 1),
61            // Strokedash array defines the stroke dash. [5,5] means draw for 5pts, gap for 5pts
62            strokeDashArray: [5, 5],
63        })
64    );
65
66    // Create a line series a dotted line
67    sciChartSurface.renderableSeries.add(
68        new FastLineRenderableSeries(wasmContext, {
69            stroke: appTheme.VividSkyBlue,
70            strokeThickness: 2,
71            dataSeries: createLineData(wasmContext, 0),
72            // Strokedash array defines the stroke dash. [3,3] means draw for 3pt, gap for 3pt
73            strokeDashArray: [3, 3],
74        })
75    );
76
77    // Create a band series with dashed lines and add to the chart
78    sciChartSurface.renderableSeries.add(
79        new FastBandRenderableSeries(wasmContext, {
80            dataSeries: createBandData(wasmContext),
81            strokeThickness: 2,
82            fill: appTheme.VividSkyBlue + "33",
83            fillY1: appTheme.VividSkyBlue + "33",
84            stroke: appTheme.VividSkyBlue,
85            strokeY1: appTheme.VividSkyBlue,
86            // strokeDashArray: [10, 10],
87            // strokeY1DashArray: [3, 3]
88        })
89    );
90
91    // Add some interactivity modifiers
92    sciChartSurface.chartModifiers.add(new ZoomPanModifier({ enableZoom: true }));
93    sciChartSurface.chartModifiers.add(new MouseWheelZoomModifier());
94    sciChartSurface.chartModifiers.add(new ZoomExtentsModifier());
95
96    sciChartSurface.zoomExtents();
97
98    return { sciChartSurface, wasmContext };
99};
100
101// Creates some dummy data and appends into an XyDataSeries for the example
102const createLineData = (wasmContext: TSciChart, whichSeries: number) => {
103    const data = ExampleDataProvider.getFourierSeriesZoomed(1.0, 0.1, 5.0, 5.15);
104    const xyDataSeries = new XyDataSeries(wasmContext);
105
106    xyDataSeries.appendRange(
107        data.xValues,
108        data.yValues.map((y) => (whichSeries === 0 ? y : whichSeries === 1 ? y * 1.1 : y * 1.5))
109    );
110    return xyDataSeries;
111};
112
113const createBandData = (wasmContext: TSciChart) => {
114    const data0 = ExampleDataProvider.getFourierSeriesZoomed(0.6, 0.13, 5.0, 5.15);
115    const data1 = ExampleDataProvider.getFourierSeriesZoomed(0.5, 0.12, 5.0, 5.15);
116    const xyyDataSeries = new XyyDataSeries(wasmContext);
117    xyyDataSeries.appendRange(data0.xValues, data0.yValues, data1.yValues);
118    return xyyDataSeries;
119};
120
See Also: Styling and Theming (10 Demos)
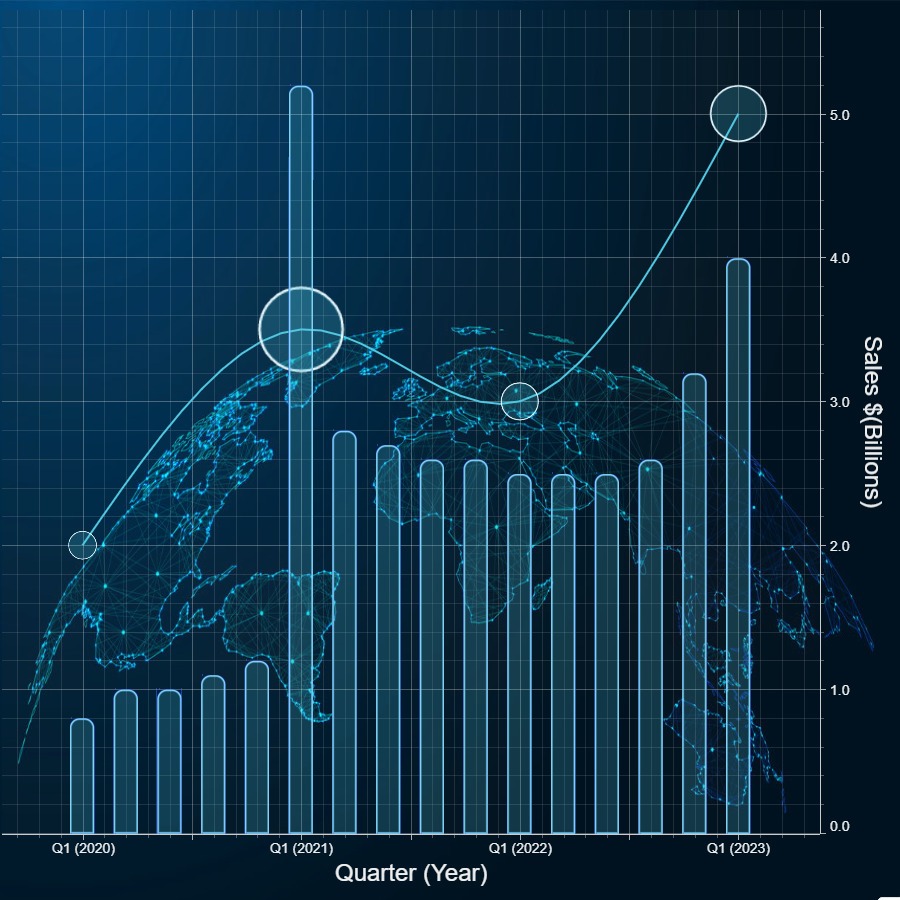
Background Image with Transparency
Demonstrates how to create a React Chart with background image using transparency in SciChart.js
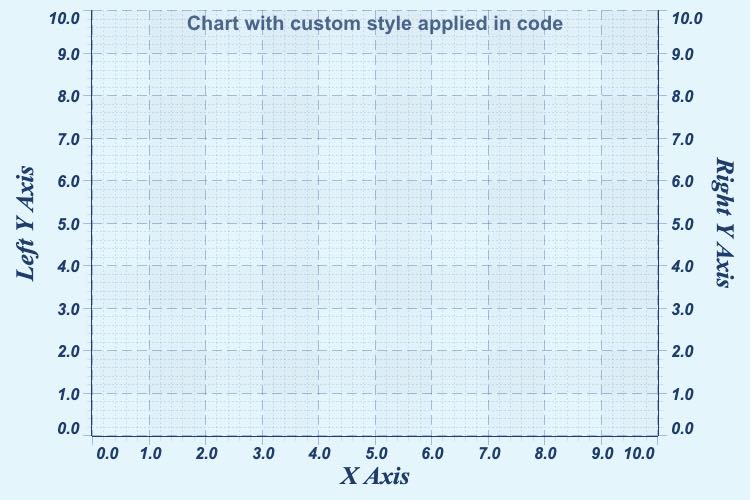
Styling a React Chart in Code
Demonstrates how to style a React Chart entirely in code with SciChart.js themeing API
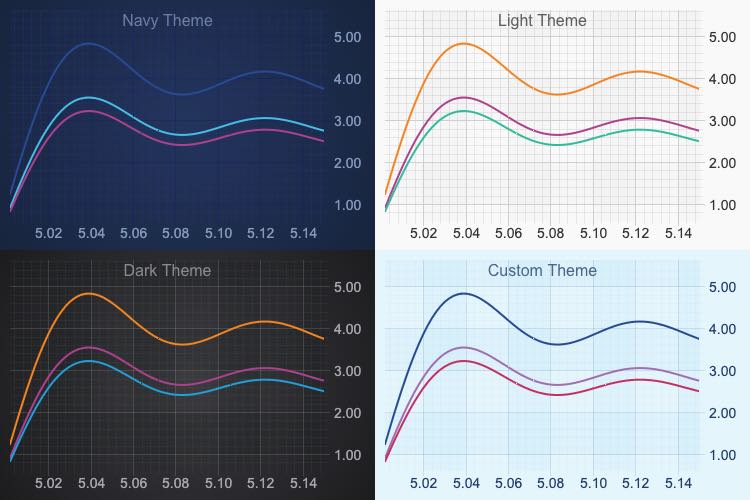
Using Theme Manager in React Chart
Demonstrates our Light and Dark Themes for React Charts with SciChart.js ThemeManager API
Create a Custom Theme for React Chart
Demonstrates how to create a Custom Theme for a SciChart.js React Chart using our Theming API
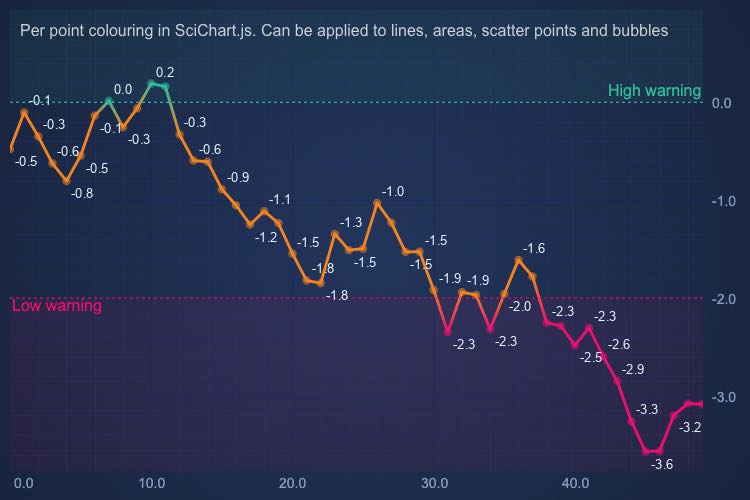
Coloring Series per-point using the PaletteProvider
Demonstrates per-point coloring in JavaScript chart types with SciChart.js PaletteProvider API
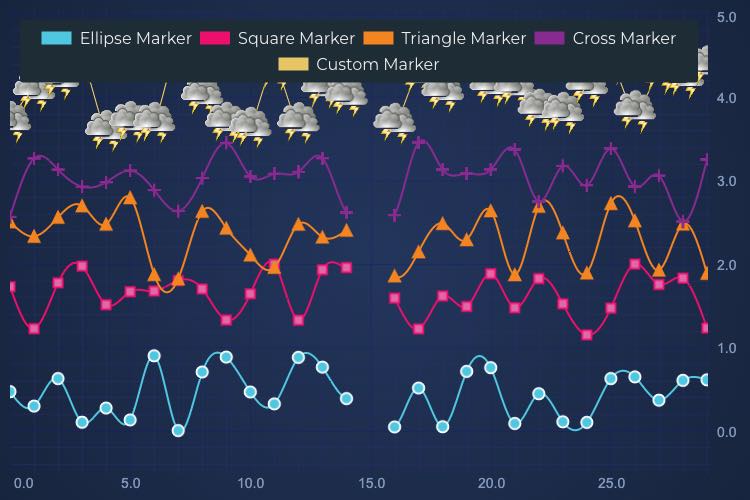
React Point-Markers Chart
Demonstrates the different point-marker types for React Scatter charts (Square, Circle, Triangle and Custom image point-marker)
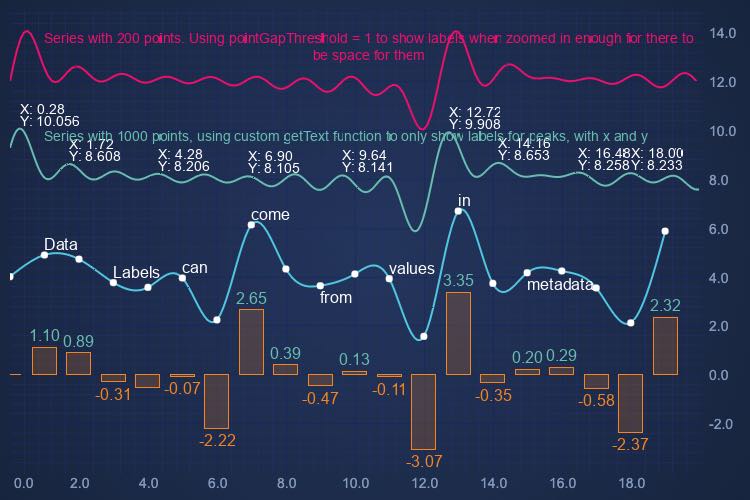
Data Labels
Show data labels on React Chart. Get your free demo now.
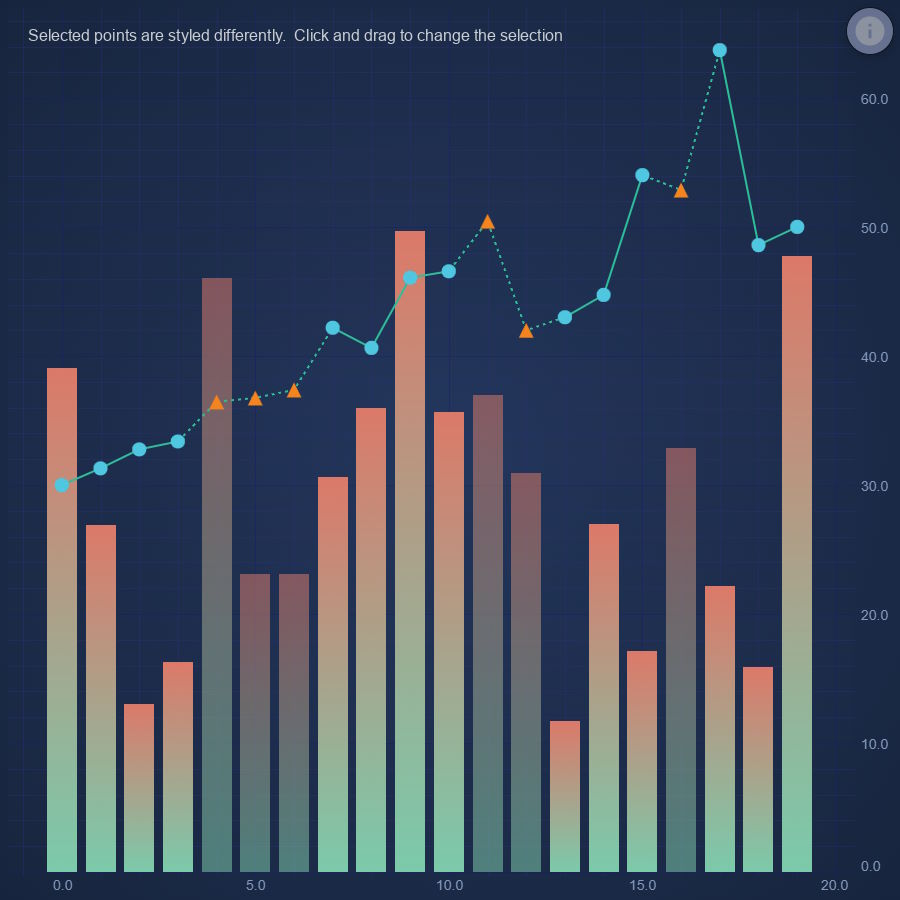
React Chart with Multi-Style Series
Demonstrates how to apply multiple different styles to a single series using RenderDataTransform
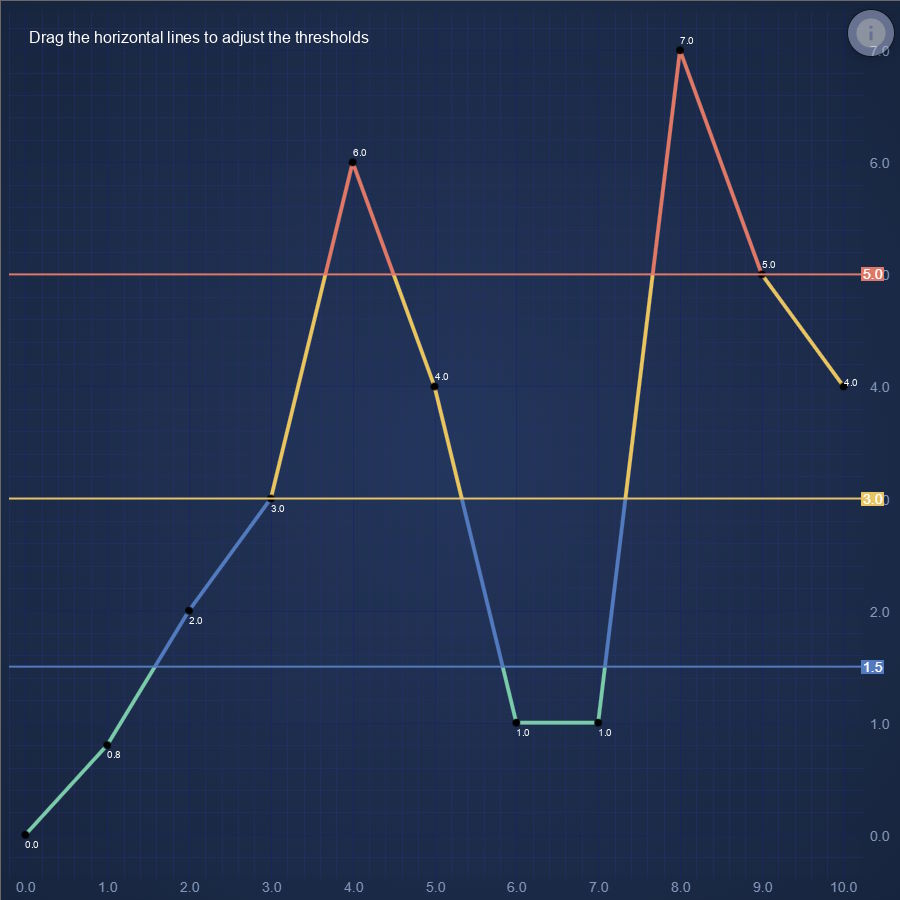
React Chart with lines split by thresholds
Demonstrates how to use a RenderDataTransform to split lines into multiple segments so they can be individually colored according to thresholds
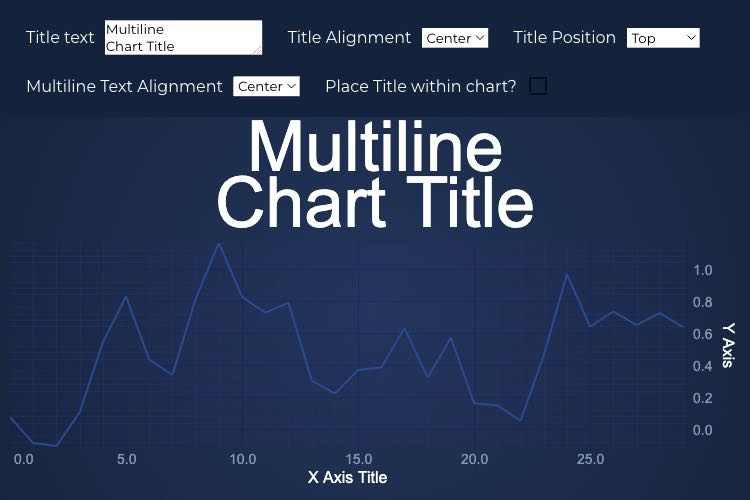
React Chart Title
Demonstrates chart title with different position and alignment options