Custom Filters
Demonstrates simple and advanced Custom Filters, with realtime updates using SciChart.js, High Performance JavaScript Charts
drawExample.ts
index.tsx
theme.ts
Copy to clipboard
Minimise
Fullscreen
1import { appTheme } from "../../../theme";
2
3import {
4    BaseDataSeries,
5    NumericAxis,
6    EAutoRange,
7    EAxisAlignment,
8    ELabelAlignment,
9    FastColumnRenderableSeries,
10    FastLineRenderableSeries,
11    EllipsePointMarker,
12    LegendModifier,
13    NumberRange,
14    SciChartSurface,
15    XyCustomFilter,
16    XyDataSeries,
17    XyFilterBase,
18    XyScatterRenderableSeries,
19} from "scichart";
20
21// A custom filter which calculates the frequency distribution of the original data
22class AggregationFilter extends XyFilterBase {
23    private bins: Map<number, number> = new Map<number, number>();
24    private binWidthProperty = 1;
25
26    constructor(originalSeries: BaseDataSeries, binWidth: number, dataSeriesName: string) {
27        super(originalSeries, { dataSeriesName });
28        this.binWidthProperty = binWidth;
29        this.filterAll();
30    }
31
32    public get binWidth() {
33        return this.binWidthProperty;
34    }
35
36    public set binWidth(value: number) {
37        this.binWidthProperty = value;
38        this.filterAll();
39    }
40
41    protected filterAll() {
42        this.clear();
43        this.bins.clear();
44        this.filter(0, this.getOriginalCount());
45    }
46
47    protected override filterOnAppend(count: number): void {
48        // Overriding this so we do not have to reprocess the entire series on append
49        this.filter(this.getOriginalCount() - count, count);
50    }
51
52    protected filter(start: number, count: number): void {
53        const numUtil = this.originalSeries.webAssemblyContext.NumberUtil;
54        for (let i = start; i < start + count; i++) {
55            const bin = numUtil.RoundDown(this.getOriginalYValues().get(i), this.binWidth);
56            if (this.bins.has(bin)) {
57                const newVal = this.bins.get(bin) + 1;
58                this.bins.set(bin, newVal);
59            } else {
60                this.bins.set(bin, 1);
61            }
62        }
63        // Map data is unsorted, so we must sort it before recreating the output series
64        const keys = Array.from(this.bins.keys()).sort((a, b) => a - b);
65        this.clear();
66        const yValues: number[] = [];
67        for (const key of keys) {
68            yValues.push(this.bins.get(key));
69        }
70        this.appendRange(keys, yValues);
71    }
72
73    protected override onClear() {
74        this.clear();
75        this.bins.clear();
76    }
77}
78
79let lastX = 0;
80// Straight line data
81const getData = (n: number) => {
82    const xValues: number[] = [];
83    const yValues: number[] = [];
84    for (let i = 0; i < n; i++) {
85        xValues.push(lastX);
86        yValues.push(50 + lastX / 1000);
87        lastX++;
88    }
89    return { xValues, yValues };
90};
91
92export const drawExample = async (rootElement: string | HTMLDivElement) => {
93    // Define some constants
94    const numberOfPointsPerTimerTick = 500; // 1,000 points every timer tick
95    const timerInterval = 10; // timer tick every 10 milliseconds
96    const maxPoints = 100_000; // max points for a single series before the demo stops
97
98    const { sciChartSurface, wasmContext } = await SciChartSurface.create(rootElement, {
99        theme: appTheme.SciChartJsTheme,
100    });
101    const rawXAxis = new NumericAxis(wasmContext, { id: "rawX", isVisible: false, autoRange: EAutoRange.Always });
102    const aggXAxis = new NumericAxis(wasmContext, {
103        id: "aggX",
104        axisTitle: "Value",
105        autoRange: EAutoRange.Always,
106        labelPrecision: 0,
107    });
108    sciChartSurface.xAxes.add(rawXAxis, aggXAxis);
109
110    const rawYAxis = new NumericAxis(wasmContext, {
111        autoRange: EAutoRange.Always,
112        axisTitle: "Raw Data",
113        id: "rawY",
114        labelPrecision: 0,
115        labelStyle: { alignment: ELabelAlignment.Right },
116    });
117    const aggYAxis = new NumericAxis(wasmContext, {
118        axisTitle: "Frequency (Aggregated)",
119        id: "aggY",
120        autoRange: EAutoRange.Always,
121        axisAlignment: EAxisAlignment.Left,
122        growBy: new NumberRange(0, 0.5),
123        labelPrecision: 0,
124    });
125    sciChartSurface.yAxes.add(aggYAxis, rawYAxis);
126
127    const dataSeries = new XyDataSeries(wasmContext, { dataSeriesName: "Original Data" });
128
129    // Create a simple custom filter.  We just have to specify the filter function and this will be applied efficiently to data changes
130    const gaussFilter = new XyCustomFilter(dataSeries, { dataSeriesName: "Custom Filter: Original x Gaussian Random" });
131    // This function exploits the central limit theorem to approximate a normal distribution
132    const gaussianRand = () => {
133        let rand = 0;
134        for (let i = 0; i < 6; i += 1) {
135            rand += Math.random() + 0.5;
136        }
137        return rand / 6;
138    };
139    gaussFilter.filterFunction = (i, y) => y * gaussianRand();
140
141    // Add the randomised data using a custom filter which takes original data * random value
142    sciChartSurface.renderableSeries.add(
143        new XyScatterRenderableSeries(wasmContext, {
144            pointMarker: new EllipsePointMarker(wasmContext, {
145                width: 3,
146                height: 3,
147                strokeThickness: 0,
148                fill: appTheme.VividOrange,
149                opacity: 0.77,
150            }),
151            stroke: appTheme.VividOrange,
152            dataSeries: gaussFilter,
153            xAxisId: "rawX",
154            yAxisId: "rawY",
155        })
156    );
157
158    // Add the original data to the chart
159    sciChartSurface.renderableSeries.add(
160        new FastLineRenderableSeries(wasmContext, {
161            dataSeries,
162            stroke: appTheme.VividTeal,
163            strokeThickness: 3,
164            xAxisId: "rawX",
165            yAxisId: "rawY",
166        })
167    );
168
169    // Pass the randomised data into the aggregation filter.
170    const aggFilter = new AggregationFilter(gaussFilter, 5, "Custom Filter: Aggregation");
171
172    // Plot the aggregation filter as a column chart
173    sciChartSurface.renderableSeries.add(
174        new FastColumnRenderableSeries(wasmContext, {
175            id: "col",
176            fill: appTheme.VividSkyBlue + "33",
177            stroke: appTheme.MutedSkyBlue,
178            dataSeries: aggFilter,
179            xAxisId: "aggX",
180            yAxisId: "aggY",
181            cornerRadius: 10,
182        })
183    );
184
185    let timerId: NodeJS.Timeout;
186
187    // Function called when the user clicks stopUpdate button
188    const stopUpdate = () => {
189        clearTimeout(timerId);
190        timerId = undefined;
191        lastX = 0;
192    };
193
194    // Function called when the user clicks startUpdate button
195    const startUpdate = () => {
196        if (timerId) {
197            stopUpdate();
198            dataSeries.clear();
199        }
200        const updateFunc = () => {
201            if (dataSeries.count() >= maxPoints) {
202                stopUpdate();
203                return;
204            }
205
206            // Get the next N random walk x,y values
207            const { xValues, yValues } = getData(numberOfPointsPerTimerTick);
208            // Append these to the dataSeries. This will cause the chart to redraw
209            dataSeries.appendRange(xValues, yValues);
210
211            timerId = setTimeout(updateFunc, timerInterval);
212        };
213
214        dataSeries.clear();
215
216        timerId = setTimeout(updateFunc, timerInterval);
217    };
218
219    sciChartSurface.chartModifiers.add(new LegendModifier());
220
221    return { wasmContext, sciChartSurface, controls: { startUpdate, stopUpdate } };
222};
223
See Also: Transforming Data with Filters (3 Demos)

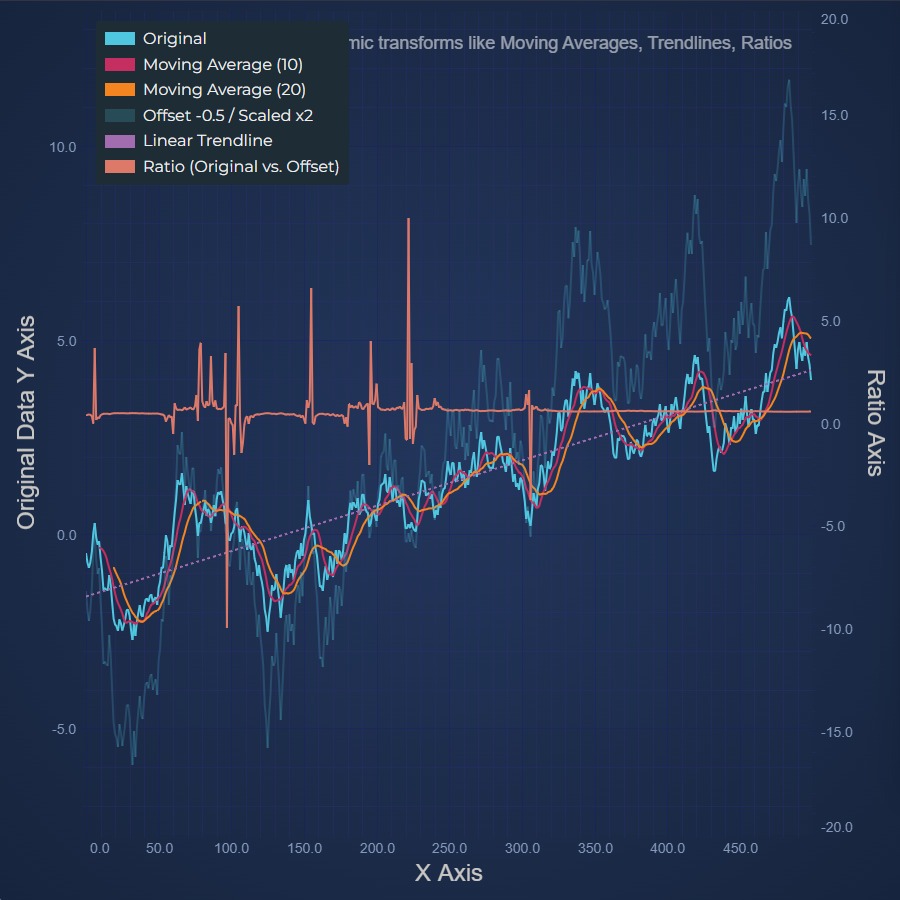
Trendline, Moving Average and Ratio Filters
Chart with Linear Trendline, Moving Average and Ratio Filters with filter chaining

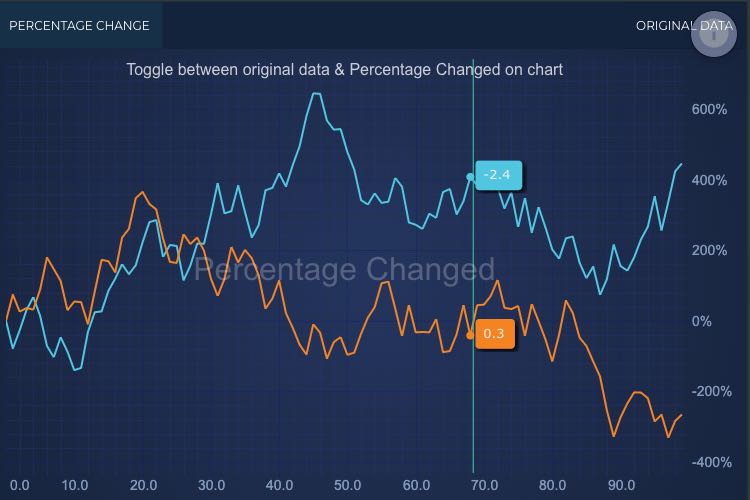
Realtime Percentage Change using Filter
How to use a ScaleOffsetFilter to convert data to a percentage change, with realtime updates, rescale on pan

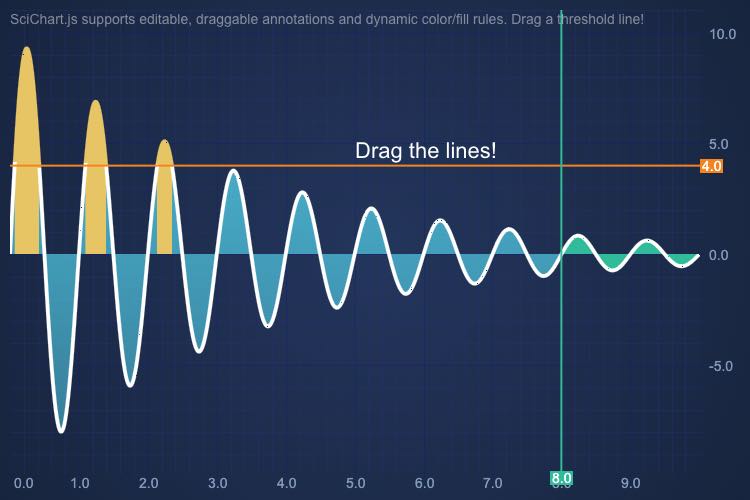
React Mountain Chart Draggable Thresholds
Demonstrates how to add draggable thresholds which change the series color in the chart in SciChart.js
Quick Links
Useful Links
SciChart Ltd, 16 Beaufort Court, Admirals Way, Docklands, London, E14 9XL.