Client/Server Websocket Data Streaming
Demonstrates handling realtime big data with different chart types using SciChart.js, High Performance JavaScript Charts
Number of Series 10
Initial Points 10000
Max Points On Chart 10000
Points Per Update 10
Send Data Interval 100 ms
drawExample.ts
index.tsx
ChartGroupLoader.tsx
containerSizeHooks.ts
theme.ts
1import { io } from "socket.io-client";
2import { appTheme } from "../../../theme";
3import {
4 IBaseDataSeriesOptions,
5 TSciChart,
6 ESeriesType,
7 BaseDataSeries,
8 BaseRenderableSeries,
9 XyDataSeries,
10 FastLineRenderableSeries,
11 AUTO_COLOR,
12 XyyDataSeries,
13 FastBandRenderableSeries,
14 FastColumnRenderableSeries,
15 StackedMountainRenderableSeries,
16 XyCustomFilter,
17 EDataSeriesField,
18 XyScatterRenderableSeries,
19 EllipsePointMarker,
20 OhlcDataSeries,
21 FastCandlestickRenderableSeries,
22 XyTextDataSeries,
23 FastTextRenderableSeries,
24 EDataSeriesType,
25 XyzDataSeries,
26 INumericAxisOptions,
27 ENumericFormat,
28 SciChartSurface,
29 NumericAxis,
30 LayoutManager,
31 IRenderableSeries,
32 StackedColumnCollection,
33 StackedColumnRenderableSeries,
34 StackedMountainCollection,
35 RightAlignedOuterVerticallyStackedAxisLayoutStrategy,
36 MouseWheelZoomModifier,
37 ZoomPanModifier,
38 ZoomExtentsModifier,
39 NumberRange,
40} from "scichart";
41
42export type TMessage = {
43 title: string;
44 detail: string;
45};
46
47export interface ISettings {
48 seriesCount?: number;
49 pointsOnChart?: number;
50 pointsPerUpdate?: number;
51 sendEvery?: number;
52 initialPoints?: number;
53}
54
55let loadCount: number = 0;
56let loadTimes: number[];
57let avgLoadTime: number = 0;
58let avgRenderTime: number = 0;
59
60function GetRandomData(xValues: number[], positive: boolean) {
61 let prevYValue = Math.random();
62 const yValues: number[] = [];
63 // tslint:disable-next-line: prefer-for-of
64 for (let j = 0; j < xValues.length; j++) {
65 const change = Math.random() * 10 - 5;
66 prevYValue = positive ? Math.abs(prevYValue + change) : prevYValue + change;
67 yValues.push(prevYValue);
68 }
69 return yValues;
70}
71
72const extendRandom = (val: number, max: number) => val + Math.random() * max;
73
74const generateCandleData = (xValues: number[]) => {
75 let open = 10;
76 const openValues = [];
77 const highValues = [];
78 const lowValues = [];
79 const closeValues = [];
80
81 for (let i = 0; i < xValues.length; i++) {
82 const close = open + Math.random() * 10 - 5;
83 const high = Math.max(open, close);
84 highValues.push(extendRandom(high, 5));
85 const low = Math.min(open, close);
86 lowValues.push(extendRandom(low, -5));
87 closeValues.push(close);
88 openValues.push(open);
89 open = close;
90 }
91 return { openValues, highValues, lowValues, closeValues };
92};
93
94const generateCandleDataForAppendRange = (open: number, closeValues: number[]) => {
95 const openValues = [];
96 const highValues = [];
97 const lowValues = [];
98 for (const close of closeValues) {
99 openValues.push(open);
100 const high = Math.max(open, close);
101 highValues.push(extendRandom(high, 5));
102 const low = Math.min(open, close);
103 lowValues.push(extendRandom(low, -5));
104 open = close;
105 }
106 return { openValues, highValues, lowValues, closeValues };
107};
108
109const dsOptions: IBaseDataSeriesOptions = {
110 isSorted: true,
111 containsNaN: false,
112};
113
114const createRenderableSeries = (
115 wasmContext: TSciChart,
116 seriesType: ESeriesType
117): { dataSeries: BaseDataSeries; rendSeries: BaseRenderableSeries } => {
118 if (seriesType === ESeriesType.LineSeries) {
119 const dataSeries: XyDataSeries = new XyDataSeries(wasmContext, dsOptions);
120 const rendSeries: FastLineRenderableSeries = new FastLineRenderableSeries(wasmContext, {
121 dataSeries,
122 stroke: AUTO_COLOR,
123 strokeThickness: 3,
124 opacity: 0.8,
125 });
126 return { dataSeries, rendSeries };
127 } else if (seriesType === ESeriesType.BandSeries) {
128 const dataSeries: XyyDataSeries = new XyyDataSeries(wasmContext, dsOptions);
129 const rendSeries: FastBandRenderableSeries = new FastBandRenderableSeries(wasmContext, {
130 stroke: AUTO_COLOR,
131 strokeY1: AUTO_COLOR,
132 fill: AUTO_COLOR,
133 fillY1: AUTO_COLOR,
134 dataSeries,
135 strokeThickness: 2,
136 opacity: 0.8,
137 });
138 return { dataSeries, rendSeries };
139 } else if (seriesType === ESeriesType.ColumnSeries) {
140 const dataSeries: XyDataSeries = new XyDataSeries(wasmContext, dsOptions);
141 const rendSeries: FastColumnRenderableSeries = new FastColumnRenderableSeries(wasmContext, {
142 fill: AUTO_COLOR,
143 stroke: AUTO_COLOR,
144 dataSeries,
145 strokeThickness: 1,
146 });
147 return { dataSeries, rendSeries };
148 } else if (seriesType === ESeriesType.StackedMountainSeries) {
149 const dataSeries: XyDataSeries = new XyDataSeries(wasmContext, dsOptions);
150 const rendSeries: StackedMountainRenderableSeries = new StackedMountainRenderableSeries(wasmContext, {
151 stroke: AUTO_COLOR,
152 fill: AUTO_COLOR,
153 dataSeries,
154 });
155 return { dataSeries, rendSeries };
156 } else if (seriesType === ESeriesType.ScatterSeries) {
157 const dataSeries: XyyDataSeries = new XyyDataSeries(wasmContext, { containsNaN: false });
158 // Use Y and Y1 as X and Y for scatter
159 const filteredSeries: XyDataSeries = new XyCustomFilter(dataSeries, {
160 xField: EDataSeriesField.Y,
161 field: EDataSeriesField.Y1,
162 });
163 const rendSeries: XyScatterRenderableSeries = new XyScatterRenderableSeries(wasmContext, {
164 pointMarker: new EllipsePointMarker(wasmContext, {
165 width: 9,
166 height: 9,
167 strokeThickness: 2,
168 fill: AUTO_COLOR,
169 stroke: AUTO_COLOR,
170 opacity: 0.8,
171 }),
172 dataSeries: filteredSeries,
173 });
174 // return the unfiltered xyy series as that is the one we want to append to
175 return { dataSeries, rendSeries };
176 } else if (seriesType === ESeriesType.CandlestickSeries) {
177 const dataSeries: OhlcDataSeries = new OhlcDataSeries(wasmContext, dsOptions);
178 const rendSeries: FastCandlestickRenderableSeries = new FastCandlestickRenderableSeries(wasmContext, {
179 strokeThickness: 1,
180 dataSeries,
181 dataPointWidth: 0.9,
182 opacity: 0.75,
183 strokeUp: AUTO_COLOR,
184 brushUp: AUTO_COLOR,
185 strokeDown: AUTO_COLOR,
186 brushDown: AUTO_COLOR,
187 });
188 return { dataSeries, rendSeries };
189 } else if (seriesType === ESeriesType.TextSeries) {
190 const dataSeries: XyTextDataSeries = new XyTextDataSeries(wasmContext, dsOptions);
191 const rendSeries: FastTextRenderableSeries = new FastTextRenderableSeries(wasmContext, {
192 dataSeries,
193 dataLabels: {
194 style: {
195 fontFamily: "Arial",
196 fontSize: 6,
197 },
198 color: AUTO_COLOR,
199 calculateTextBounds: false,
200 },
201 });
202 return { dataSeries, rendSeries };
203 }
204 return { dataSeries: undefined, rendSeries: undefined };
205};
206
207const prePopulateData = (
208 dataSeries: BaseDataSeries,
209 dataSeriesType: EDataSeriesType,
210 xValues: number[],
211 positive: boolean
212) => {
213 const yValues: number[] = GetRandomData(xValues, positive);
214 switch (dataSeriesType) {
215 case EDataSeriesType.Xy:
216 (dataSeries as XyDataSeries).appendRange(xValues, yValues);
217 break;
218 case EDataSeriesType.Xyy:
219 (dataSeries as XyyDataSeries).appendRange(xValues, yValues, GetRandomData(xValues, positive));
220 break;
221 case EDataSeriesType.Xyz:
222 (dataSeries as XyzDataSeries).appendRange(
223 xValues,
224 yValues,
225 GetRandomData(xValues, positive).map((z) => Math.abs(z / 5))
226 );
227 break;
228 case EDataSeriesType.Ohlc:
229 const { openValues, highValues, lowValues, closeValues } = generateCandleData(xValues);
230 (dataSeries as OhlcDataSeries).appendRange(xValues, openValues, highValues, lowValues, closeValues);
231 break;
232 case EDataSeriesType.XyText:
233 (dataSeries as XyTextDataSeries).appendRange(
234 xValues,
235 yValues,
236 yValues.map((textval) => textval.toFixed())
237 );
238 break;
239 default:
240 break;
241 }
242};
243
244const appendData = (
245 dataSeries: BaseDataSeries,
246 dataSeriesType: EDataSeriesType,
247 index: number,
248 xValues: number[],
249 yArray: number[][],
250 pointsOnChart: number,
251 pointsPerUpdate: number
252) => {
253 switch (dataSeriesType) {
254 case EDataSeriesType.Xy:
255 const xySeries = dataSeries as XyDataSeries;
256 xySeries.appendRange(xValues, yArray[index]);
257 if (xySeries.count() > pointsOnChart) {
258 xySeries.removeRange(0, pointsPerUpdate);
259 }
260 break;
261 case EDataSeriesType.Xyy:
262 const xyySeries = dataSeries as XyyDataSeries;
263 xyySeries.appendRange(xValues, yArray[2 * index], yArray[2 * index + 1]);
264 if (xyySeries.count() > pointsOnChart) {
265 xyySeries.removeRange(0, pointsPerUpdate);
266 }
267 break;
268 case EDataSeriesType.Xyz:
269 const xyzSeries = dataSeries as XyzDataSeries;
270 xyzSeries.appendRange(
271 xValues,
272 yArray[2 * index],
273 yArray[2 * index + 1].map((z) => Math.abs(z / 5))
274 );
275 if (xyzSeries.count() > pointsOnChart) {
276 xyzSeries.removeRange(0, pointsPerUpdate);
277 }
278 break;
279 case EDataSeriesType.Ohlc:
280 const ohlcSeries = dataSeries as OhlcDataSeries;
281 const { openValues, highValues, lowValues, closeValues } = generateCandleDataForAppendRange(
282 ohlcSeries.getNativeCloseValues().get(ohlcSeries.count() - 1),
283 yArray[index]
284 );
285 ohlcSeries.appendRange(xValues, openValues, highValues, lowValues, closeValues);
286 if (ohlcSeries.count() > pointsOnChart) {
287 ohlcSeries.removeRange(0, pointsPerUpdate);
288 }
289 break;
290 case EDataSeriesType.XyText:
291 const xytextSeries = dataSeries as XyTextDataSeries;
292 xytextSeries.appendRange(
293 xValues,
294 yArray[index],
295 yArray[index].map((obj) => obj.toFixed())
296 );
297 if (xytextSeries.count() > pointsOnChart) {
298 xytextSeries.removeRange(0, pointsPerUpdate);
299 }
300 break;
301 default:
302 break;
303 }
304};
305
306const axisOptions: INumericAxisOptions = {
307 drawMajorBands: false,
308 drawMinorGridLines: false,
309 drawMinorTickLines: false,
310 labelFormat: ENumericFormat.Decimal,
311 labelPrecision: 0,
312};
313
314export const drawExample =
315 (updateMessages: (newMessages: TMessage[]) => void, seriesType: ESeriesType) =>
316 async (rootElement: string | HTMLDivElement) => {
317 let seriesCount = 10;
318 let pointsOnChart = 1000;
319 let pointsPerUpdate = 100;
320 let sendEvery = 30;
321 let initialPoints: number = 0;
322
323 const { wasmContext, sciChartSurface } = await SciChartSurface.create(rootElement, {
324 theme: appTheme.SciChartJsTheme,
325 });
326 const xAxis = new NumericAxis(wasmContext, axisOptions);
327 sciChartSurface.xAxes.add(xAxis);
328 let yAxis = new NumericAxis(wasmContext, { ...axisOptions });
329 sciChartSurface.yAxes.add(yAxis);
330 let dataSeriesArray: BaseDataSeries[];
331 let dataSeriesType = EDataSeriesType.Xy;
332 if (seriesType === ESeriesType.BubbleSeries) {
333 dataSeriesType = EDataSeriesType.Xyz;
334 } else if (seriesType === ESeriesType.BandSeries || seriesType === ESeriesType.ScatterSeries) {
335 dataSeriesType = EDataSeriesType.Xyy;
336 } else if (seriesType === ESeriesType.CandlestickSeries) {
337 dataSeriesType = EDataSeriesType.Ohlc;
338 } else if (seriesType === ESeriesType.TextSeries) {
339 dataSeriesType = EDataSeriesType.XyText;
340 }
341
342 const initChart = () => {
343 sciChartSurface.renderableSeries.asArray().forEach((rs) => rs.delete());
344 sciChartSurface.renderableSeries.clear();
345 sciChartSurface.chartModifiers.asArray().forEach((cm) => cm.delete());
346 sciChartSurface.chartModifiers.clear();
347 sciChartSurface.yAxes.asArray().forEach((ya) => ya.delete());
348 sciChartSurface.yAxes.clear();
349 sciChartSurface.layoutManager = new LayoutManager();
350 yAxis = new NumericAxis(wasmContext, { ...axisOptions });
351 sciChartSurface.yAxes.add(yAxis);
352 dataSeriesArray = new Array<BaseDataSeries>(seriesCount);
353 let stackedCollection: IRenderableSeries;
354 let xValues: number[];
355 const positive = [ESeriesType.StackedColumnSeries, ESeriesType.StackedMountainSeries].includes(seriesType);
356 for (let i = 0; i < seriesCount; i++) {
357 const { dataSeries, rendSeries } = createRenderableSeries(wasmContext, seriesType);
358 dataSeriesArray[i] = dataSeries;
359 if (seriesType === ESeriesType.StackedColumnSeries) {
360 if (i === 0) {
361 stackedCollection = new StackedColumnCollection(wasmContext, { dataPointWidth: 1 });
362 sciChartSurface.renderableSeries.add(stackedCollection);
363 }
364 (rendSeries as StackedColumnRenderableSeries).stackedGroupId = i.toString();
365 (stackedCollection as StackedColumnCollection).add(rendSeries as StackedColumnRenderableSeries);
366 } else if (seriesType === ESeriesType.StackedMountainSeries) {
367 if (i === 0) {
368 stackedCollection = new StackedMountainCollection(wasmContext);
369 sciChartSurface.renderableSeries.add(stackedCollection);
370 }
371 (stackedCollection as StackedMountainCollection).add(rendSeries as StackedMountainRenderableSeries);
372 } else if (seriesType === ESeriesType.ColumnSeries) {
373 // create stacked y axis
374 if (i === 0) {
375 // tslint:disable-next-line: max-line-length
376 sciChartSurface.layoutManager.rightOuterAxesLayoutStrategy =
377 new RightAlignedOuterVerticallyStackedAxisLayoutStrategy();
378 yAxis.id = "0";
379 } else {
380 sciChartSurface.yAxes.add(
381 new NumericAxis(wasmContext, {
382 id: i.toString(),
383 ...axisOptions,
384 })
385 );
386 }
387 rendSeries.yAxisId = i.toString();
388 sciChartSurface.renderableSeries.add(rendSeries);
389 } else {
390 sciChartSurface.renderableSeries.add(rendSeries);
391 }
392
393 if (i === 0) {
394 xValues = Array.from(Array(initialPoints).keys());
395 }
396 // Generate points
397 prePopulateData(dataSeries, dataSeriesType, xValues, positive);
398 sciChartSurface.zoomExtents(0);
399 }
400 return positive;
401 };
402
403 const dataBuffer: { x: number[]; ys: number[][]; sendTime: number }[] = [];
404 let isRunning: boolean = false;
405 const newMessages: TMessage[] = [];
406 let loadStart = 0;
407 let loadTime = 0;
408 let renderStart = 0;
409 let renderTime = 0;
410
411 const loadData = (data: { x: number[]; ys: number[][]; sendTime: number }) => {
412 for (let i = 0; i < seriesCount; i++) {
413 appendData(dataSeriesArray[i], dataSeriesType, i, data.x, data.ys, pointsOnChart, pointsPerUpdate);
414 }
415 if (dataSeriesArray[0].count() < pointsOnChart) {
416 xAxis.visibleRange = new NumberRange(xAxis.visibleRange.min, xAxis.visibleRange.max + pointsPerUpdate);
417 } else {
418 xAxis.visibleRange = new NumberRange(
419 xAxis.visibleRange.min + pointsPerUpdate,
420 xAxis.visibleRange.max + pointsPerUpdate
421 );
422 }
423 loadTime = new Date().getTime() - loadStart;
424 };
425
426 sciChartSurface.preRender.subscribe(() => {
427 renderStart = new Date().getTime();
428 });
429
430 sciChartSurface.rendered.subscribe(() => {
431 if (!isRunning || loadStart === 0) return;
432 avgLoadTime = (avgLoadTime * loadCount + loadTime) / (loadCount + 1);
433 renderTime = new Date().getTime() - renderStart;
434 avgRenderTime = (avgRenderTime * loadCount + renderTime) / (loadCount + 1);
435 newMessages.push({
436 title: `Avg Load Time `,
437 detail: `${avgLoadTime.toFixed(2)} ms`,
438 });
439 newMessages.push({
440 title: `Avg Render Time `,
441 detail: `${avgRenderTime.toFixed(2)} ms`,
442 });
443 newMessages.push({
444 title: `Max FPS `,
445 detail: `${Math.min(60, 1000 / (avgLoadTime + avgRenderTime)).toFixed(1)}`,
446 });
447 updateMessages(newMessages);
448 newMessages.length = 0;
449 });
450
451 const loadFromBuffer = () => {
452 if (dataBuffer.length > 0) {
453 loadStart = new Date().getTime();
454 const x: number[] = dataBuffer[0].x;
455 const ys: number[][] = dataBuffer[0].ys;
456 const sendTime = dataBuffer[0].sendTime;
457 for (let i = 1; i < dataBuffer.length; i++) {
458 const el = dataBuffer[i];
459 x.push(...el.x);
460 for (let y = 0; y < el.ys.length; y++) {
461 ys[y].push(...el.ys[y]);
462 }
463 }
464 loadData({ x, ys, sendTime });
465 dataBuffer.length = 0;
466 }
467 if (isRunning) {
468 setTimeout(loadFromBuffer, Math.min(1, 10 - renderTime));
469 }
470 };
471
472 let socket: ReturnType<typeof io>;
473
474 const initWebSocket = (positive: boolean) => {
475 if (socket) {
476 socket.disconnect();
477 socket.connect();
478 } else {
479 if (window.location.hostname === "localhost" && parseInt(window.location.port) > 8000) {
480 socket = io("http://localhost:3000");
481 console.log("3000");
482 } else {
483 socket = io();
484 console.log("local");
485 }
486 socket.on("data", (message: any) => {
487 dataBuffer.push(message);
488 });
489 socket.on("finished", () => {
490 socket.disconnect();
491 });
492 }
493
494 // If initial data has been generated, this should be an array of the last y values of each series
495 const index = dataSeriesArray[0].count() - 1;
496 let series: number[];
497 if (
498 dataSeriesType === EDataSeriesType.Xy ||
499 dataSeriesType === EDataSeriesType.Ohlc ||
500 dataSeriesType === EDataSeriesType.XyText
501 ) {
502 if (index >= 0) {
503 series = dataSeriesArray.map((d) => d.getNativeYValues().get(index));
504 } else {
505 series = Array.from(Array(seriesCount)).fill(0);
506 }
507 } else if (dataSeriesType === EDataSeriesType.Xyy) {
508 if (index >= 0) {
509 series = [];
510 for (const dataSeries of dataSeriesArray) {
511 const xyy = dataSeries as XyyDataSeries;
512 series.push(xyy.getNativeYValues().get(index));
513 series.push(xyy.getNativeY1Values().get(index));
514 }
515 } else {
516 series = Array.from(Array(seriesCount * 2)).fill(0);
517 }
518 } else if (dataSeriesType === EDataSeriesType.Xyz) {
519 if (index >= 0) {
520 series = [];
521 for (const dataSeries of dataSeriesArray) {
522 const xyy = dataSeries as XyzDataSeries;
523 series.push(xyy.getNativeYValues().get(index));
524 series.push(xyy.getNativeZValues().get(index));
525 }
526 } else {
527 series = Array.from(Array(seriesCount * 2)).fill(0);
528 }
529 }
530 socket.emit("getData", { series, startX: index + 1, pointsPerUpdate, sendEvery, positive, scale: 10 });
531 isRunning = true;
532 loadFromBuffer();
533 };
534
535 const settings = {
536 seriesCount: 10,
537 pointsOnChart: 5000,
538 pointsPerUpdate: 10,
539 sendEvery: 100,
540 initialPoints: 5000,
541 };
542
543 const updateSettings = (newValues: ISettings) => {
544 Object.assign(settings, newValues);
545 };
546
547 // Buttons for chart
548 const startUpdate = () => {
549 console.log("start streaming");
550 loadCount = 0;
551 avgLoadTime = 0;
552 avgRenderTime = 0;
553 loadTimes = [];
554 loadStart = 0;
555 seriesCount = settings.seriesCount;
556 initialPoints = settings.initialPoints;
557 pointsOnChart = settings.pointsOnChart;
558 pointsPerUpdate = settings.pointsPerUpdate;
559 sendEvery = settings.sendEvery;
560 const positive = initChart();
561 initWebSocket(positive);
562 };
563
564 const stopUpdate = () => {
565 console.log("stop streaming");
566 socket?.disconnect();
567 isRunning = false;
568 if (sciChartSurface.chartModifiers.size() === 0) {
569 sciChartSurface.chartModifiers.add(
570 new MouseWheelZoomModifier(),
571 new ZoomPanModifier({ enableZoom: true }),
572 new ZoomExtentsModifier()
573 );
574 }
575 };
576 return { wasmContext, sciChartSurface, controls: { startUpdate, stopUpdate, updateSettings } };
577 };
578See Also: Performance Demos & Showcases (11 Demos)
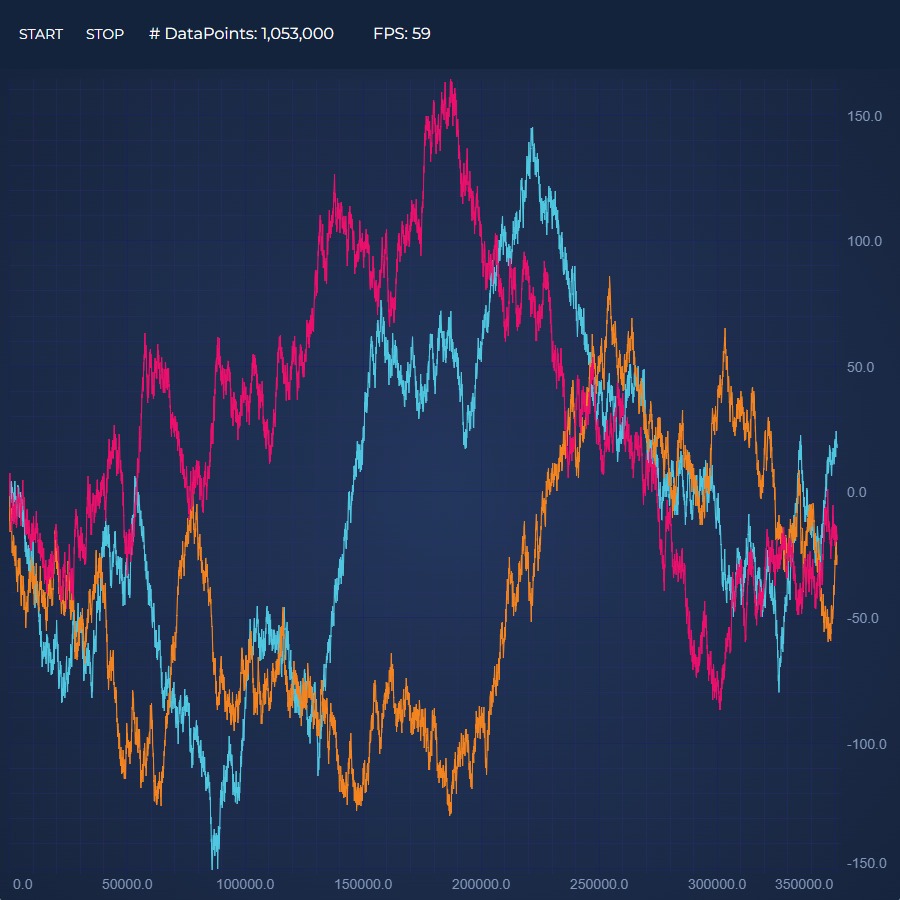
Realtime React Chart Performance Demo
This demo showcases the incredible realtime performance of our React charts by updating the series with millions of data-points!
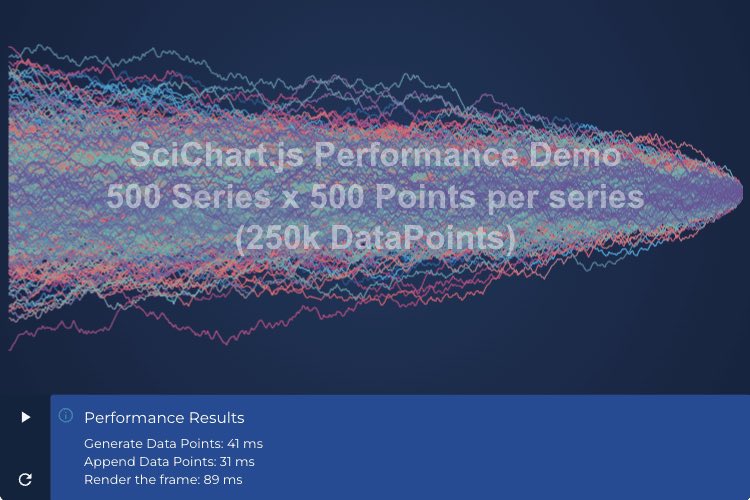
Load 500 Series x 500 Points Performance Demo
This demo showcases the incredible performance of our React Chart by loading 500 series with 500 points (250k points) instantly!
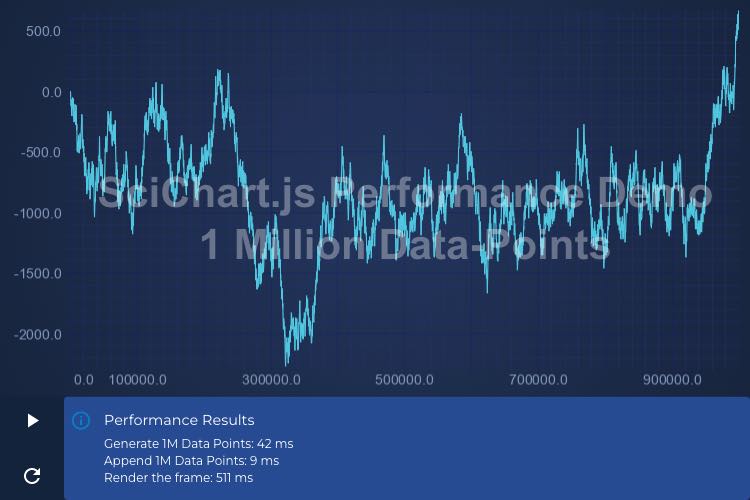
Load 1 Million Points Performance Demo
This demo showcases the incredible performance of our JavaScript Chart by loading a million points instantly.
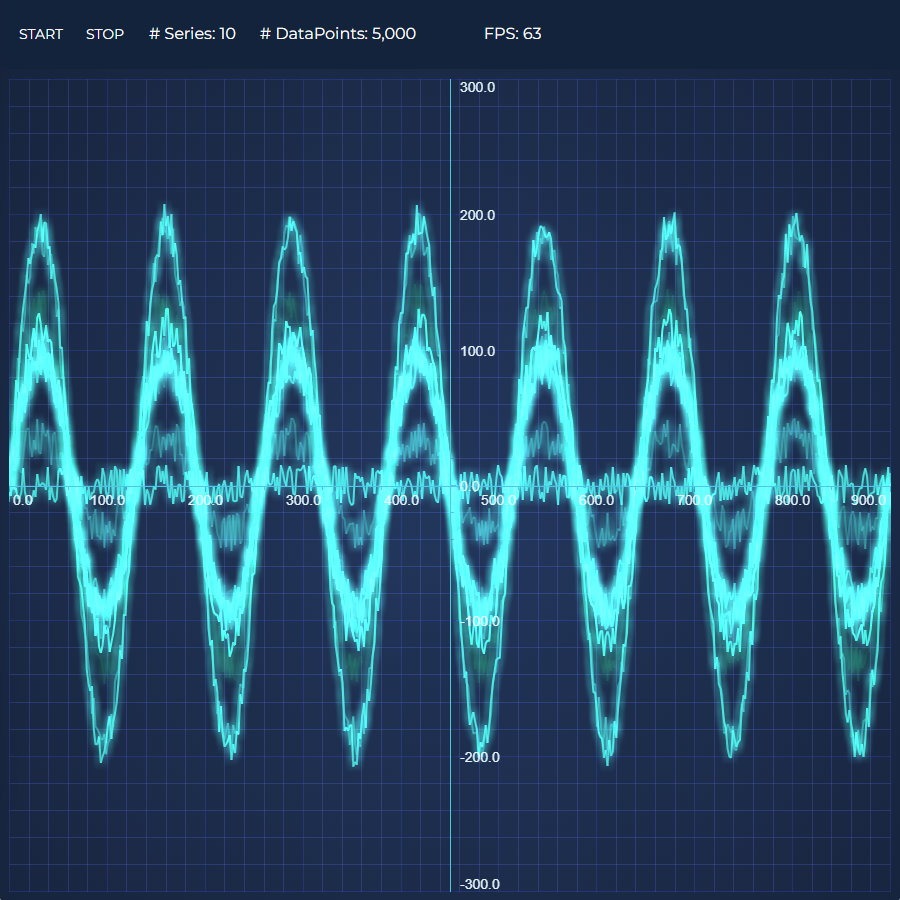
Realtime Ghosted Traces
This demo showcases the realtime performance of our React Chart by animating several series with thousands of data-points at 60 FPS

Realtime Audio Analyzer Demo
Demonstrating the capability of SciChart.js to create a JavaScript Audio Analyzer and visualize the Fourier-Transform of an audio waveform in realtime.
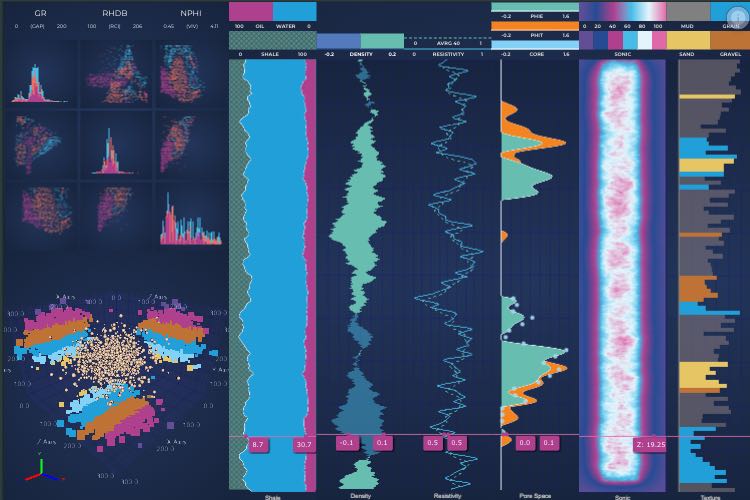
Oil & Gas Explorer React Dashboard
Demonstrates how to create Oil and Gas Dashboard
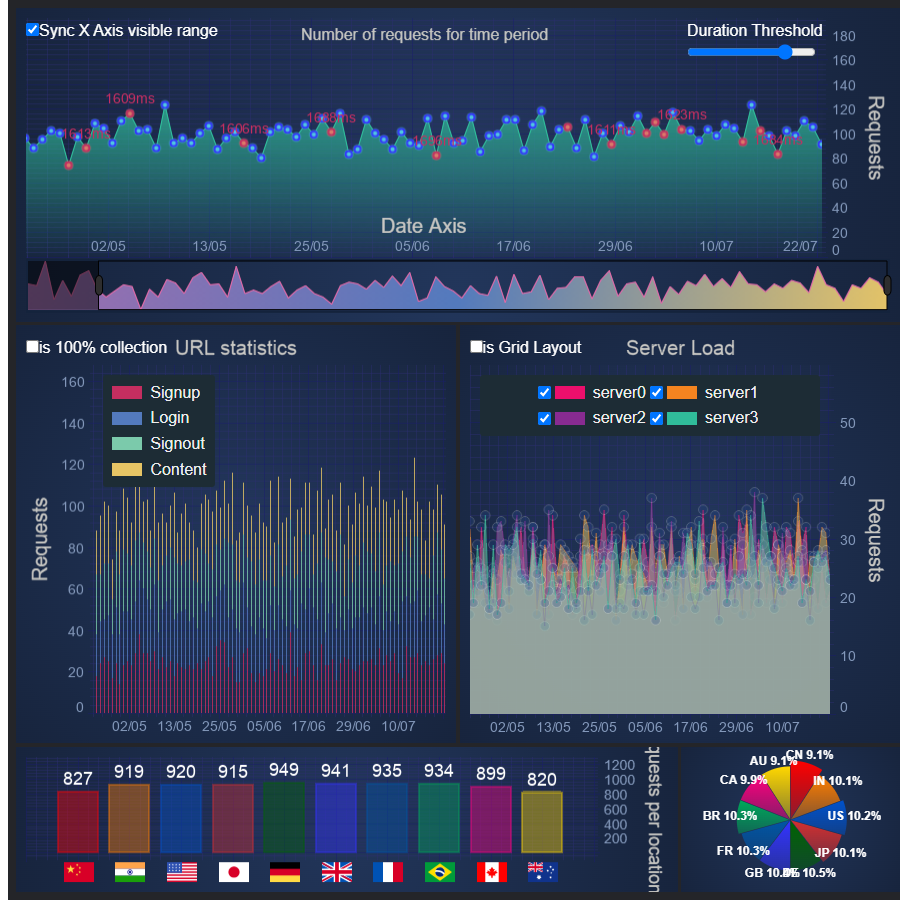
Server Traffic Dashboard
This dashboard demo showcases the incredible realtime performance of our React charts by updating the series with millions of data-points!
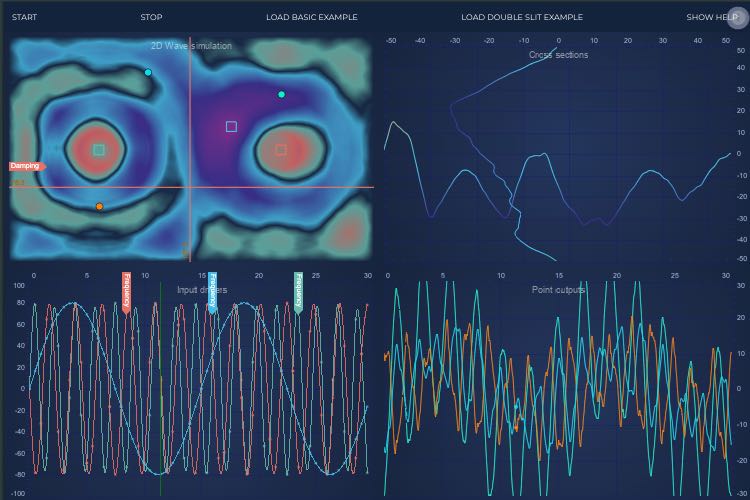
Rich Interactions Showcase
This demo showcases the incredible realtime performance of our React charts by updating the series with millions of data-points!
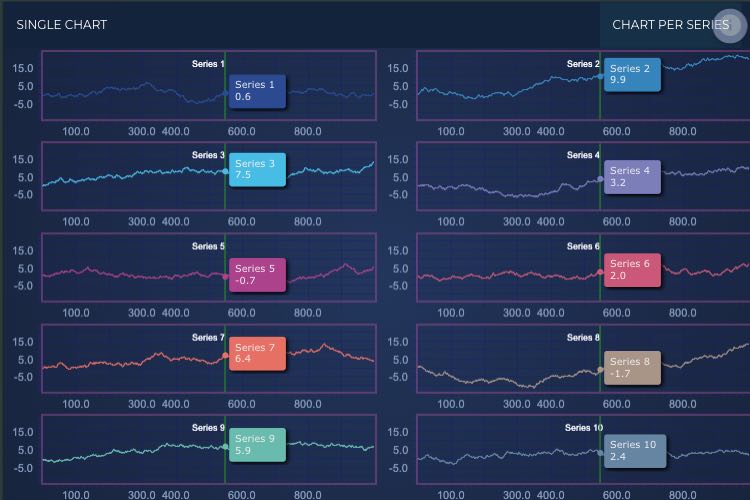
Dynamic Layout Showcase
Demonstrates a custom modifier which can convert from single chart to grid layout and back.
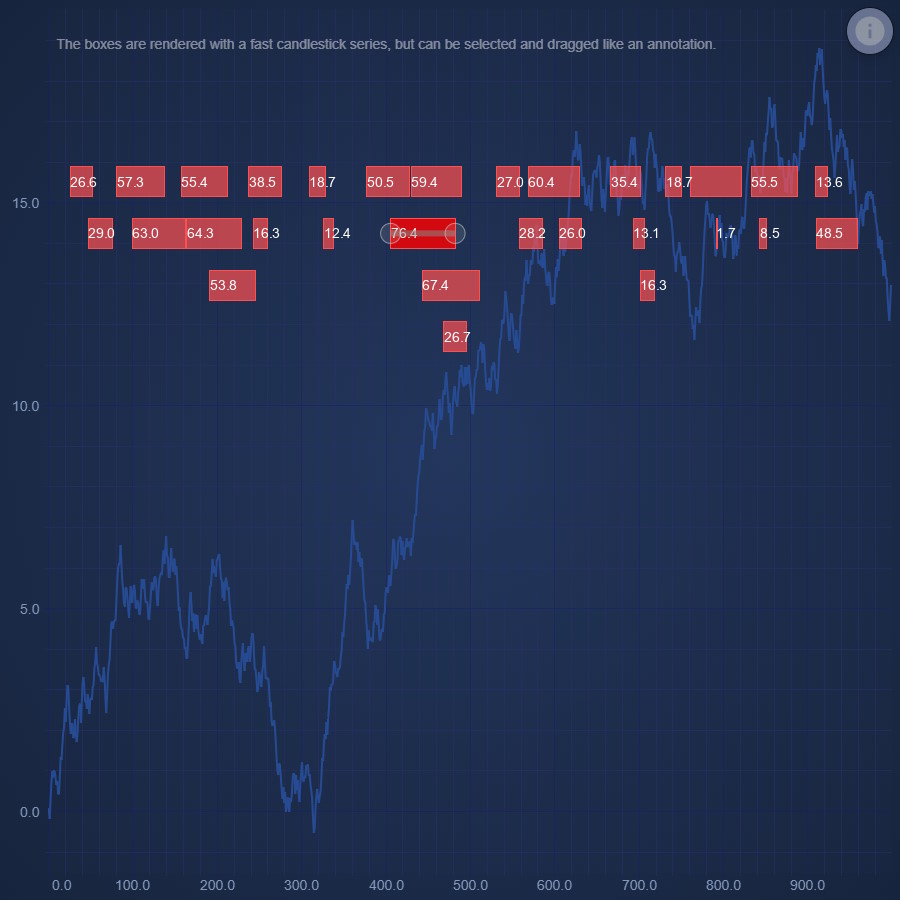
Dragabble Event Markers
Demonstrates how to repurpose a Candlestick Series into dragabble, labled, event markers
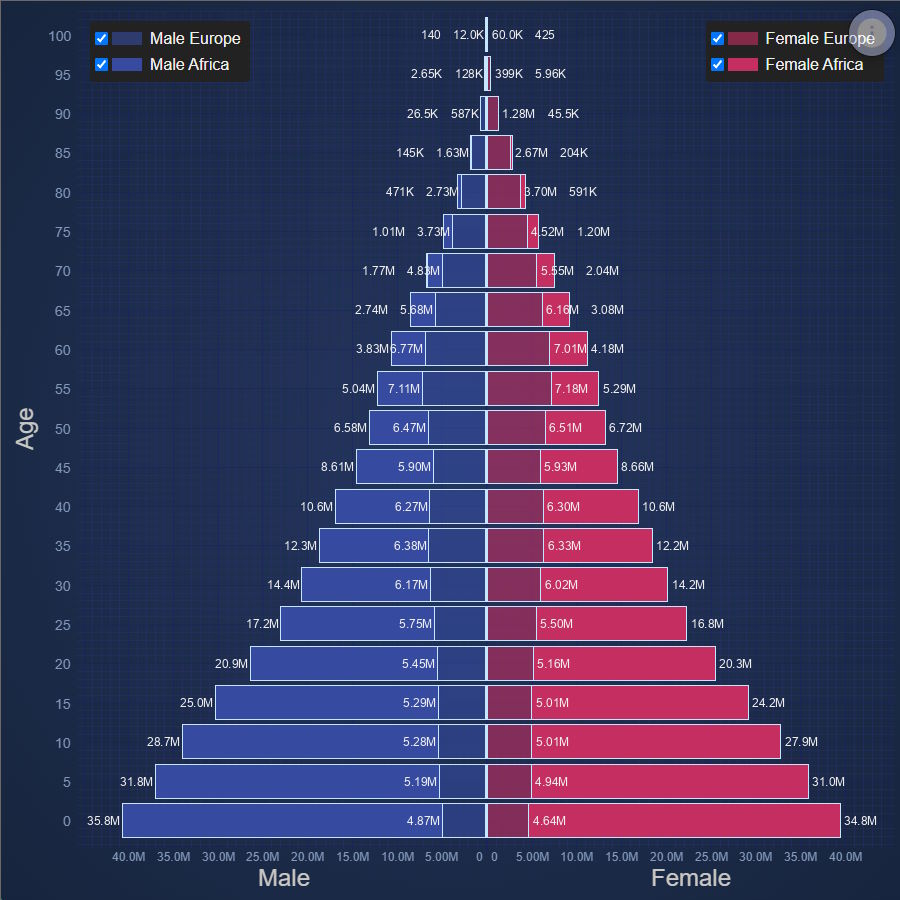
React Population Pyramid
Population Pyramid of Europe and Africa