Realtime React Chart Performance Demo
Demonstrates appending millions of points to a line chart with SciChart.js, High Performance JavaScript Charts
drawExample.ts
index.tsx
RandomWalkGenerator.ts
theme.ts
1import { appTheme } from "../../../theme";
2import { RandomWalkGenerator } from "../../../ExampleData/RandomWalkGenerator";
3
4import {
5    EAutoRange,
6    EDragMode,
7    FastLineRenderableSeries,
8    MouseWheelZoomModifier,
9    NumericAxis,
10    RubberBandXyZoomModifier,
11    SciChartSurface,
12    XAxisDragModifier,
13    XyDataSeries,
14    YAxisDragModifier,
15    ZoomExtentsModifier,
16} from "scichart";
17
18export const drawExample = async (rootElement: string | HTMLDivElement) => {
19    // Define some constants
20    const numberOfPointsPerTimerTick = 1000; // 1,000 points every timer tick
21    const timerInterval = 10; // timer tick every 10 milliseconds
22    const maxPoints = 1e6; // max points for a single series before the demo stops
23
24    // Create a SciChartSurface
25    // Note create() uses shared WebGL canvas, createSingle() uses one WebGL per chart
26    // createSingle() = faster performance as doesn't require a copy-op, but limited by max-contexts in browser
27    const { wasmContext, sciChartSurface } = await SciChartSurface.createSingle(rootElement, {
28        theme: appTheme.SciChartJsTheme,
29    });
30
31    // Create an XAxis and YAxis with autoRange=Always
32    const xAxis = new NumericAxis(wasmContext, { autoRange: EAutoRange.Always });
33    sciChartSurface.xAxes.add(xAxis);
34    const yAxis = new NumericAxis(wasmContext, { autoRange: EAutoRange.Always });
35    sciChartSurface.yAxes.add(yAxis);
36
37    // Create some DataSeries
38    const dataSeries: XyDataSeries[] = [
39        new XyDataSeries(wasmContext, { containsNaN: false, isSorted: true }),
40        new XyDataSeries(wasmContext, { containsNaN: false, isSorted: true }),
41        new XyDataSeries(wasmContext, { containsNaN: false, isSorted: true }),
42    ];
43
44    const seriesColors = [appTheme.VividSkyBlue, appTheme.VividOrange, appTheme.VividPink];
45
46    // Create some FastLineRenderableSeries bound to each dataSeries and add to the chart
47    dataSeries.map((ds, index) => {
48        sciChartSurface.renderableSeries.add(
49            new FastLineRenderableSeries(wasmContext, {
50                dataSeries: ds,
51                strokeThickness: 2,
52                stroke: seriesColors[index],
53            })
54        );
55    });
56
57    // Add some interactivity modifiers. These are only operational when the demo is paused
58    // as interactivity conflicts with AutoRange.Always
59    sciChartSurface.chartModifiers.add(
60        new RubberBandXyZoomModifier(),
61        new MouseWheelZoomModifier(),
62        new XAxisDragModifier({ dragMode: EDragMode.Panning }),
63        new YAxisDragModifier({ dragMode: EDragMode.Panning }),
64        new ZoomExtentsModifier()
65    );
66
67    // This class generates some data for our example
68    // It generates a random walk, which is a line which increases or decreases by a random value
69    // each data-point
70    const randomWalkGenerators = [1, 2, 3].map((_) => {
71        return new RandomWalkGenerator(0);
72    });
73
74    let timerId: NodeJS.Timeout;
75
76    // Function called when the user clicks stopUpdate button
77    const stopUpdate = () => {
78        clearTimeout(timerId);
79        timerId = undefined;
80        randomWalkGenerators.forEach((rw) => rw.reset());
81        // Disable autoranging on X when the demo is paused. This allows zooming and panning
82        xAxis.autoRange = EAutoRange.Once;
83    };
84
85    // Function called when the user clicks startUpdate button
86    const startUpdate = () => {
87        // // tslint:disable-next-line:no-debugger
88        // debugger;
89        if (timerId) {
90            stopUpdate();
91        }
92        const updateFunc = () => {
93            if (dataSeries[0].count() >= maxPoints) {
94                stopUpdate();
95                return;
96            }
97
98            randomWalkGenerators.forEach((randomWalk, index) => {
99                // Get the next N random walk x,y values
100                const { xValues, yValues } = randomWalk.getRandomWalkSeries(numberOfPointsPerTimerTick);
101
102                // Append these to the dataSeries. This will cause the chart to redraw
103                dataSeries[index].appendRange(xValues, yValues);
104            });
105
106            timerId = setTimeout(updateFunc, timerInterval);
107        };
108
109        // Enable autoranging on X when running the demo
110        xAxis.autoRange = EAutoRange.Always;
111
112        dataSeries.forEach((ds) => ds.clear());
113
114        timerId = setTimeout(updateFunc, timerInterval);
115    };
116
117    type TRenderStats = { numberPoints: number; fps: number };
118    type TOnRenderStatsChangeCallback = (stats: TRenderStats) => void;
119
120    let statsCallback: TOnRenderStatsChangeCallback = () => {};
121    const setStatsChangedCallback = (callback: TOnRenderStatsChangeCallback) => {
122        statsCallback = callback;
123    };
124
125    let lastRendered = Date.now();
126    sciChartSurface.rendered.subscribe(() => {
127        const currentTime = Date.now();
128        const timeDiffSeconds = new Date(currentTime - lastRendered).getTime() / 1000;
129        lastRendered = currentTime;
130        const fps = 1 / timeDiffSeconds;
131        const renderStats = {
132            numberPoints:
133                sciChartSurface.renderableSeries.size() * sciChartSurface.renderableSeries.get(0).dataSeries.count(),
134            fps,
135        };
136
137        statsCallback(renderStats);
138    });
139
140    return { wasmContext, sciChartSurface, controls: { startUpdate, stopUpdate, setStatsChangedCallback } };
141};
142
See Also: Performance Demos & Showcases (11 Demos)
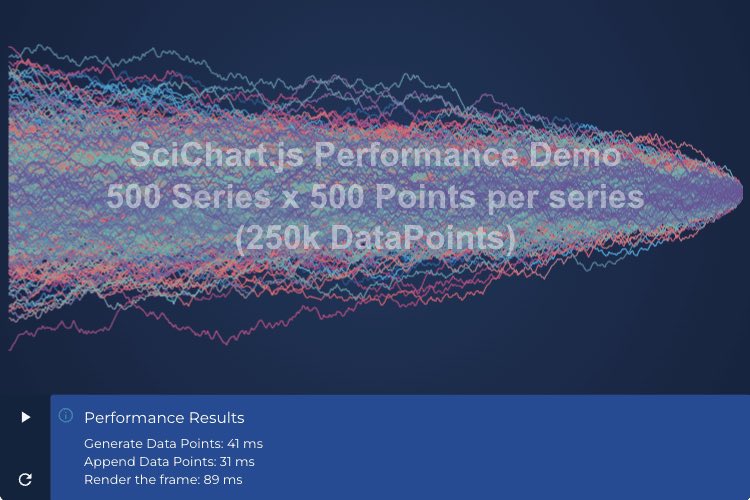
Load 500 Series x 500 Points Performance Demo
This demo showcases the incredible performance of our React Chart by loading 500 series with 500 points (250k points) instantly!
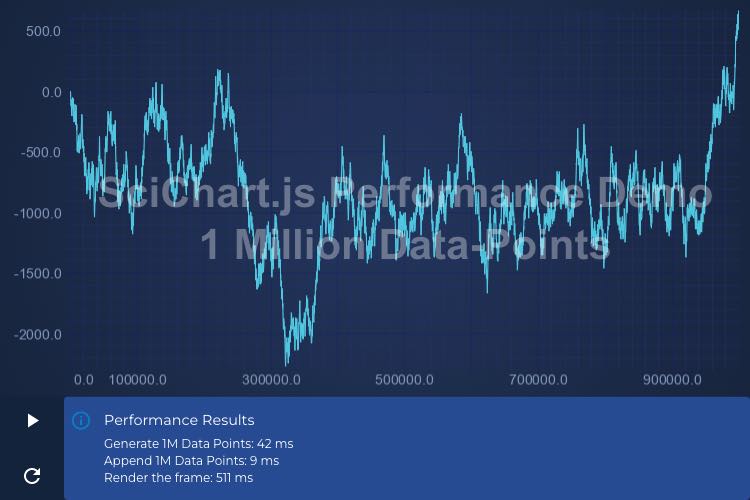
Load 1 Million Points Performance Demo
This demo showcases the incredible performance of our JavaScript Chart by loading a million points instantly.
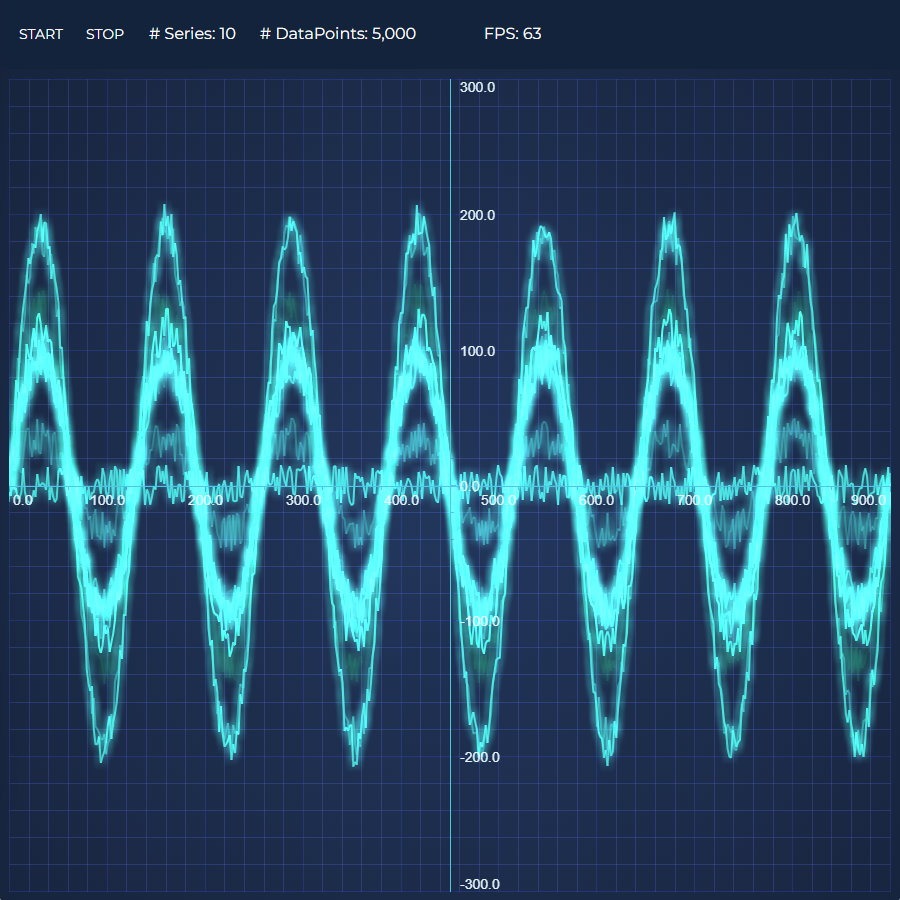
Realtime Ghosted Traces
This demo showcases the realtime performance of our React Chart by animating several series with thousands of data-points at 60 FPS

Realtime Audio Analyzer Demo
Demonstrating the capability of SciChart.js to create a JavaScript Audio Analyzer and visualize the Fourier-Transform of an audio waveform in realtime.
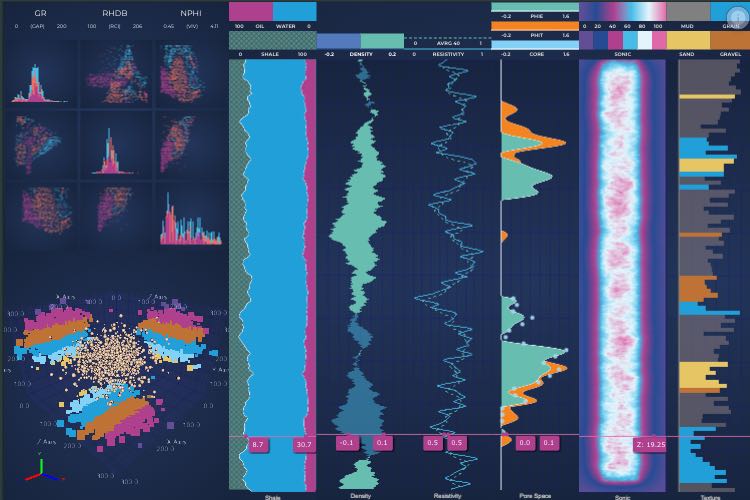
Oil & Gas Explorer React Dashboard
Demonstrates how to create Oil and Gas Dashboard
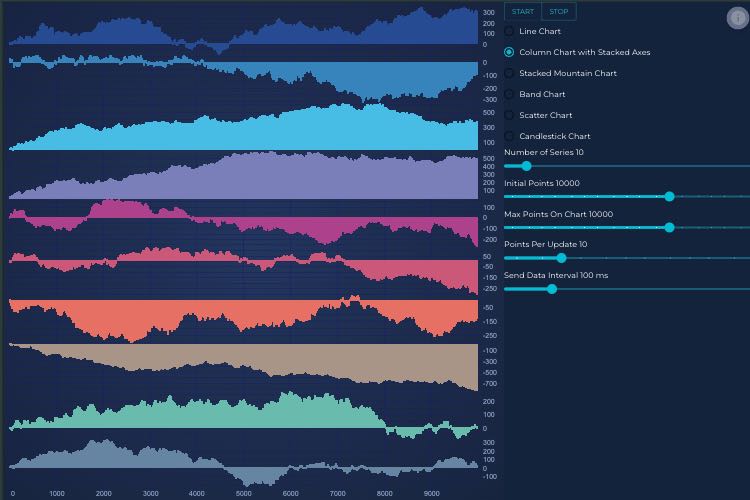
Client/Server Websocket Data Streaming
This demo showcases the incredible realtime performance of our JavaScript charts by updating the series with millions of data-points!
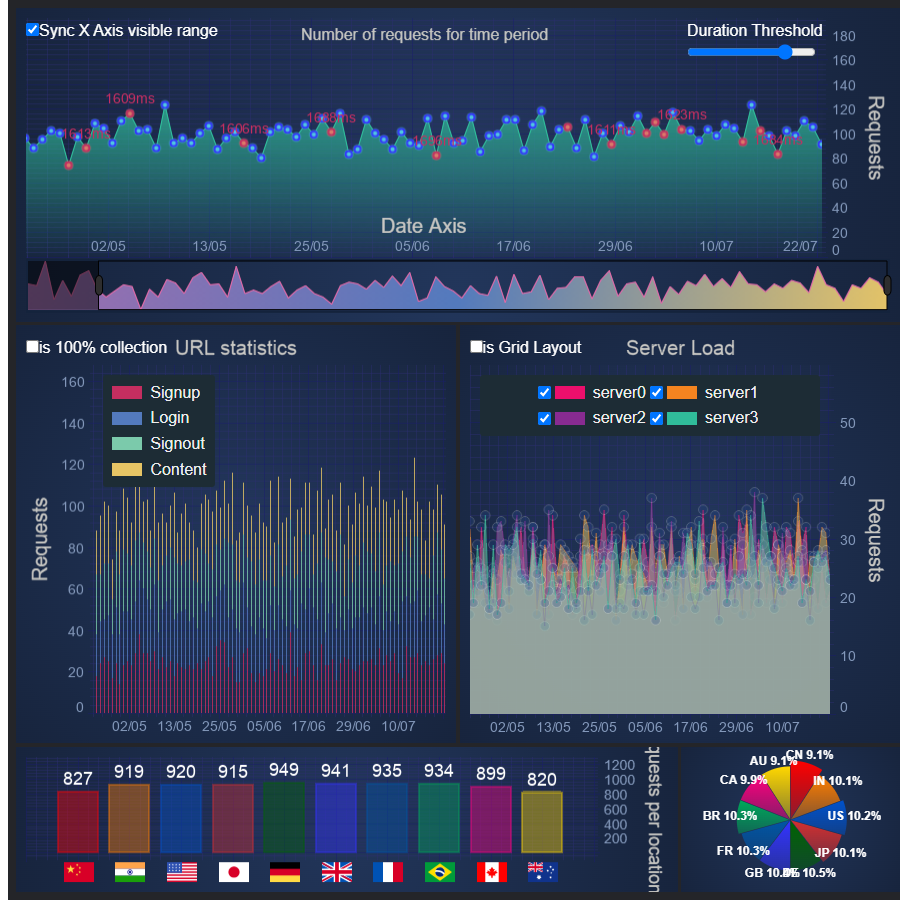
Server Traffic Dashboard
This dashboard demo showcases the incredible realtime performance of our React charts by updating the series with millions of data-points!
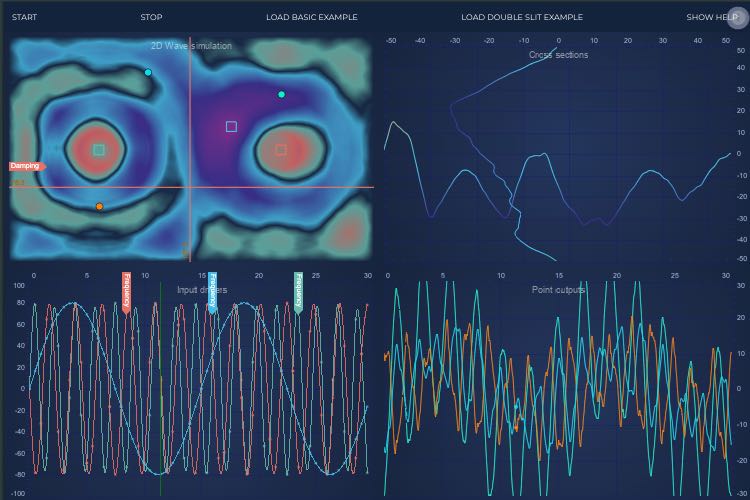
Rich Interactions Showcase
This demo showcases the incredible realtime performance of our React charts by updating the series with millions of data-points!
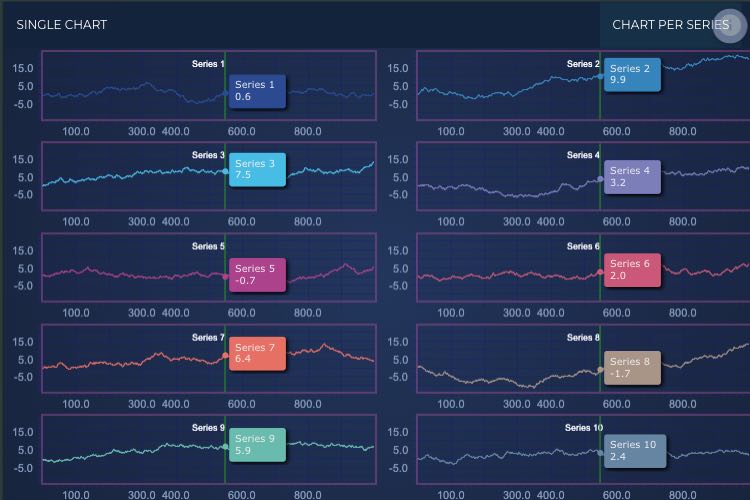
Dynamic Layout Showcase
Demonstrates a custom modifier which can convert from single chart to grid layout and back.
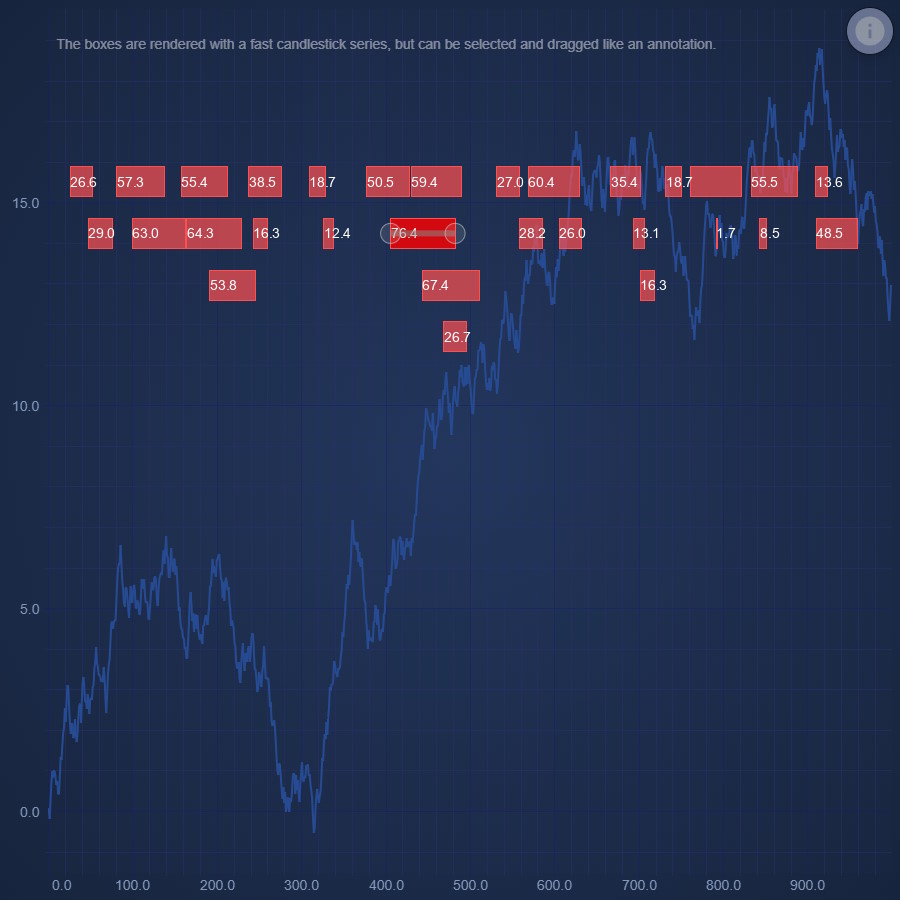
Dragabble Event Markers
Demonstrates how to repurpose a Candlestick Series into dragabble, labled, event markers
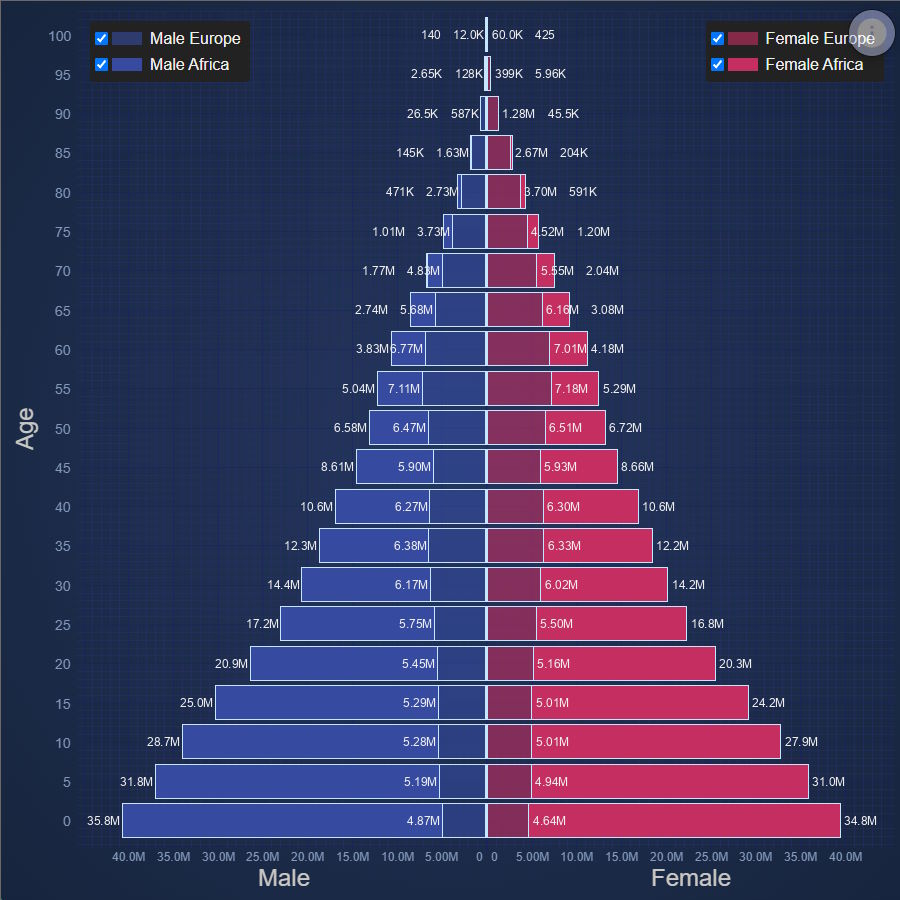
React Population Pyramid
Population Pyramid of Europe and Africa