Load 1 Million Points Performance Demo
Showcases how SciChart.js can load and display 1-Million Data-points in milliseconds. Click the Reload button at the bottom of the demo to see the chart draw again.
drawExample.ts
index.tsx
theme.ts
1import {
2    EAxisAlignment,
3    EAutoRange,
4    ECoordinateMode,
5    EHorizontalAnchorPoint,
6    EAnnotationLayer,
7    EVerticalAnchorPoint,
8    FastLineRenderableSeries,
9    MouseWheelZoomModifier,
10    NumericAxis,
11    NumberRange,
12    SciChartSurface,
13    TextAnnotation,
14    XyDataSeries,
15    ZoomExtentsModifier,
16    ZoomPanModifier,
17} from "scichart";
18
19import { appTheme } from "../../../theme";
20
21export type TTimeSpan = {
22    title: string;
23    durationMs: number;
24};
25
26export const drawExample = async (rootElement: string | HTMLDivElement) => {
27    const { wasmContext, sciChartSurface } = await SciChartSurface.create(rootElement, {
28        theme: appTheme.SciChartJsTheme,
29    });
30
31    sciChartSurface.xAxes.add(
32        new NumericAxis(wasmContext, {
33            // axisTitle: "X Axis",
34            visibleRange: new NumberRange(0, 1000000),
35            autoRange: EAutoRange.Never,
36            useNativeText: true,
37        })
38    );
39    sciChartSurface.yAxes.add(
40        new NumericAxis(wasmContext, {
41            // axisTitle: "Y Axis",
42            axisAlignment: EAxisAlignment.Left,
43            visibleRange: new NumberRange(-5000, 5000),
44            autoRange: EAutoRange.Never,
45            useNativeText: true,
46        })
47    );
48
49    const watermarkAnnotation = (text: string, offset: number = 0) => {
50        const annotation = new TextAnnotation({
51            text,
52            fontSize: 42,
53            fontWeight: "Bold",
54            textColor: appTheme.ForegroundColor,
55            x1: 0.5,
56            y1: 0.5,
57            yCoordShift: offset,
58            opacity: 0.33,
59            horizontalAnchorPoint: EHorizontalAnchorPoint.Center,
60            verticalAnchorPoint: EVerticalAnchorPoint.Center,
61            xCoordinateMode: ECoordinateMode.Relative,
62            yCoordinateMode: ECoordinateMode.Relative,
63            annotationLayer: EAnnotationLayer.BelowChart,
64        });
65
66        return annotation;
67    };
68    // add a title annotation
69    sciChartSurface.annotations.add(watermarkAnnotation("SciChart.js Performance Demo"));
70    sciChartSurface.annotations.add(watermarkAnnotation("1 Million Data-Points", 52));
71
72    const POINTS = 1_000_000;
73
74    const dataSeries = new XyDataSeries(wasmContext, { capacity: POINTS, isSorted: true, containsNaN: false });
75    sciChartSurface.renderableSeries.add(
76        new FastLineRenderableSeries(wasmContext, {
77            dataSeries,
78            stroke: appTheme.VividSkyBlue,
79            strokeThickness: 2,
80        })
81    );
82
83    sciChartSurface.chartModifiers.add(
84        new ZoomExtentsModifier(),
85        new ZoomPanModifier({ enableZoom: true }),
86        new MouseWheelZoomModifier()
87    );
88
89    let updateTimeSpans: (newTimeSpans: TTimeSpan[]) => void = () => null;
90
91    const xValues = new Float64Array(POINTS);
92    const yValues = new Float64Array(POINTS);
93
94    // Buttons for chart
95    const loadPoints = () => {
96        // Clear state
97        dataSeries.clear();
98        const newTimeSpans: TTimeSpan[] = [];
99
100        // Start clouting Points generation time
101        const generateTimestamp = Date.now();
102
103        let prevYValue = 0;
104        for (let i = 0; i < POINTS; i++) {
105            const curYValue = Math.random() * 10 - 5;
106
107            xValues[i] = i;
108            yValues[i] = prevYValue + curYValue;
109
110            prevYValue += curYValue;
111        }
112
113        // Add the first time span: Generating 1M data points
114        newTimeSpans.push({
115            title: "Generate 1M Data Points",
116            durationMs: Date.now() - generateTimestamp,
117        });
118
119        // Start counting batch append time
120        const appendTimestamp = Date.now();
121        dataSeries.appendRange(xValues, yValues);
122
123        // Add the second time span: Generation of data point
124        newTimeSpans.push({
125            title: "Append 1M Data Points",
126            durationMs: Date.now() - appendTimestamp,
127        });
128
129        // Subscribe to sciChartSurface.rendered event,
130        // and calculate time duration between the append and
131        // the first frame after it
132        const firstFrameTimestamp = Date.now();
133        let frameIndex: number = 0;
134        let nextFramesTimestamp: number;
135        const handler = () => {
136            if (frameIndex === 0) {
137                // Add the third time span: Render the first frame
138                newTimeSpans.push({
139                    title: "Render the frame",
140                    durationMs: Date.now() - firstFrameTimestamp,
141                });
142                nextFramesTimestamp = Date.now();
143            } else {
144                // Unsubscribe from sciChartSurface.rendered
145                updateTimeSpans(newTimeSpans);
146                sciChartSurface.rendered.unsubscribe(handler);
147
148                // Zoom extents at the end of performance measurement
149                sciChartSurface.zoomExtents(250);
150            }
151            setTimeout(sciChartSurface.invalidateElement, 0);
152            // Increment frame index
153            frameIndex++;
154        };
155        sciChartSurface.rendered.subscribe(handler);
156    };
157
158    let timerId: NodeJS.Timeout;
159    const startUpdate = () => {
160        timerId = setInterval(loadPoints, 200);
161    };
162
163    const stopUpdate = () => {
164        clearInterval(timerId);
165    };
166
167    const reloadOnce = () => {
168        loadPoints();
169    };
170
171    const subscribeToInfo = (listener: (newTimeSpans: TTimeSpan[]) => void) => {
172        updateTimeSpans = listener;
173    };
174
175    return { sciChartSurface, controls: { startUpdate, stopUpdate, reloadOnce, subscribeToInfo } };
176};
177
See Also: Performance Demos & Showcases (11 Demos)
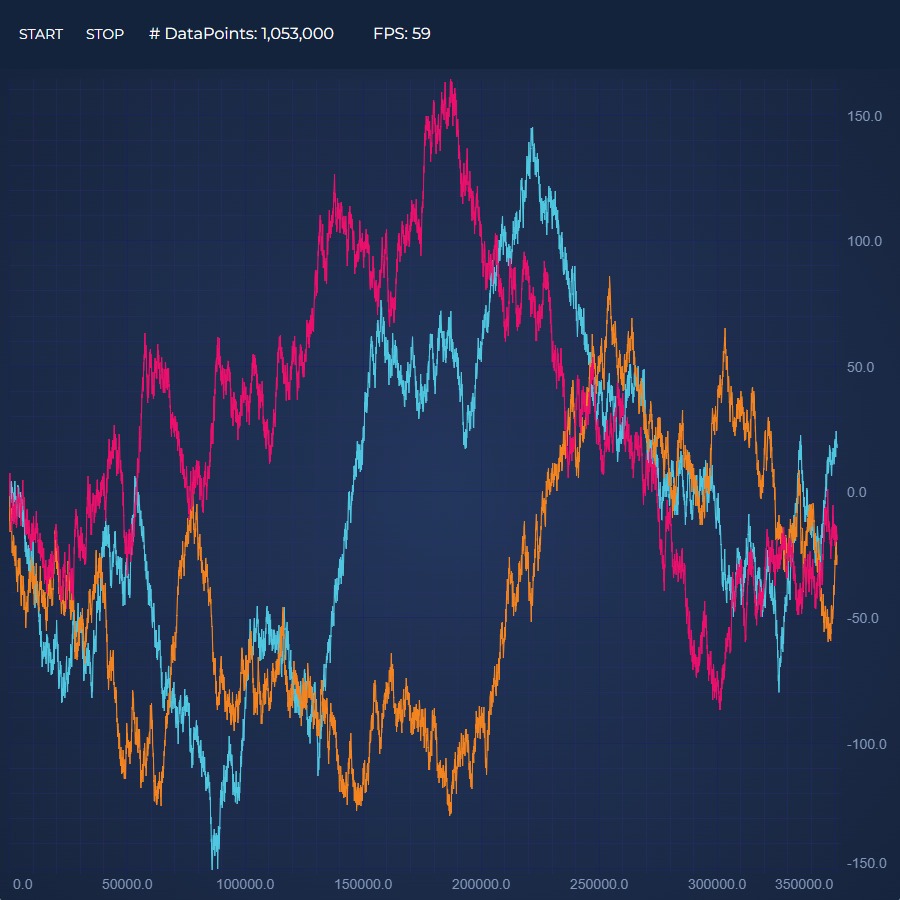
Realtime React Chart Performance Demo
This demo showcases the incredible realtime performance of our React charts by updating the series with millions of data-points!
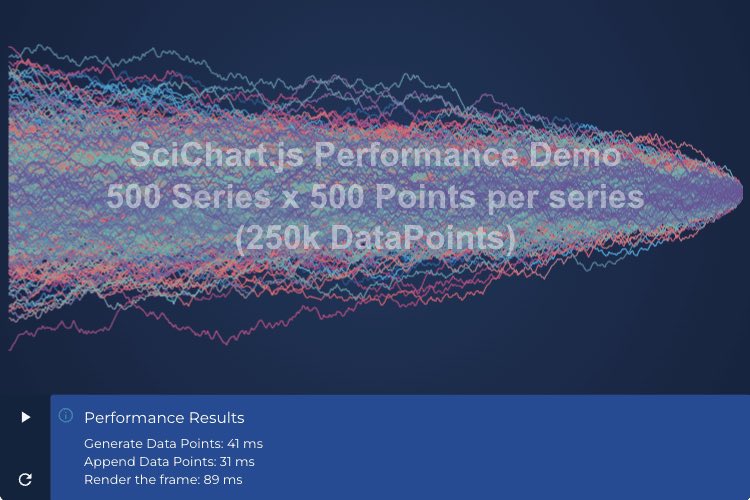
Load 500 Series x 500 Points Performance Demo
This demo showcases the incredible performance of our React Chart by loading 500 series with 500 points (250k points) instantly!
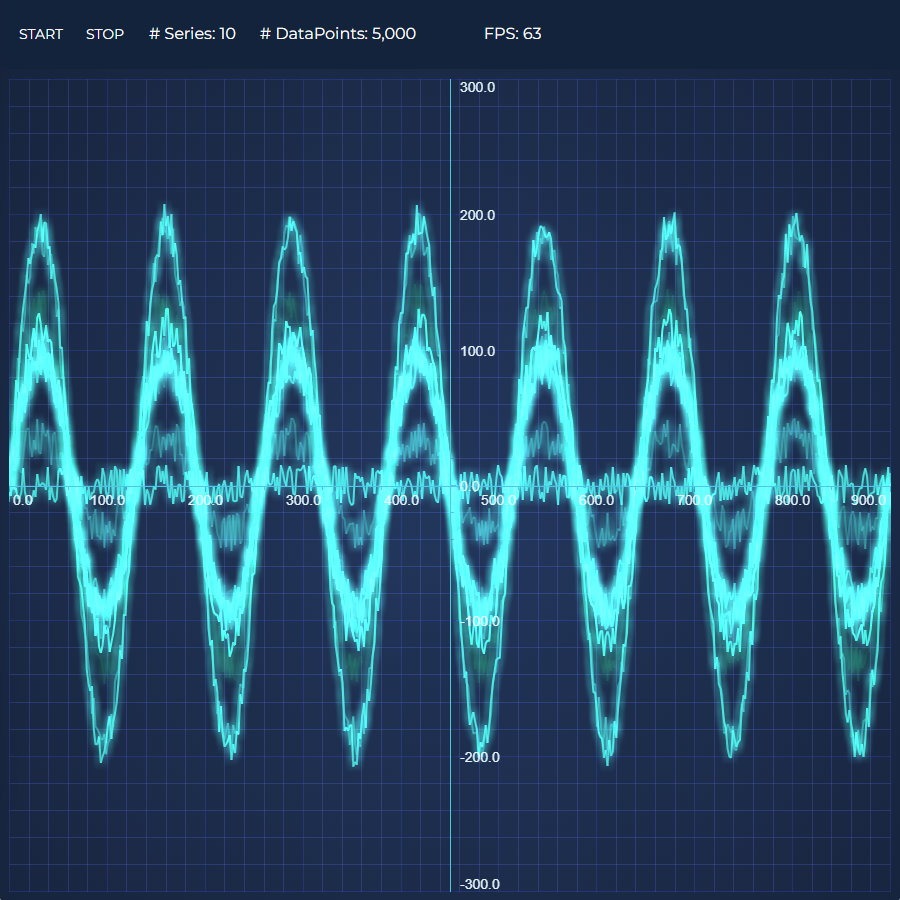
Realtime Ghosted Traces
This demo showcases the realtime performance of our React Chart by animating several series with thousands of data-points at 60 FPS

Realtime Audio Analyzer Demo
Demonstrating the capability of SciChart.js to create a JavaScript Audio Analyzer and visualize the Fourier-Transform of an audio waveform in realtime.
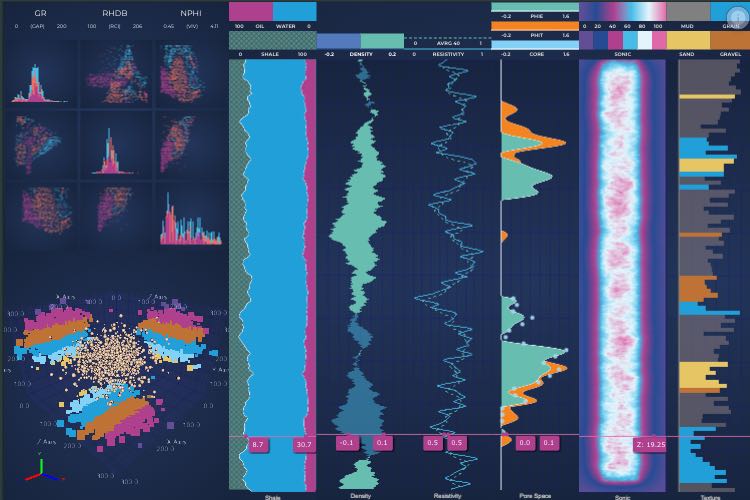
Oil & Gas Explorer React Dashboard
Demonstrates how to create Oil and Gas Dashboard
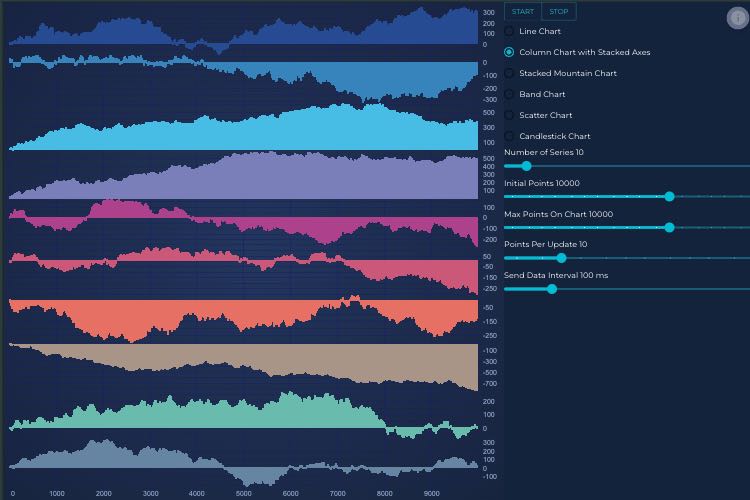
Client/Server Websocket Data Streaming
This demo showcases the incredible realtime performance of our JavaScript charts by updating the series with millions of data-points!
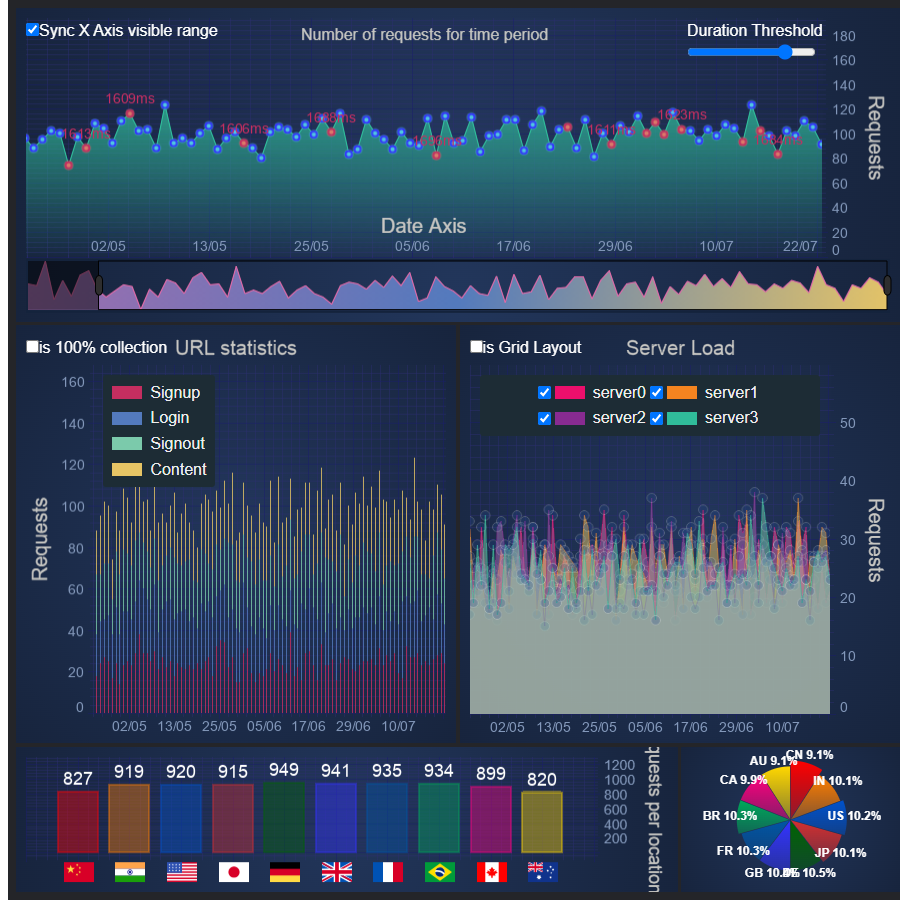
Server Traffic Dashboard
This dashboard demo showcases the incredible realtime performance of our React charts by updating the series with millions of data-points!
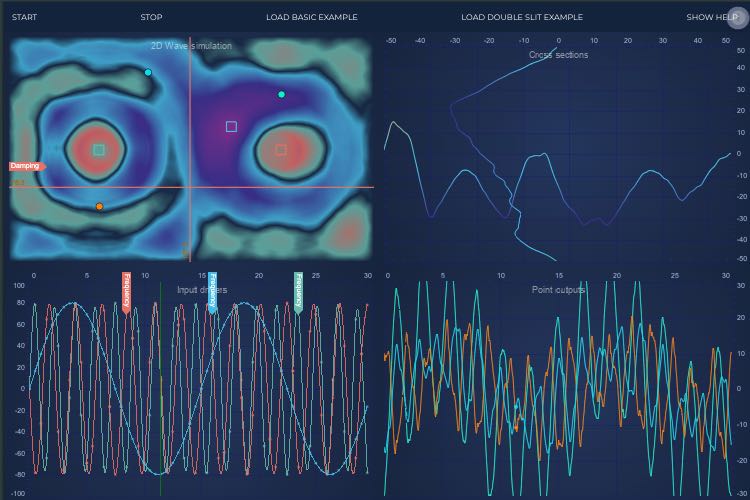
Rich Interactions Showcase
This demo showcases the incredible realtime performance of our React charts by updating the series with millions of data-points!
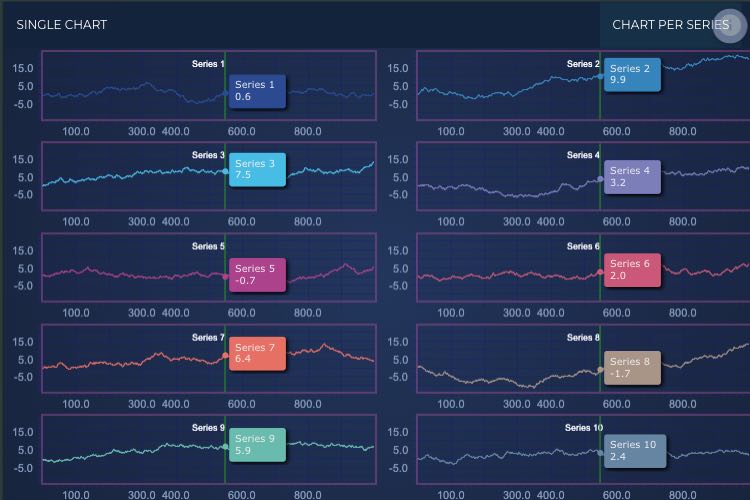
Dynamic Layout Showcase
Demonstrates a custom modifier which can convert from single chart to grid layout and back.
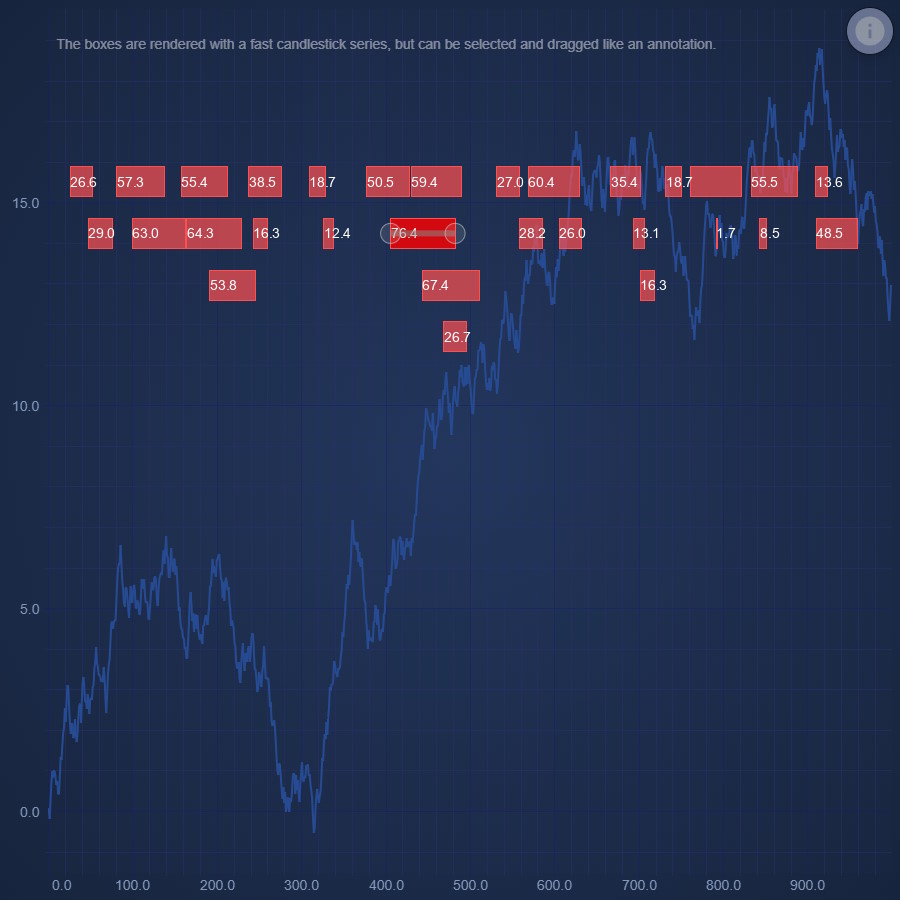
Dragabble Event Markers
Demonstrates how to repurpose a Candlestick Series into dragabble, labled, event markers
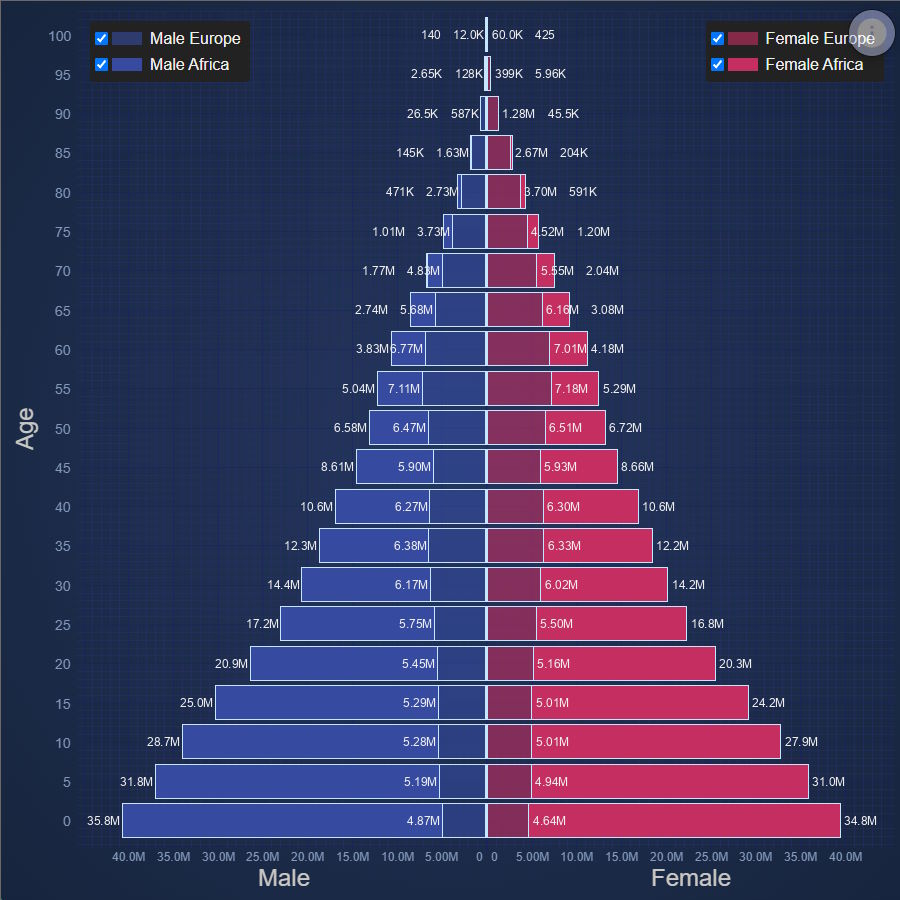
React Population Pyramid
Population Pyramid of Europe and Africa