React Quadrant Chart using Background Annotations
Demonstrates how to color areas of the chart surface using background Annotations using SciChart.js, High Performance JavaScript Charts
drawExample.ts
index.tsx
theme.ts
data.ts
1import { appTheme } from "../../../theme";
2import { happinessData } from "./data";
3import {
4    SciChartSurface,
5    NumericAxis,
6    NumberRange,
7    ZoomPanModifier,
8    BoxAnnotation,
9    TextAnnotation,
10    EAnnotationLayer,
11    NativeTextAnnotation,
12    EAxisAlignment,
13    MouseWheelZoomModifier,
14    FastBubbleRenderableSeries,
15    XyzDataSeries,
16    IPointMetadata,
17    ZoomExtentsModifier,
18    EllipsePointMarker,
19    CursorModifier,
20    LogarithmicAxis,
21    ENumericFormat,
22    DefaultPaletteProvider,
23    TPointMarkerArgb,
24    parseColorToUIntArgb,
25    EHorizontalTextPosition,
26    EVerticalTextPosition,
27    SeriesInfo,
28    XyzSeriesInfo,
29    SweepAnimation,
30    ECoordinateMode,
31    EVerticalAnchorPoint,
32    SciChartLegend,
33    ManualLegend,
34} from "scichart";
35
36class ContinentPaletteProvider extends DefaultPaletteProvider {
37    Europe = parseColorToUIntArgb(appTheme.VividBlue);
38    Asia = parseColorToUIntArgb(appTheme.VividPurple);
39    NorthAmerica = parseColorToUIntArgb(appTheme.VividPink);
40    Oceania = parseColorToUIntArgb(appTheme.VividTeal);
41    SouthAmerica = parseColorToUIntArgb(appTheme.VividGreen);
42    Africa = parseColorToUIntArgb(appTheme.VividOrange);
43
44    override overridePointMarkerArgb(
45        xValue: number,
46        yValue: number,
47        index: number,
48        opacity?: number,
49        metadata?: IPointMetadata
50    ): TPointMarkerArgb {
51        let fill: number;
52        // @ts-ignore
53        switch (metadata.continent) {
54            case "Europe":
55                fill = this.Europe;
56                break;
57            case "Asia":
58                fill = this.Asia;
59                break;
60            case "North America":
61                fill = this.NorthAmerica;
62                break;
63            case "Oceania":
64                fill = this.Oceania;
65                break;
66            case "South America":
67                fill = this.SouthAmerica;
68                break;
69            case "Africa":
70                fill = this.Africa;
71                break;
72            default:
73                break;
74        }
75        return { fill, stroke: undefined };
76    }
77}
78
79export const drawExample = async (rootElement: string | HTMLDivElement) => {
80    // Create a SciChartSurface
81    const { sciChartSurface, wasmContext } = await SciChartSurface.create(rootElement, {
82        theme: appTheme.SciChartJsTheme,
83        title: "Happiness vs GDP",
84        titleStyle: { fontSize: 20 },
85    });
86
87    // Create an XAxis and YAxis
88    const xAxis = new LogarithmicAxis(wasmContext, {
89        growBy: new NumberRange(0.1, 0.1),
90        labelPrefix: "$",
91        labelFormat: ENumericFormat.SignificantFigures,
92        labelPrecision: 2,
93        cursorLabelFormat: ENumericFormat.Decimal,
94        logBase: 10,
95        drawMinorGridLines: false,
96        axisTitle: "GDP per Capita",
97        axisTitleStyle: { fontSize: 16 },
98    });
99    sciChartSurface.xAxes.add(xAxis);
100
101    const yAxis = new NumericAxis(wasmContext, {
102        growBy: new NumberRange(0.1, 0.1),
103        axisAlignment: EAxisAlignment.Left,
104        drawMinorGridLines: false,
105        axisTitle: "Happiness",
106        axisTitleStyle: { fontSize: 16 },
107    });
108    sciChartSurface.yAxes.add(yAxis);
109
110    // Optional: Add some interactivity modifiers
111    sciChartSurface.chartModifiers.add(
112        new ZoomPanModifier({ enableZoom: true }),
113        new MouseWheelZoomModifier(),
114        new ZoomExtentsModifier(),
115        new CursorModifier({
116            showTooltip: true,
117            hitTestRadius: 1,
118            tooltipContainerBackground: appTheme.MutedRed,
119            showAxisLabels: false,
120            showXLine: false,
121            showYLine: false,
122            tooltipDataTemplate: (seriesInfos: SeriesInfo[], tooltipTitle: string) => {
123                const valuesWithLabels: string[] = [];
124                const xyzSeriesInfo = seriesInfos[0] as XyzSeriesInfo;
125                if (xyzSeriesInfo?.isHit) {
126                    // @ts-ignore
127                    valuesWithLabels.push(`${xyzSeriesInfo.pointMetadata.name}`);
128                    valuesWithLabels.push(`GDP: ${xyzSeriesInfo.formattedXValue}`);
129                    valuesWithLabels.push(`Happiness: ${xyzSeriesInfo.formattedYValue}`);
130                    valuesWithLabels.push(`Population: ${xyzSeriesInfo.formattedZValue}`);
131                }
132                return valuesWithLabels;
133            },
134        })
135    );
136
137    // These boxes are set up so that x1,y1 is the outer corner and x2,y2 is the centre of the data
138    const x2 = 10000;
139    const y2 = 5;
140    const box1 = new BoxAnnotation({
141        annotationLayer: EAnnotationLayer.Background,
142        fill: appTheme.PaleBlue,
143        strokeThickness: 0,
144        x1: -10,
145        x2,
146        y1: 10,
147        y2,
148    });
149    const box2 = new BoxAnnotation({
150        annotationLayer: EAnnotationLayer.Background,
151        fill: appTheme.PalePurple,
152        strokeThickness: 0,
153        x1: 10,
154        x2,
155        y1: 10,
156        y2,
157    });
158    const box3 = new BoxAnnotation({
159        annotationLayer: EAnnotationLayer.Background,
160        fill: appTheme.PalePink,
161        strokeThickness: 0,
162        x1: -10,
163        x2,
164        y1: -10,
165        y2,
166    });
167    const box4 = new BoxAnnotation({
168        annotationLayer: EAnnotationLayer.Background,
169        fill: appTheme.PaleTeal,
170        strokeThickness: 0,
171        x1: 10,
172        x2,
173        y1: -10,
174        y2,
175    });
176
177    // update the outer corners of each box before the chart draws so that they always fill the plane
178    sciChartSurface.preRender.subscribe((data) => {
179        box1.x1 = xAxis.visibleRange.min;
180        box2.x1 = xAxis.visibleRange.max;
181        box3.x1 = xAxis.visibleRange.min;
182        box4.x1 = xAxis.visibleRange.max;
183        box1.y1 = yAxis.visibleRange.min;
184        box2.y1 = yAxis.visibleRange.min;
185        box3.y1 = yAxis.visibleRange.max;
186        box4.y1 = yAxis.visibleRange.max;
187    });
188    sciChartSurface.annotations.add(box1, box2, box3, box4);
189    const xValues: number[] = [];
190    const yValues: number[] = [];
191    const zValues: number[] = [];
192    const metadata: any[] = [];
193    for (const item of happinessData) {
194        xValues.push(parseFloat(item.GDP));
195        yValues.push(parseFloat(item.Happiness));
196        zValues.push((Math.log2(parseInt(item.Population)) - 18) * 5);
197        //console.log(item.Entity, parseFloat(item.GDP), parseFloat(item.Happiness));
198        metadata.push({ isSelected: false, name: item.Entity, continent: item.Continent });
199    }
200    const dataSeries = new XyzDataSeries(wasmContext, { xValues, yValues, zValues, metadata });
201    const series = new FastBubbleRenderableSeries(wasmContext, {
202        dataSeries,
203        paletteProvider: new ContinentPaletteProvider(),
204        pointMarker: new EllipsePointMarker(wasmContext, {
205            width: 64,
206            height: 64,
207            opacity: 0.6,
208        }),
209        dataLabels: {
210            color: "#000000C0",
211            style: {
212                fontFamily: "Arial",
213                fontSize: 14,
214            },
215            horizontalTextPosition: EHorizontalTextPosition.Center,
216            verticalTextPosition: EVerticalTextPosition.Below,
217            metaDataSelector: (metadata) => (metadata as any).name,
218        },
219        animation: new SweepAnimation({ duration: 2000 }),
220    });
221    sciChartSurface.renderableSeries.add(series);
222
223    const legend = new ManualLegend(
224        {
225            textColor: "black",
226            backgroundColor: "#E0E0E077",
227            items: [
228                {
229                    name: "Bubble size represents population",
230                    color: "transparent",
231                    id: "pop",
232                    checked: false,
233                    showMarker: false,
234                },
235                {
236                    name: "Bubble color indicates continent",
237                    color: "transparent",
238                    id: "col",
239                    checked: false,
240                    showMarker: false,
241                },
242                { name: "Europe", color: appTheme.VividBlue, id: "Europe", checked: false },
243                { name: "Asia", color: appTheme.VividPurple, id: "Asia", checked: false },
244                { name: "North America", color: appTheme.VividPink, id: "NorthAmerica", checked: false },
245                { name: "South America", color: appTheme.VividGreen, id: "SouthAmerica", checked: false },
246                { name: "Oceania", color: appTheme.VividBlue, id: "VividTeal", checked: false },
247                { name: "Africa", color: appTheme.VividOrange, id: "Africa", checked: false },
248            ],
249        },
250        sciChartSurface
251    );
252
253    sciChartSurface.zoomExtents();
254    return { sciChartSurface, wasmContext };
255};
256
See Also: JavaScript Chart Types (28 Demos)

React Line Chart
Discover how to create a high performance React Line Chart with SciChart - the leading JavaScript library. Get your free demo now.
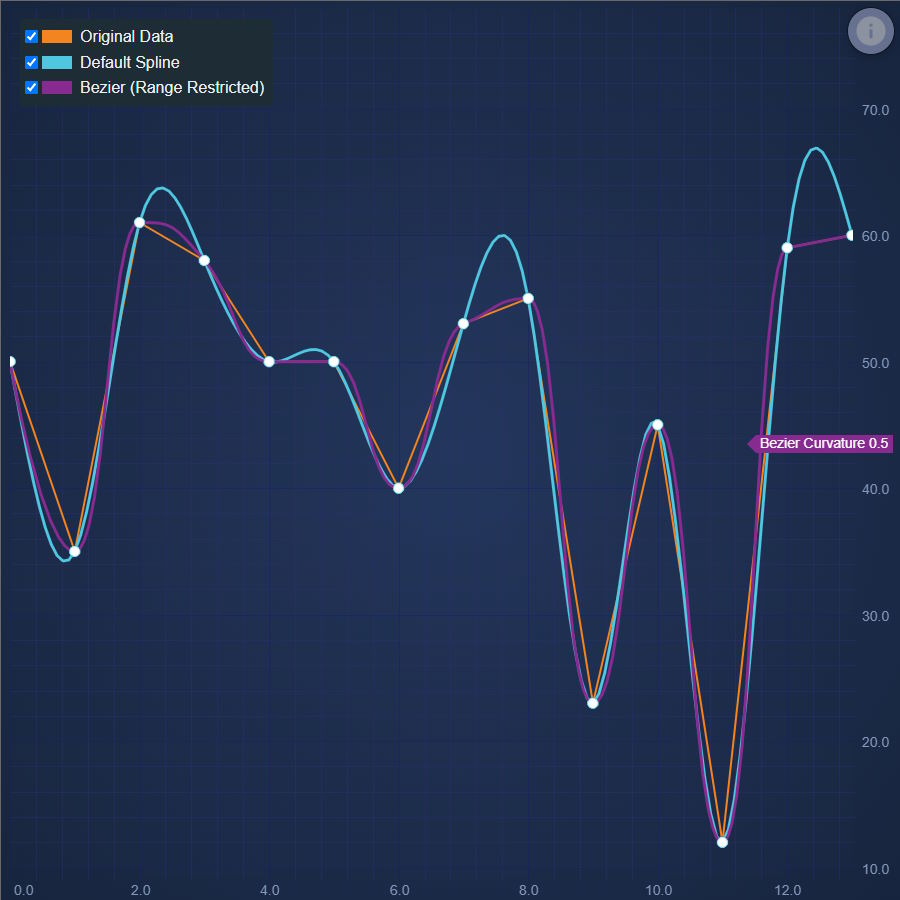
React Spline Line Chart
Discover how to create a React Spline Line Chart with SciChart. Demo includes algorithm for smoother lines. Get your free trial now.
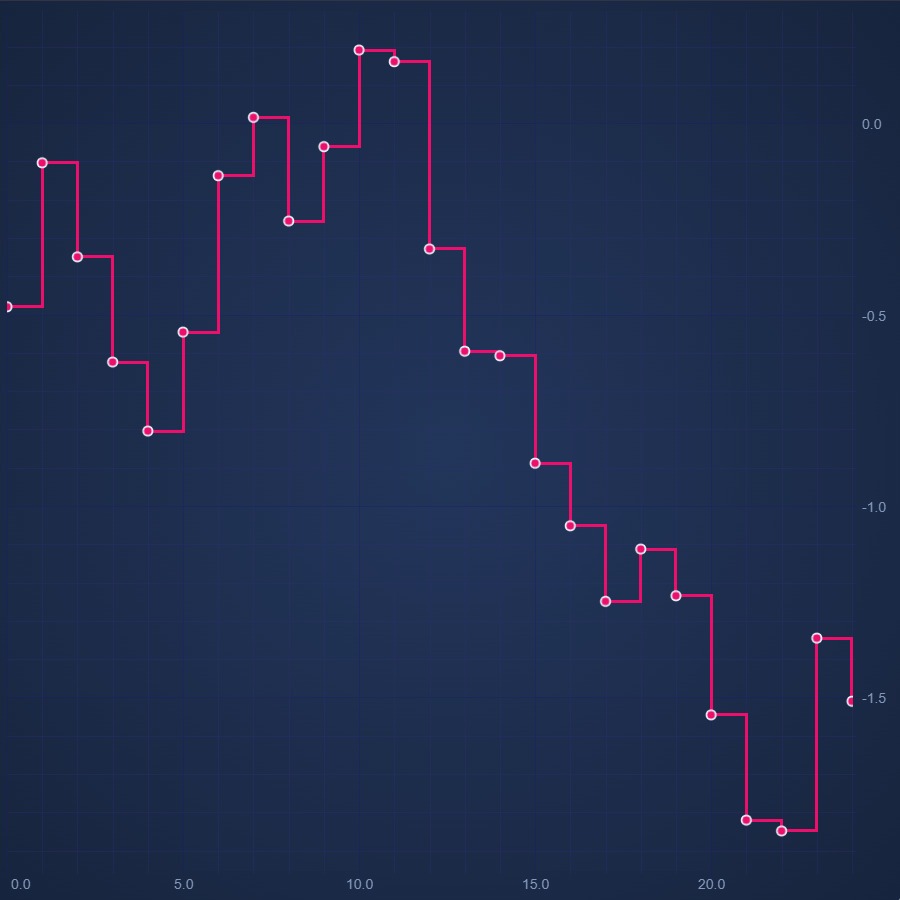
React Digital Line Chart
Discover how to create a React Digital Line Chart with SciChart - your feature-rich JavaScript Chart Library. Get your free demo now.
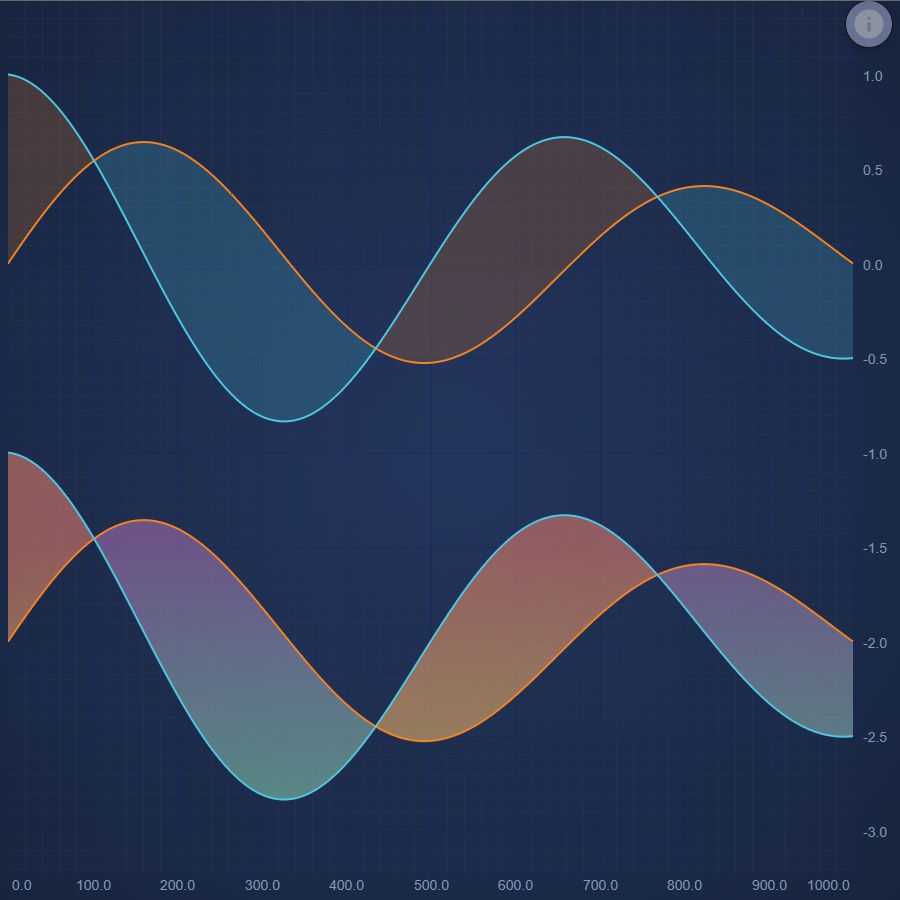
React Band Chart
Easily create a React Band Chart or High-Low Fill with SciChart - high performance JavaScript Chart Library. Get your free trial now.
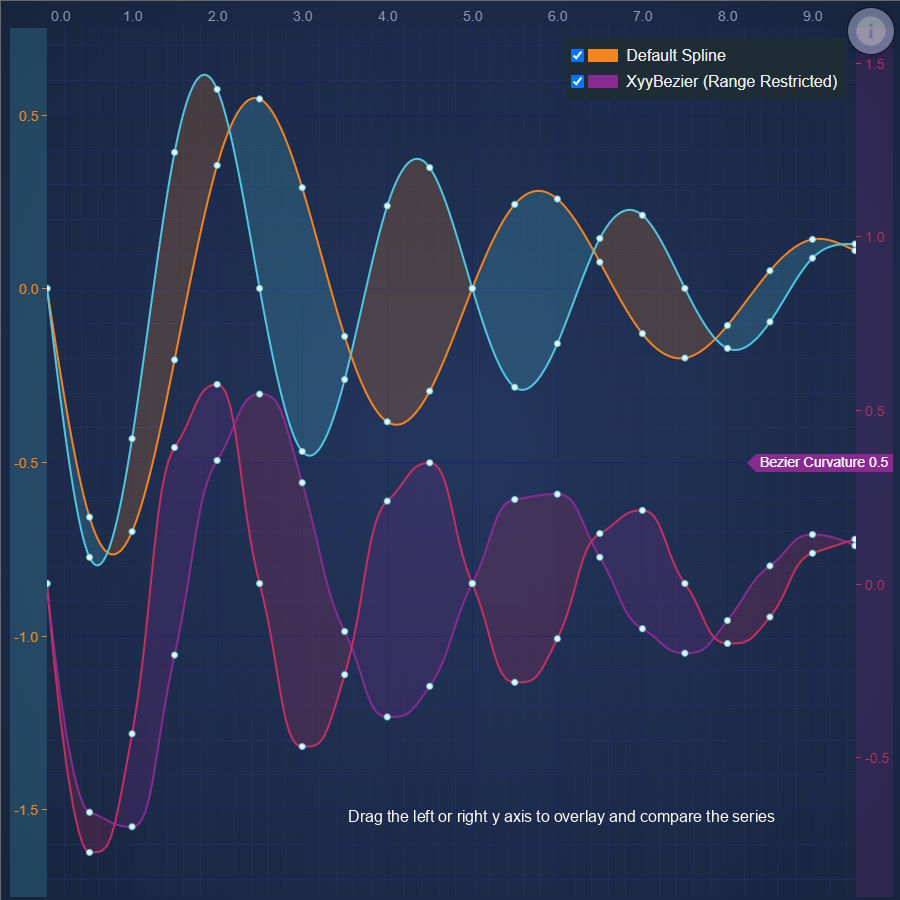
React Spline Band Chart
SciChart's React Spline Band Chart makes it easy to draw thresholds or fills between two lines on a chart. Get your free demo today.
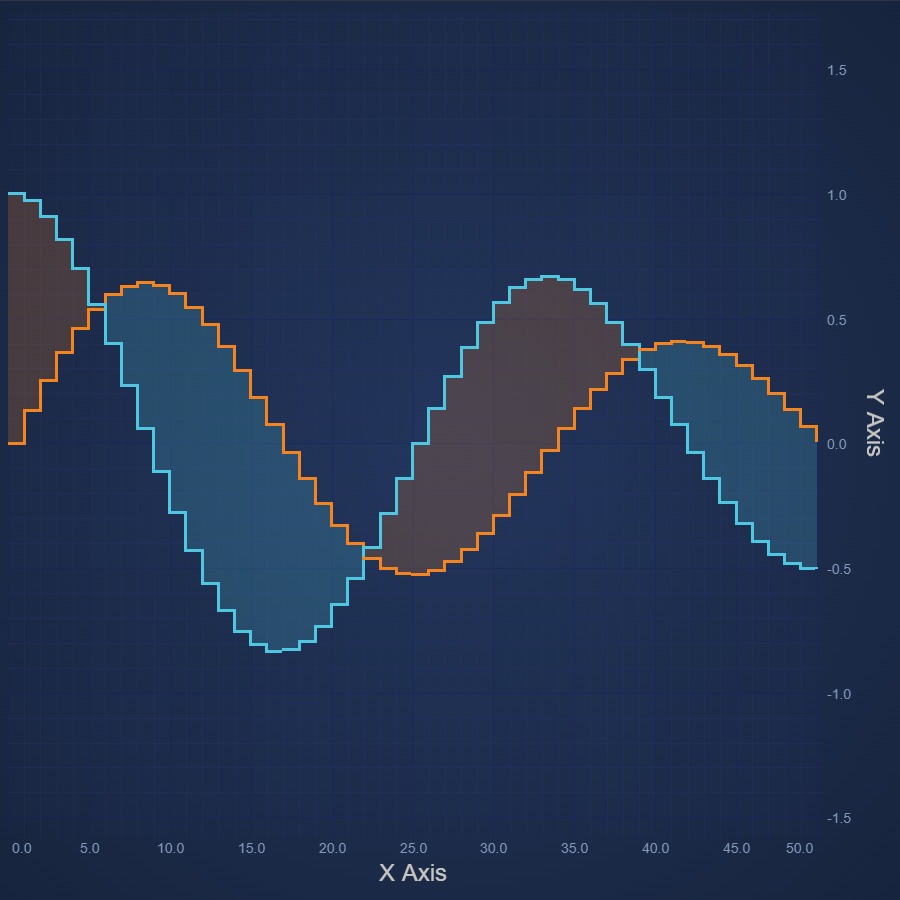
React Digital Band Chart
Learn how to create a React Digital Band Chart or High-Low Fill Chart with SciChart's easy-to-follow demos. Get your free trial today.
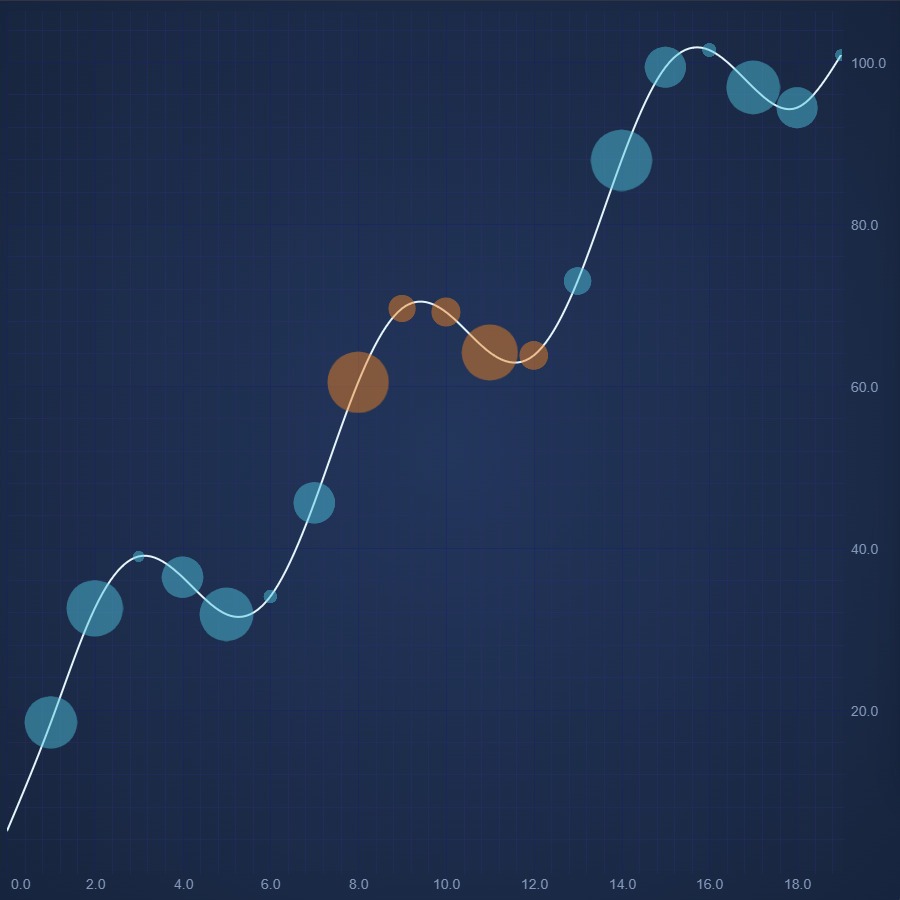
React Bubble Chart
Create a high performance React Bubble Chart with Sci-Chart. Demo shows how to draw point-markers at X,Y locations. Get your free demo now.

React Candlestick Chart
Discover how to create a React Candlestick Chart or Stock Chart using SciChart.js. For high Performance JavaScript Charts, get your free demo now.
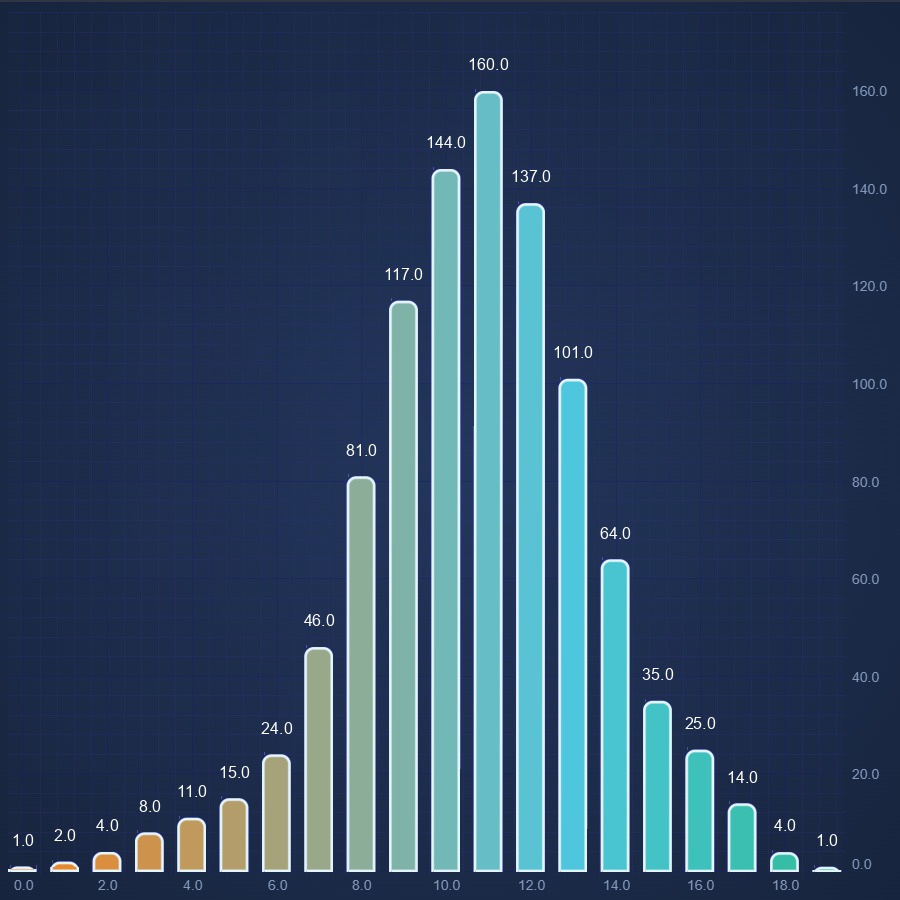
React Column Chart
React Column Chart demo by SciChart supports gradient fill and paletteproviders for more custom coloring options. Get your free demo now.
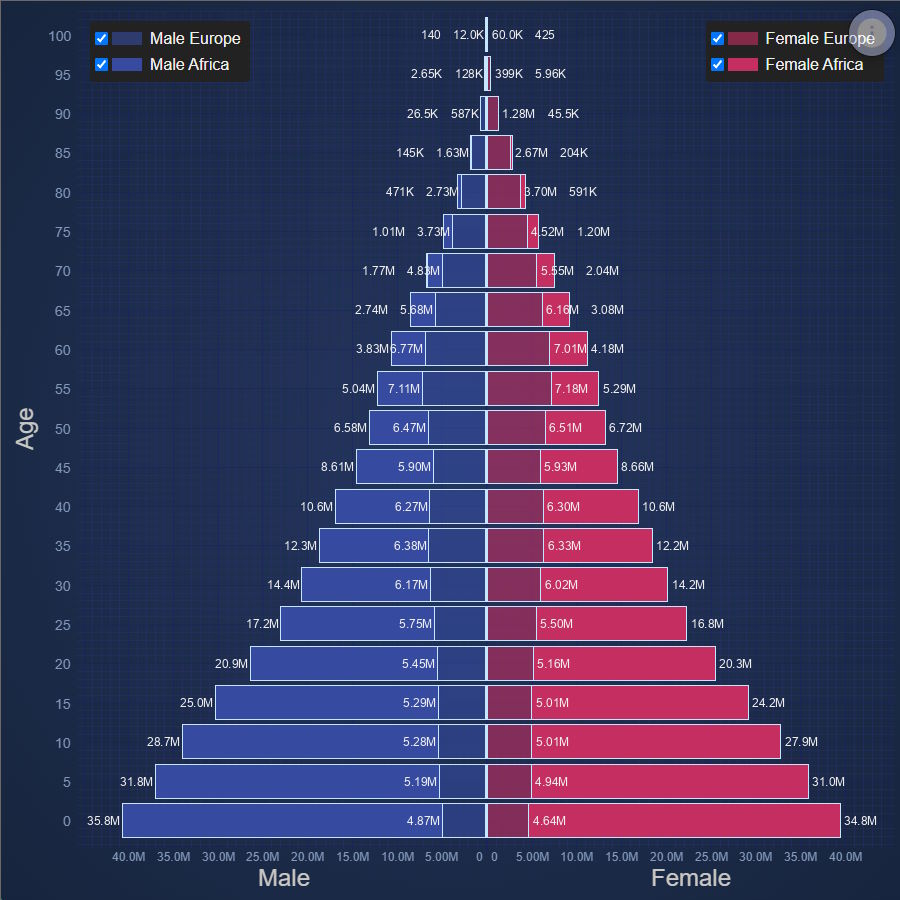
React Population Pyramid
Population Pyramid of Europe and Africa
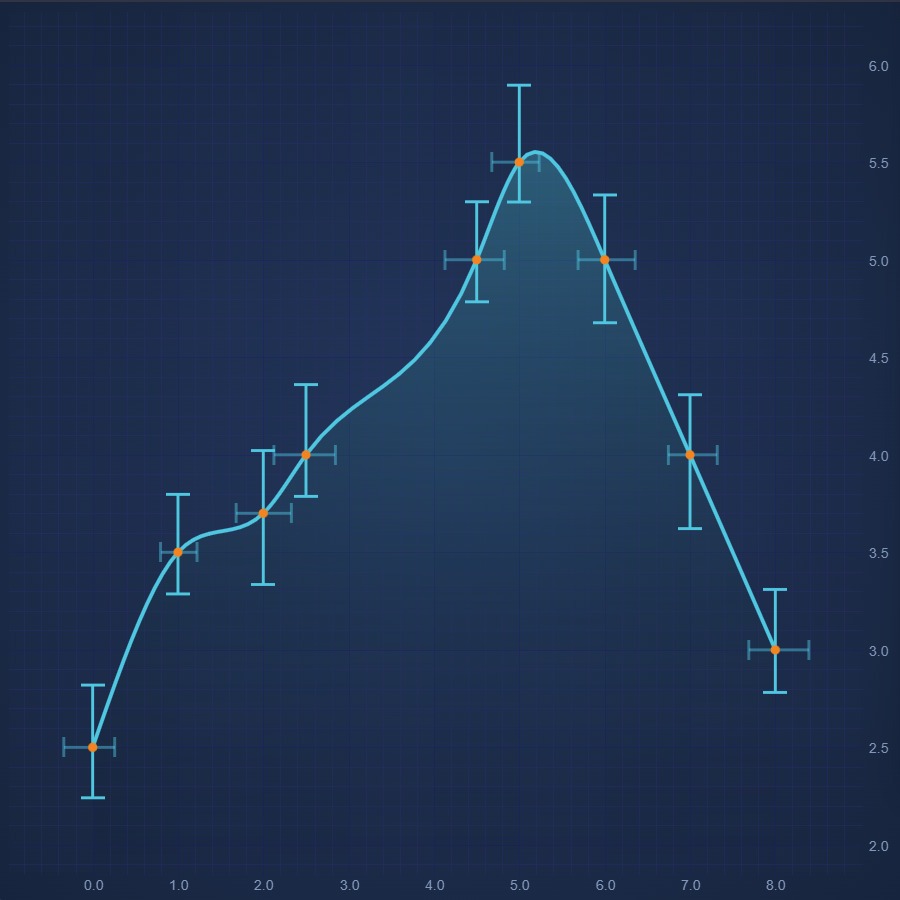
React Error Bars Chart
Create React Error Bars Chart using high performance SciChart.js. Display uncertainty or statistical confidence of a data-point. Get free demo now.
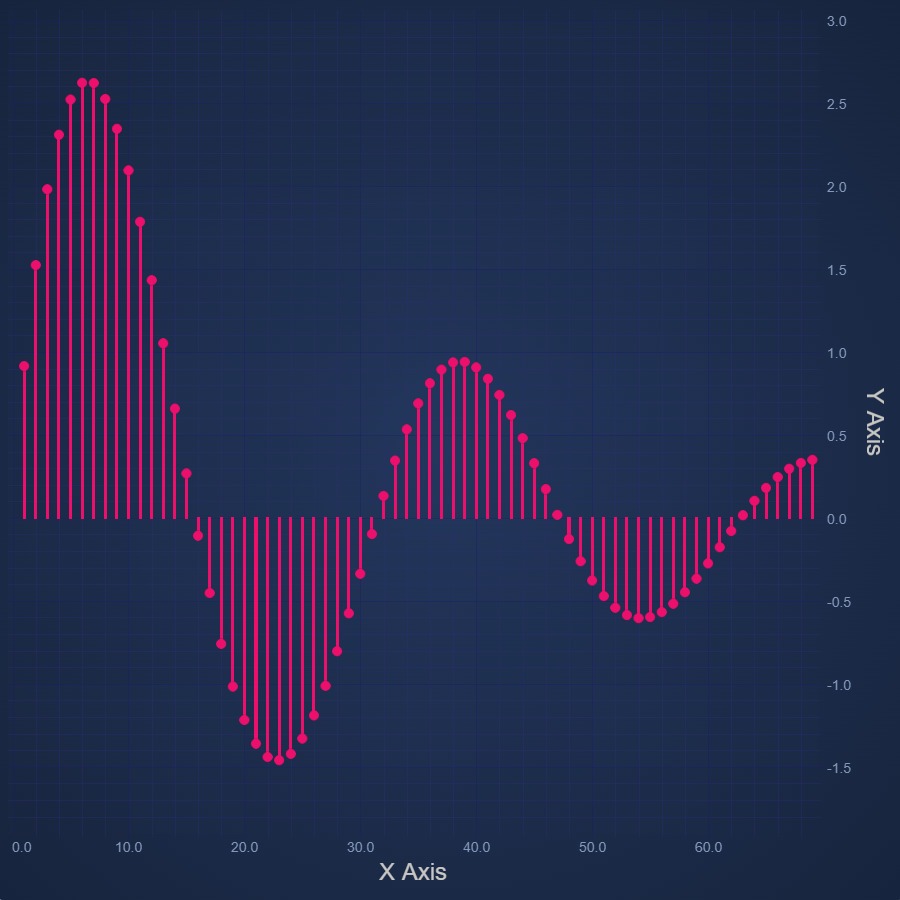
React Impulse Chart
Easily create React Impulse Chart or Stem Chart using SciChart.js - our own high performance JavaScript Chart Library. Get your free trial now.
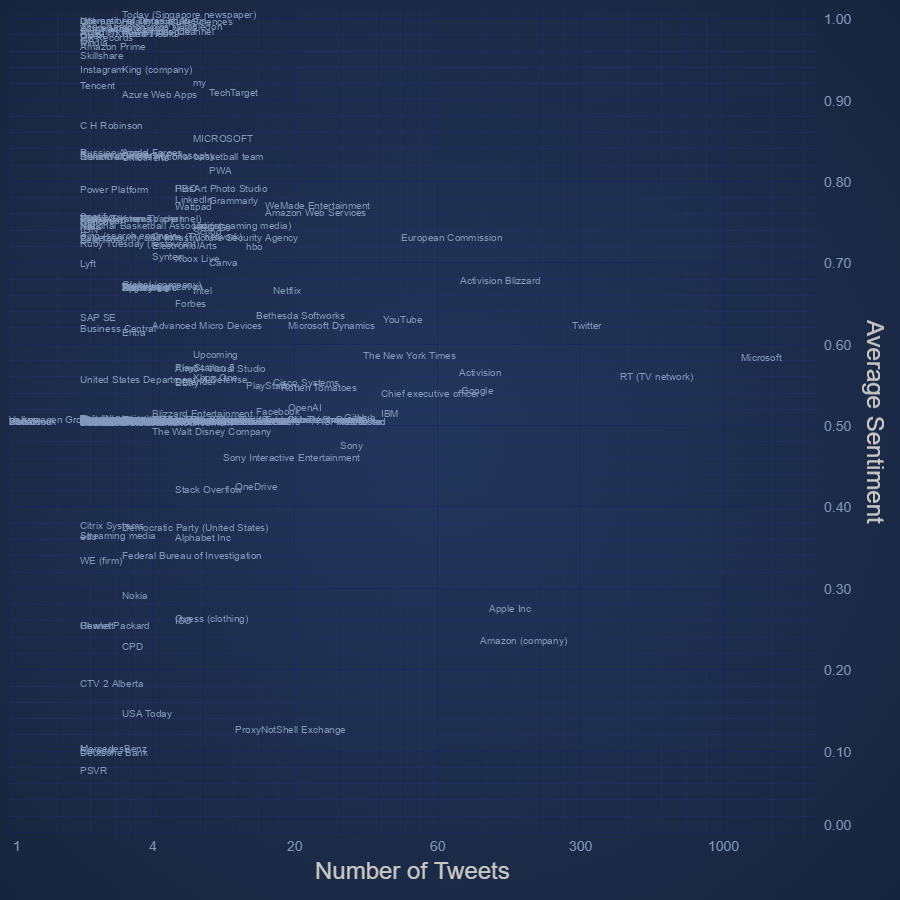
React Text Chart
Create React Text Chart with high performance SciChart.js.
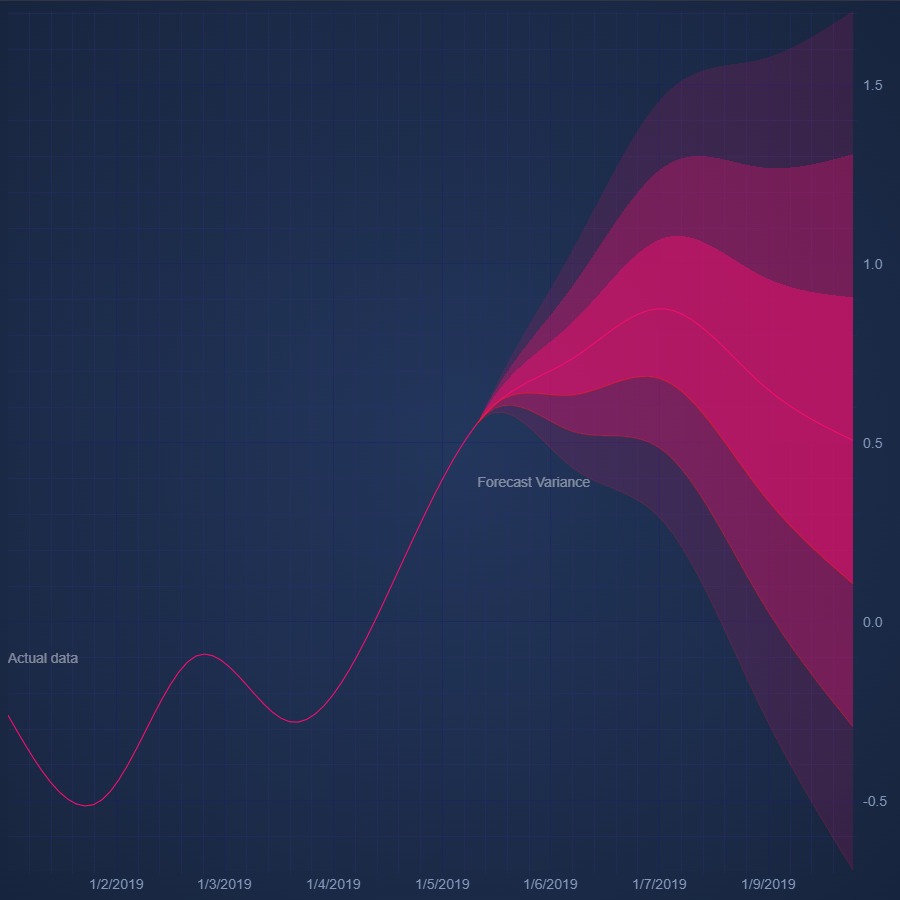
React Fan Chart
Discover how to create React Fan Chart with SciChart. Zoom in to see the detail you can go to using our JavaScript Charts. Get your free demo today.

React Heatmap Chart
Easily create a high performance React Heatmap Chart with SciChart. Get your free trial of our 5-star rated JavaScript Chart Component today.
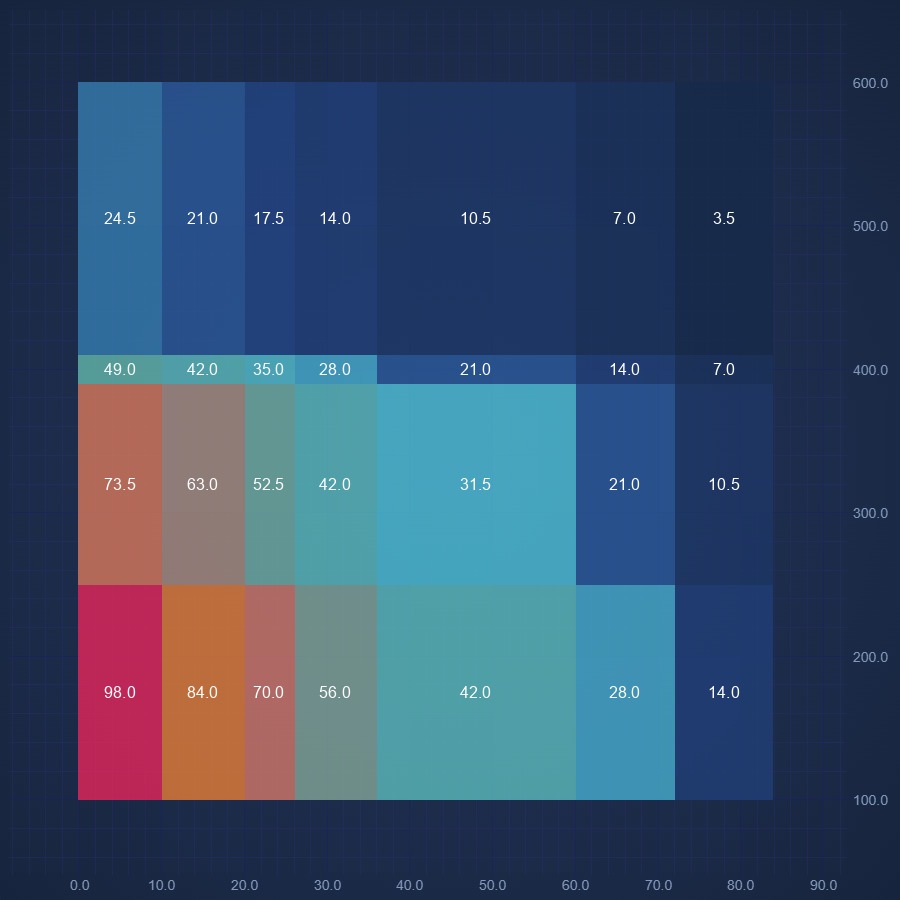
React Non Uniform Heatmap Chart
Create React Non Uniform Chart using high performance SciChart.js. Display Heatmap with variable cell sizes. Get free demo now.
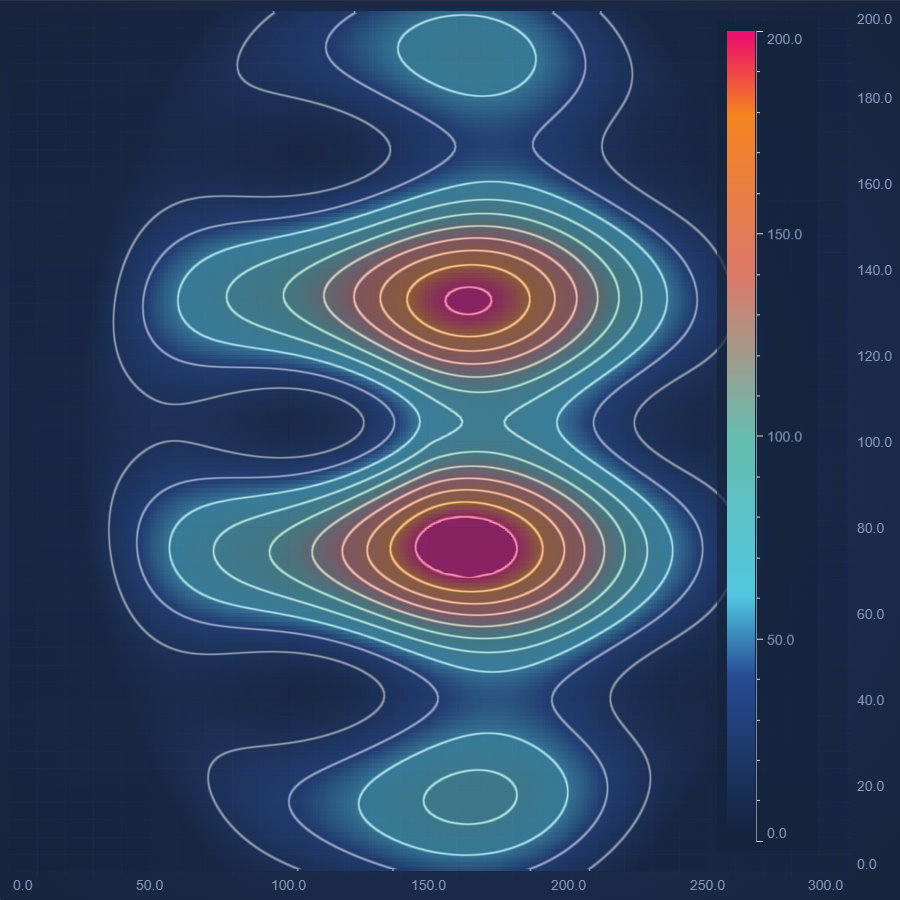
React Heatmap Chart With Contours
Design a highly dynamic React Heatmap Chart With Contours with SciChart's feature-rich JavaScript Chart Library. Get your free demo today.
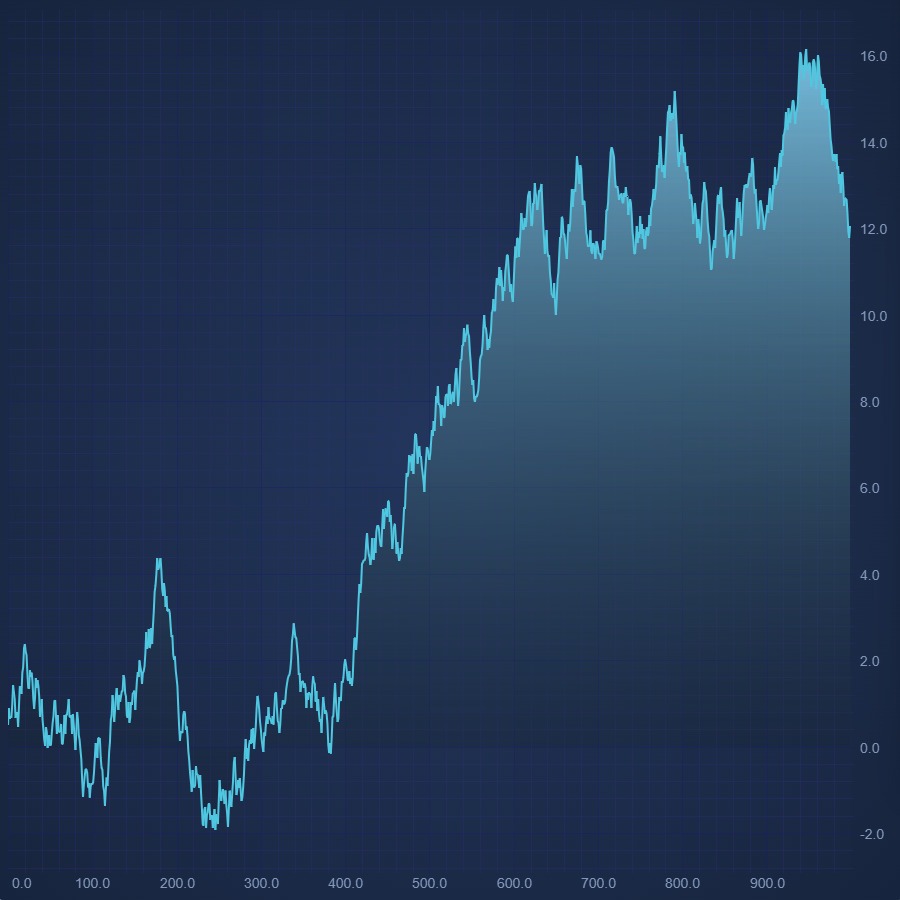
React Mountain Chart
Create React Mountain Chart with SciChart.js. Zero line can be zero or a specific value. Fill color can be solid or gradient as well. Get a free demo now.
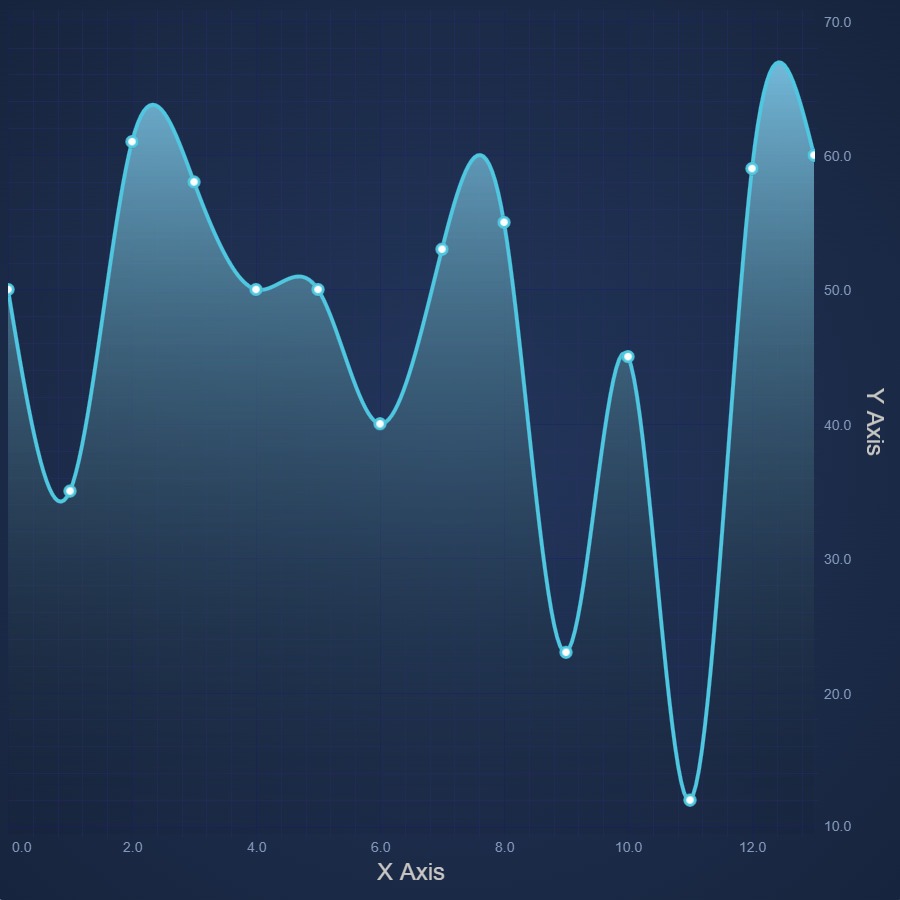
React Spline Mountain Chart
React Spline Mountain Chart design made easy. Use SciChart.js' JavaScript Charts for high performance, feature-rich designs. Get free demo now.
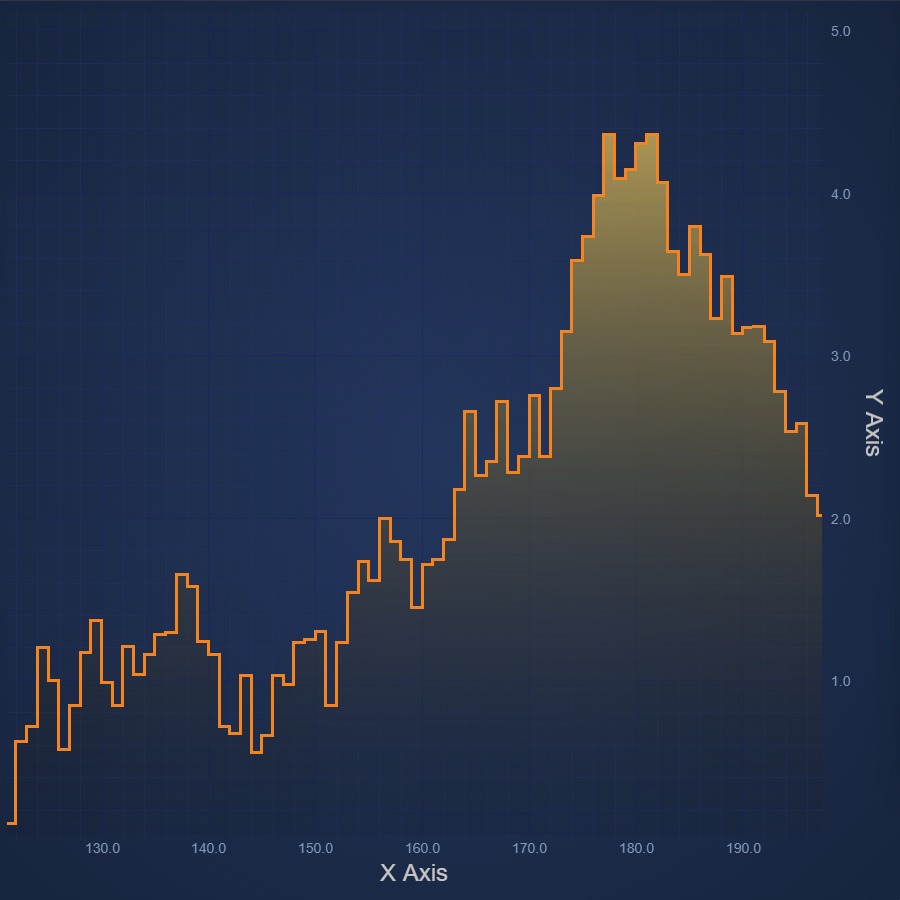
React Digital Mountain Chart
Create React Digital Mountain Chart with a stepped-line visual effect. Get your free trial of SciChart's 5-star rated JavaScript Chart Component now.
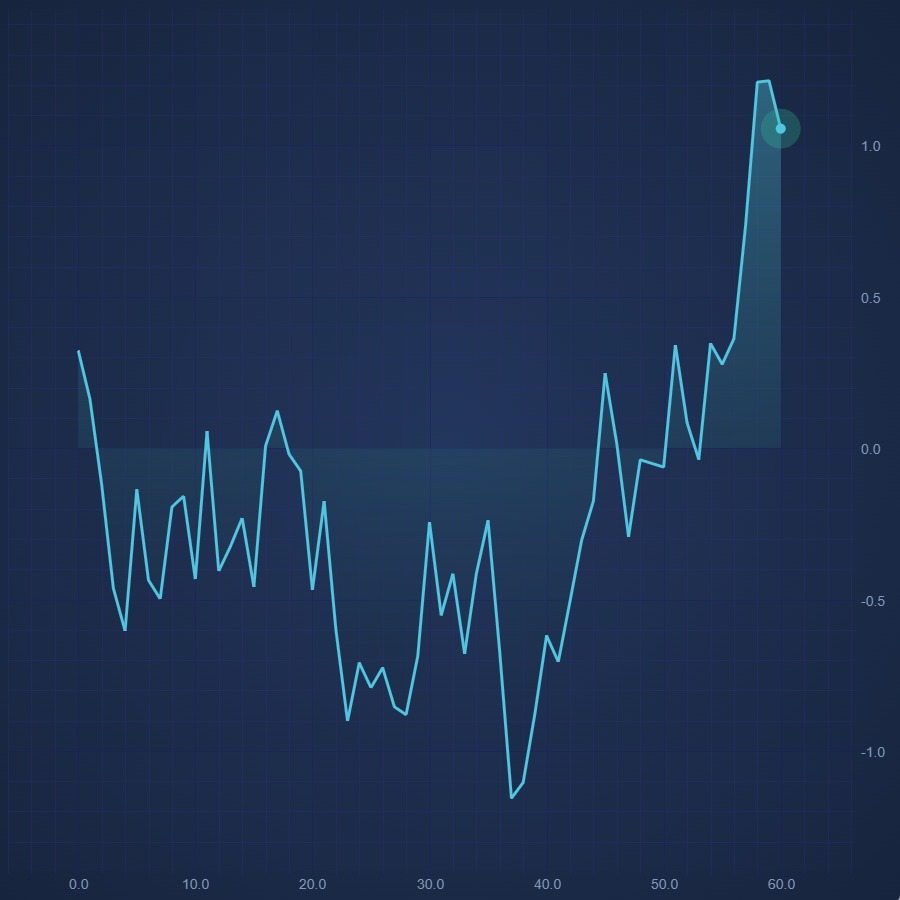
React Realtime Mountain Chart
React Realtime Mountain Chart made easy. Add animated, real-time updates with SciChart.js - high performance JavaScript Charts. Get free trial now.
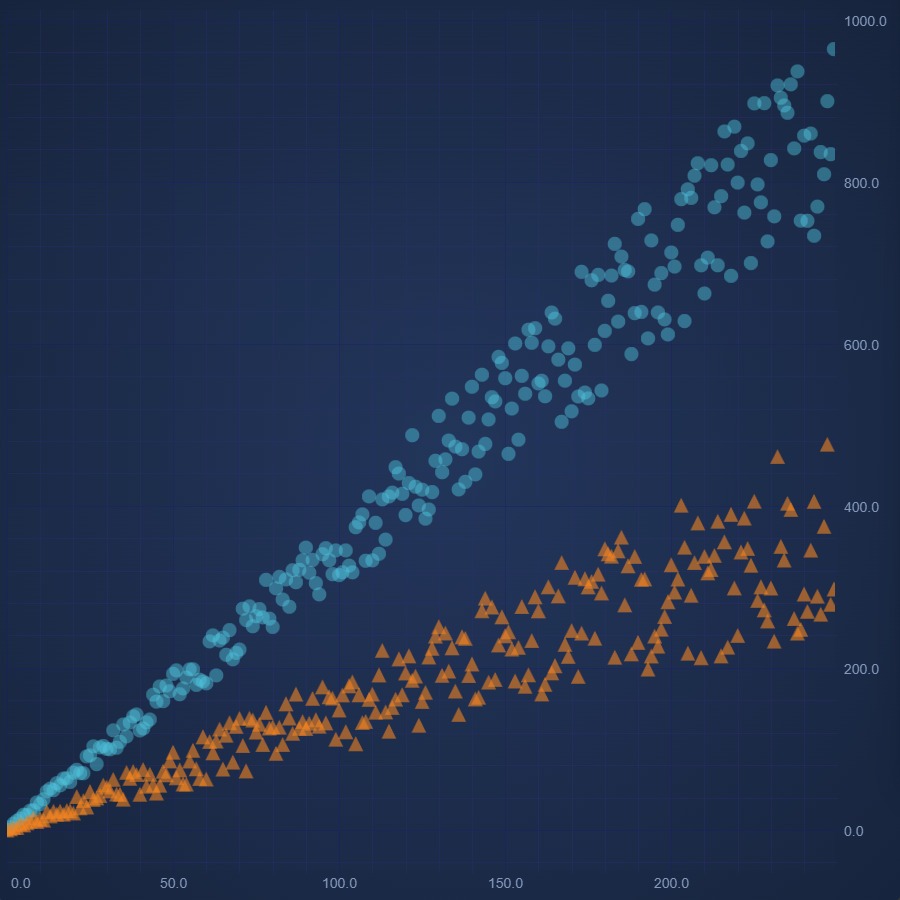
React Scatter Chart
Create React Scatter Chart with high performance SciChart.js. Easily render pre-defined point types. Supports custom shapes. Get your free trial now.
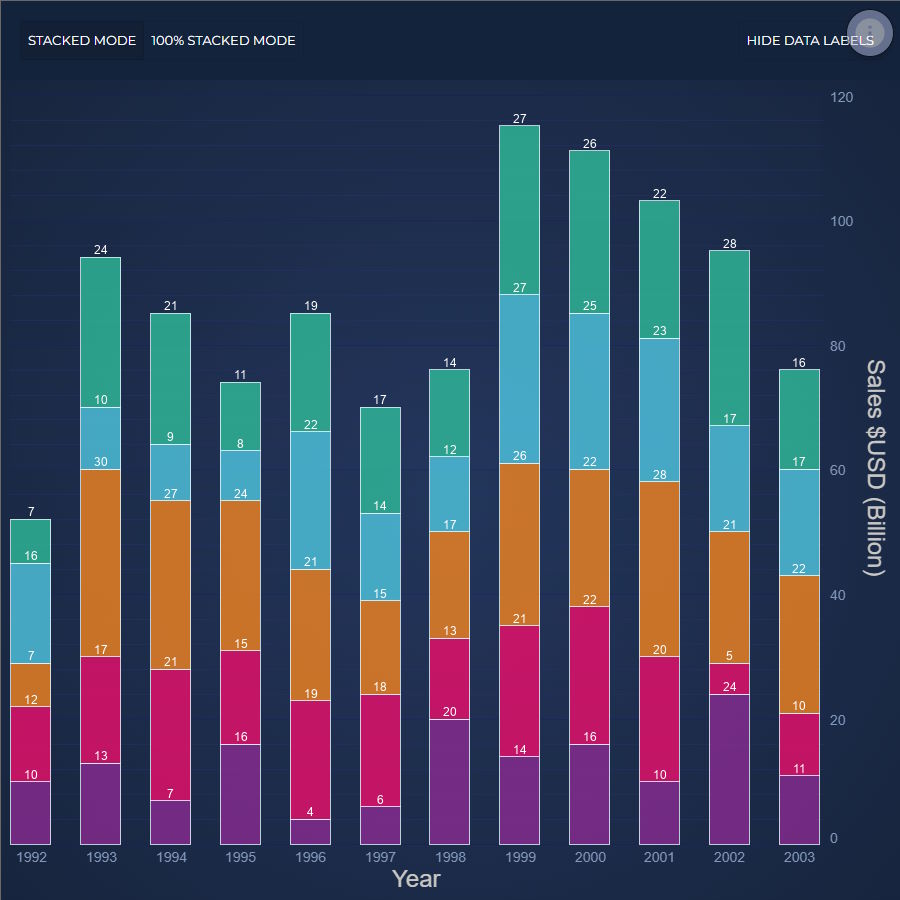
React Stacked Column Chart
Discover how to create a React Stacked Column Chart using our feature-rich JavaScript Chart Library, SciChart.js. Get your free demo today!
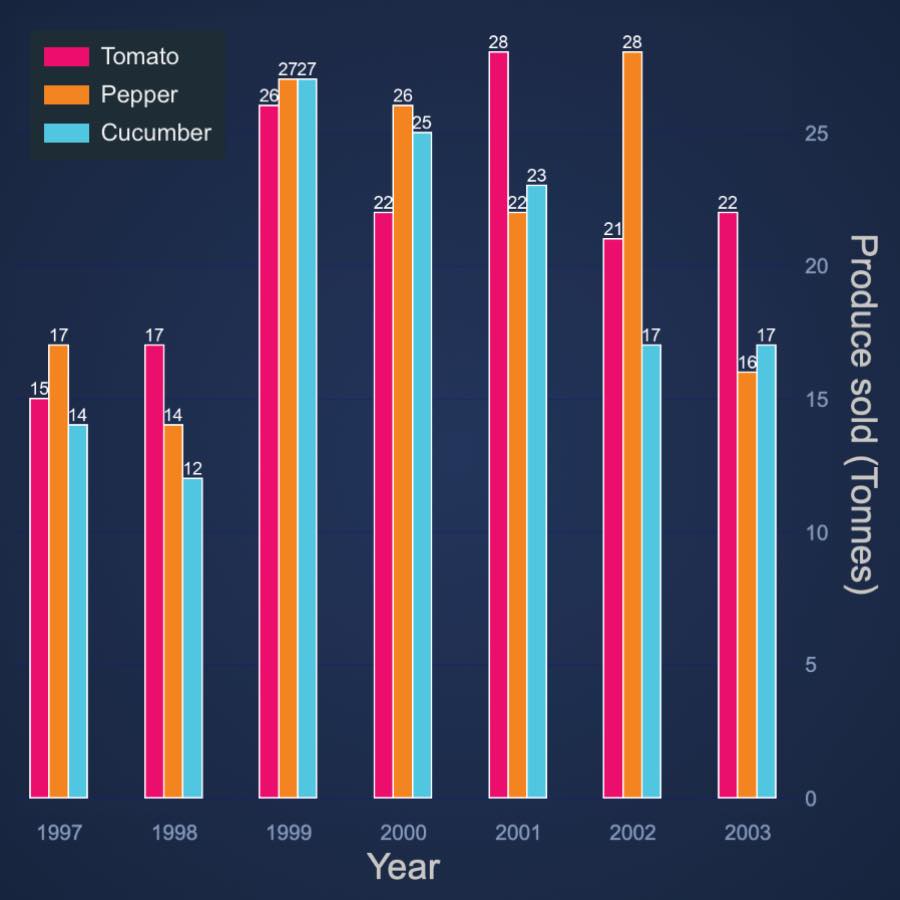
React Stacked Column Side by Side
Design React Stacked Group Column Chart side-by-side using our 5-star rated JavaScript Chart Framework, SciChart.js. Get your free demo now.
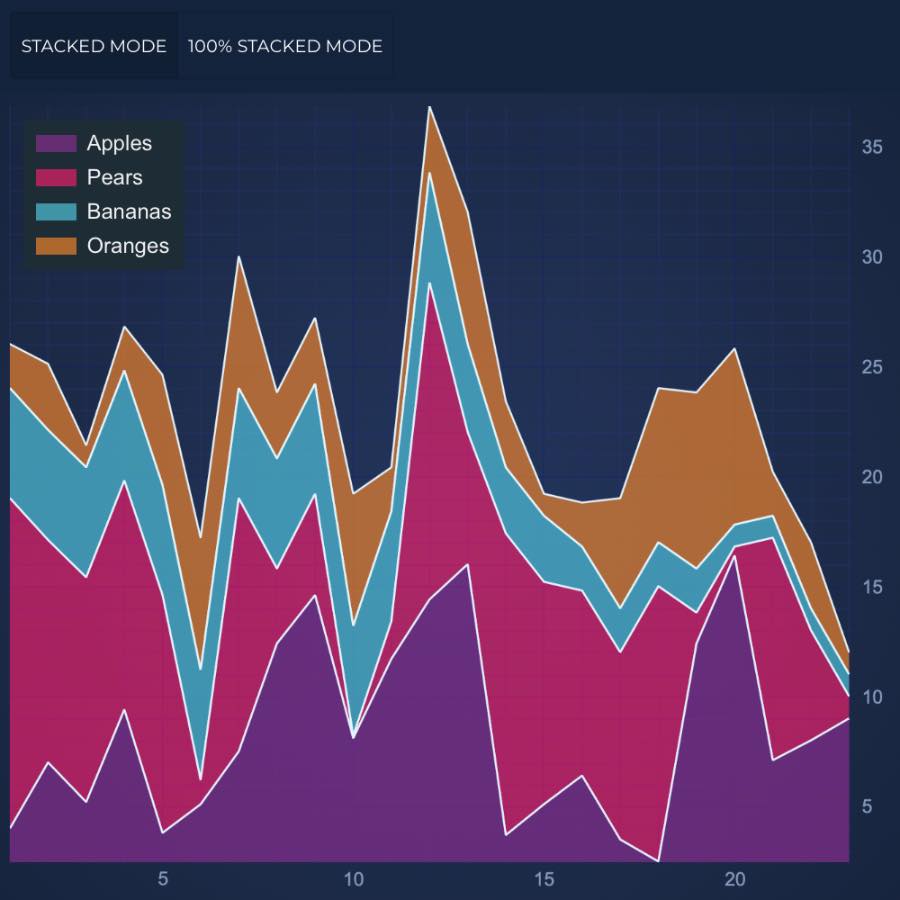
React Stacked Mountain Chart
Design a high performance React Stacked Mountain Chart with SciChart.js - your one-stop JavaScript chart library. Get free demo now to get started.
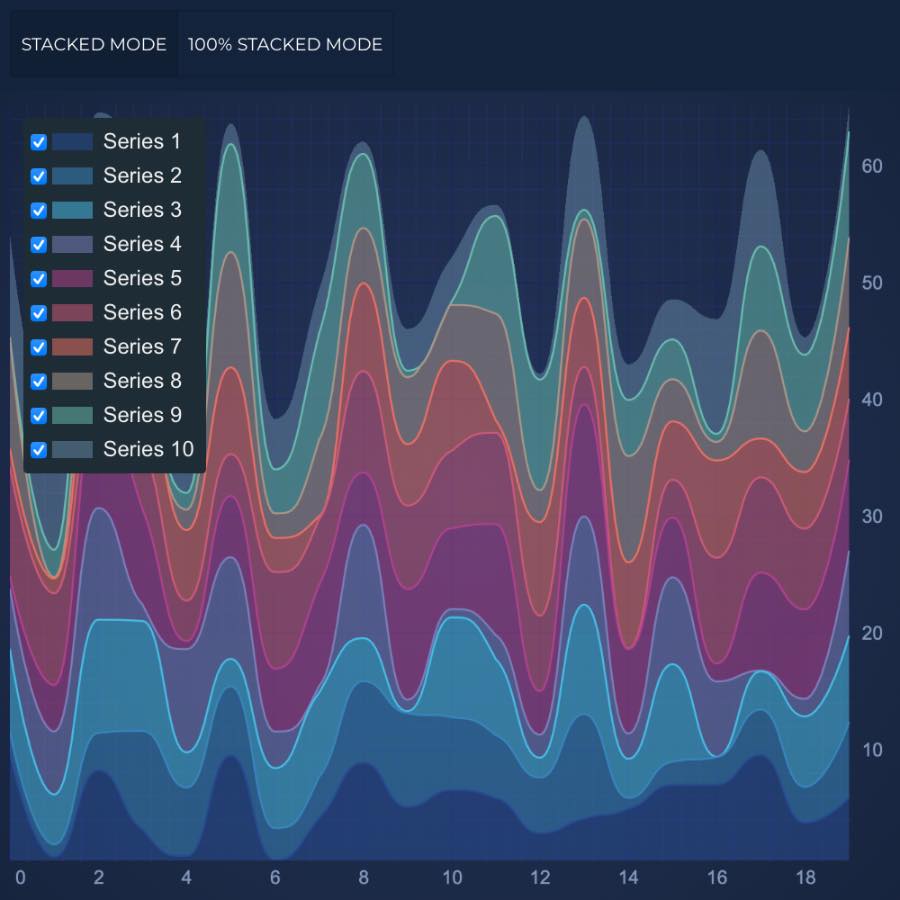
React Smooth Stacked Mountain Chart
Design a high performance React Stacked Mountain Chart with SciChart.js - your one-stop JavaScript chart library. Get free demo now to get started.
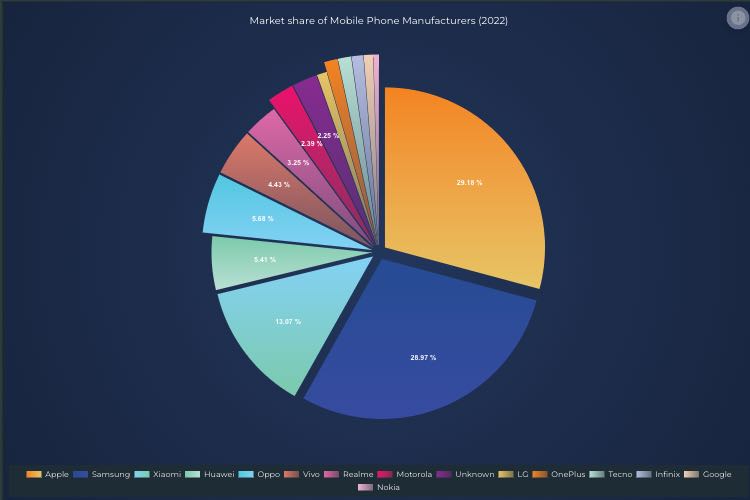
React Pie Chart
Easily create and customise a high performance React Pie Chart with 5-star rated SciChart.js. Get your free trial now to access the whole library.
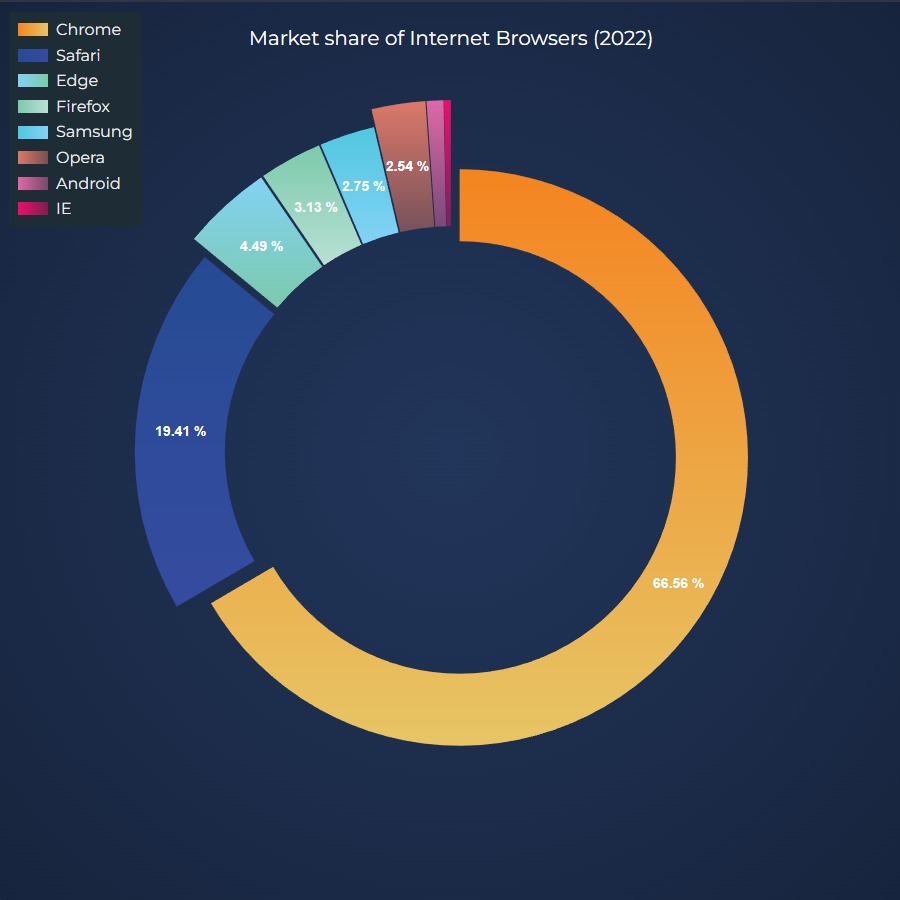
React Donut Chart
Create React Donut Chart with 5-star rated SciChart.js chart library. Supports legends, text labels, animated updates and more. Get free trial now.