React Chart with Central Axes
Demonstrates how to create a React Chart with central axes using SciChart.js, High Performance JavaScript Charts
drawExample.ts
index.tsx
theme.ts
1import { appTheme } from "../../../theme";
2import {
3    CentralAxesLayoutManager,
4    EAnimationType,
5    EAxisAlignment,
6    ECoordinateMode,
7    EHorizontalAnchorPoint,
8    EInnerAxisPlacementCoordinateMode,
9    ELineDrawMode,
10    FastLineRenderableSeries,
11    ICentralAxesLayoutManagerOptions,
12    MouseWheelZoomModifier,
13    NumericAxis,
14    NumberRange,
15    PinchZoomModifier,
16    SciChartSurface,
17    TextAnnotation,
18    TSciChart,
19    XyDataSeries,
20    ZoomExtentsModifier,
21    ZoomPanModifier,
22} from "scichart";
23
24export const drawExample = async (rootElement: string | HTMLDivElement) => {
25    const { sciChartSurface, wasmContext } = await SciChartSurface.create(rootElement, {
26        theme: appTheme.SciChartJsTheme,
27    });
28
29    // Optional parameters to control exact placement of the axis
30    // These are defaults: which fix the axes in the center of the chart
31    // Relative coordinate mode and 0.5 means 'place half way'
32    // const options: ICentralAxesLayoutManagerOptions = {
33    //     horizontalAxisPositionCoordinateMode: EInnerAxisPlacementCoordinateMode.Relative,
34    //     verticalAxisPositionCoordinateMode: EInnerAxisPlacementCoordinateMode.Relative,
35    //     horizontalAxisPosition: 0.5,
36    //     verticalAxisPosition: 0.5
37    // };
38
39    // These options keep the axes crossing at (0,0), so the axes pan with the chart
40    const options: ICentralAxesLayoutManagerOptions = {
41        horizontalAxisPositionCoordinateMode: EInnerAxisPlacementCoordinateMode.DataValue,
42        verticalAxisPositionCoordinateMode: EInnerAxisPlacementCoordinateMode.DataValue,
43        horizontalAxisPosition: 0,
44        verticalAxisPosition: 0,
45    };
46
47    // Control the placement of the axis by specifying CentralAxesLayoutManager
48    // and isInnerAxis property
49    sciChartSurface.layoutManager = new CentralAxesLayoutManager(options);
50
51    // Configure x,y axis with central layout - oscilloscope style
52    sciChartSurface.xAxes.add(
53        new NumericAxis(wasmContext, {
54            visibleRange: new NumberRange(-5, 5),
55            isInnerAxis: true, // required for central axis
56            axisAlignment: EAxisAlignment.Top,
57            labelStyle: {
58                color: appTheme.PaleSkyBlue,
59            },
60            axisBorder: {
61                borderTop: 1,
62                color: appTheme.VividSkyBlue,
63            },
64        })
65    );
66
67    sciChartSurface.yAxes.add(
68        new NumericAxis(wasmContext, {
69            visibleRange: new NumberRange(-5, 5),
70            isInnerAxis: true, // required for central axis
71            axisAlignment: EAxisAlignment.Left,
72            labelStyle: {
73                color: appTheme.PaleSkyBlue,
74            },
75            axisBorder: {
76                borderLeft: 1,
77                color: appTheme.VividSkyBlue,
78            },
79        })
80    );
81
82    // Add a line series
83    sciChartSurface.renderableSeries.add(
84        new FastLineRenderableSeries(wasmContext, {
85            drawNaNAs: ELineDrawMode.PolyLine,
86            dataSeries: getButterflyCurve(wasmContext, 20000),
87            isDigitalLine: false,
88            stroke: appTheme.VividTeal,
89            animation: { type: EAnimationType.Fade, options: { duration: 500 } },
90        })
91    );
92
93    // Add title annotation
94    sciChartSurface.annotations.add(
95        new TextAnnotation({
96            text: "SciChart.js allows axis layout customisation including Central axis",
97            fontSize: 16,
98            textColor: appTheme.ForegroundColor,
99            x1: 0,
100            xCoordShift: 10,
101            y1: 0,
102            yCoordShift: 10,
103            opacity: 0.77,
104            horizontalAnchorPoint: EHorizontalAnchorPoint.Left,
105            xCoordinateMode: ECoordinateMode.Relative,
106            yCoordinateMode: ECoordinateMode.Relative,
107        })
108    );
109
110    // Add some interaction modifiers
111    sciChartSurface.chartModifiers.add(
112        new ZoomPanModifier({ enableZoom: true }),
113        new MouseWheelZoomModifier(),
114        new ZoomExtentsModifier()
115    );
116
117    return { sciChartSurface, wasmContext };
118};
119
120function getButterflyCurve(wasmContext: TSciChart, count: number = 2000) {
121    const temp = 0.01;
122    const dataSeries = new XyDataSeries(wasmContext);
123    for (let i = 0; i < count; i++) {
124        const t = i * temp;
125
126        const multiplier = Math.pow(Math.E, Math.cos(t)) - 2 * Math.cos(4 * t) - Math.pow(Math.sin(t / 12), 5);
127
128        const x = Math.sin(t) * multiplier;
129        const y = Math.cos(t) * multiplier;
130        dataSeries.append(x, y);
131    }
132    return dataSeries;
133}
134
See Also: Chart Axis APIs (9 Demos)
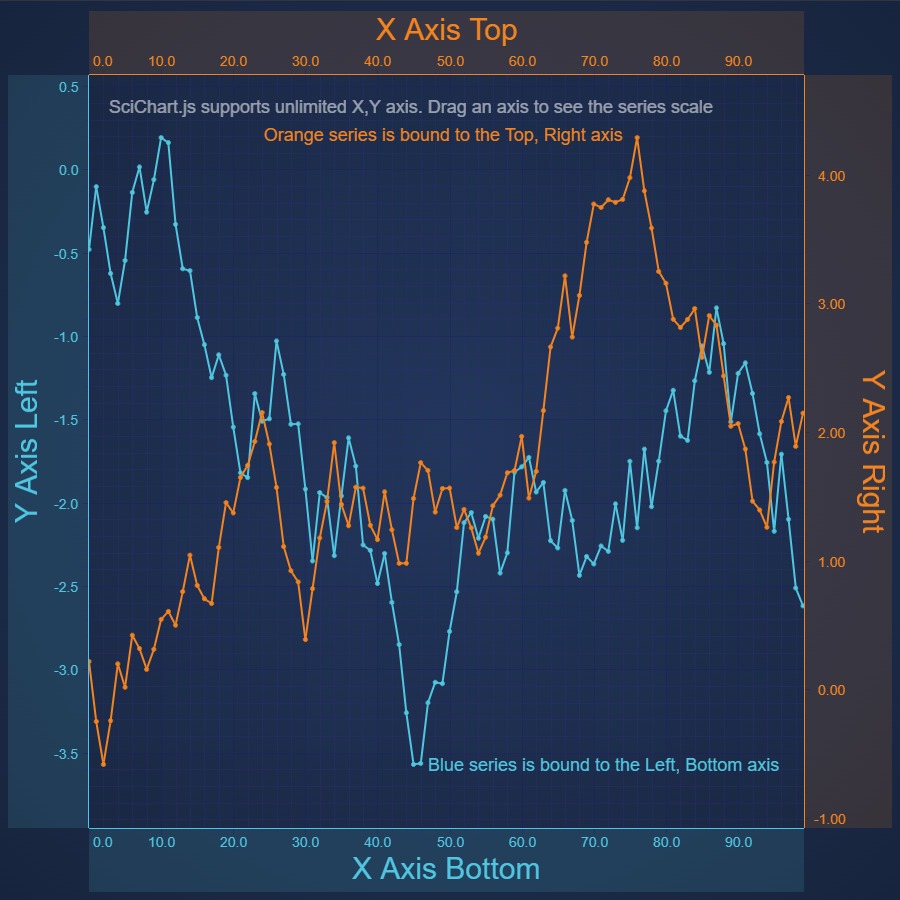
React Chart with Multiple X Axes
Demonstrates Multiple X & Y Axis on a React Chart using SciChart.js. SciChart supports unlimited left, right, top, bottom X, Y axis with configurable alignment and individual zooming, panning
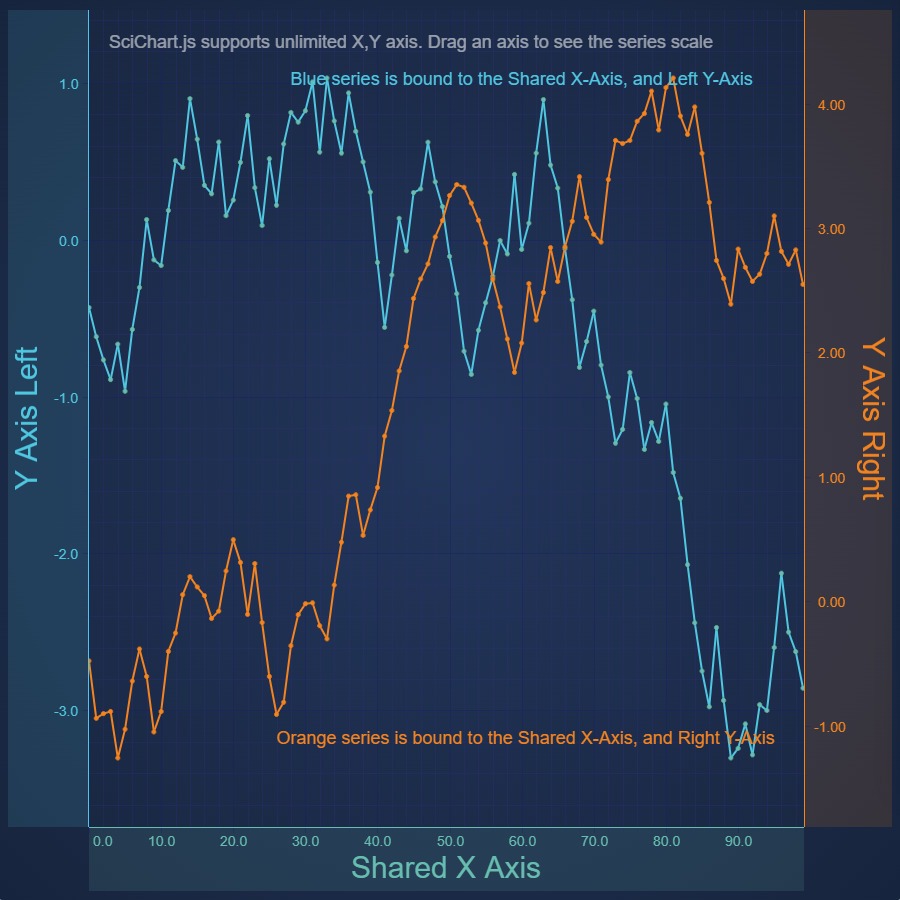
React Chart with Secondary Y Axes
Demonstrates Secondary Y Axis on a React Chart using SciChart.js. SciChart supports unlimited, multiple left, right, top, bottom X, Y axis with configurable alignment and individual zooming, panning
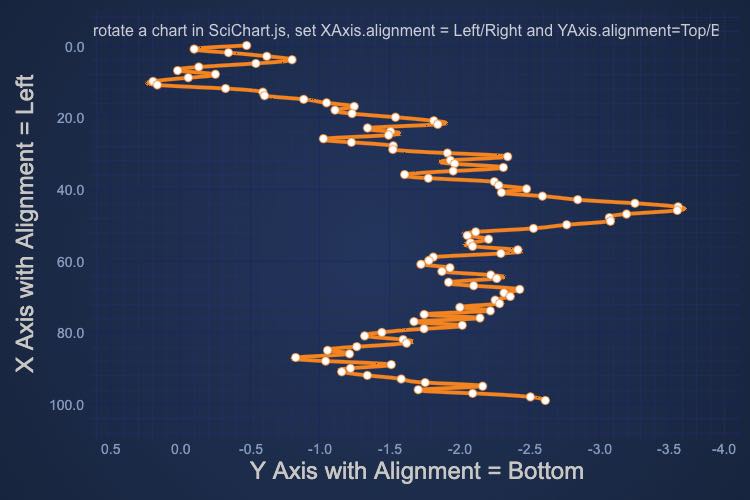
React Vertical Charts
Demonstrates alignment of Axis to create a vertical chart with SciChart.js - JavaScript Charts.
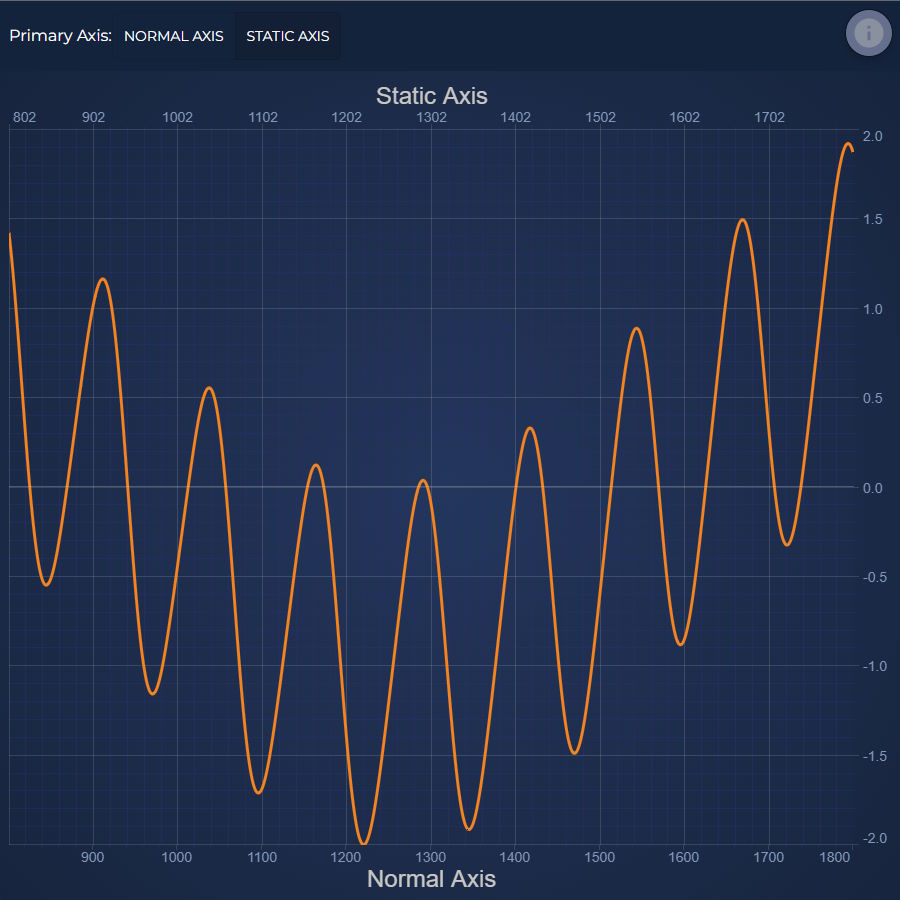
React Chart with Static X Axis
Demonstrates isStaticAxis on a React Chart using SciChart.js.
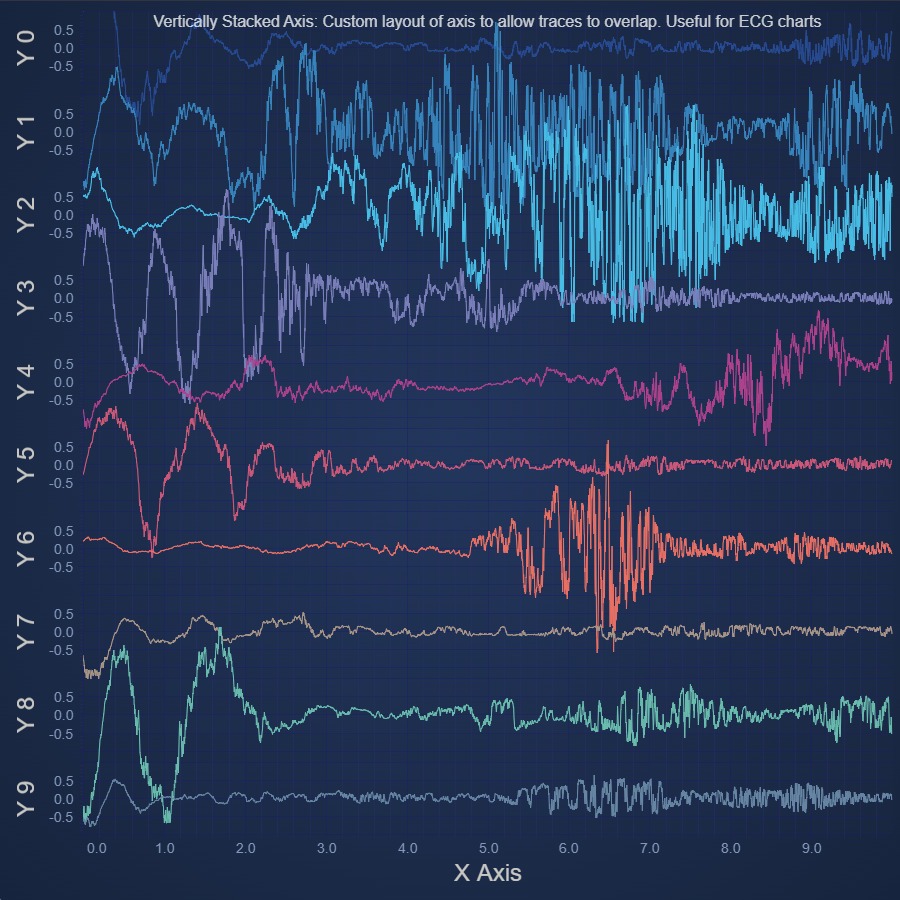
React Chart with Vertically Stacked Axes
Demonstrates Vertically Stacked Axes on a React Chart using SciChart.js, allowing data to overlap
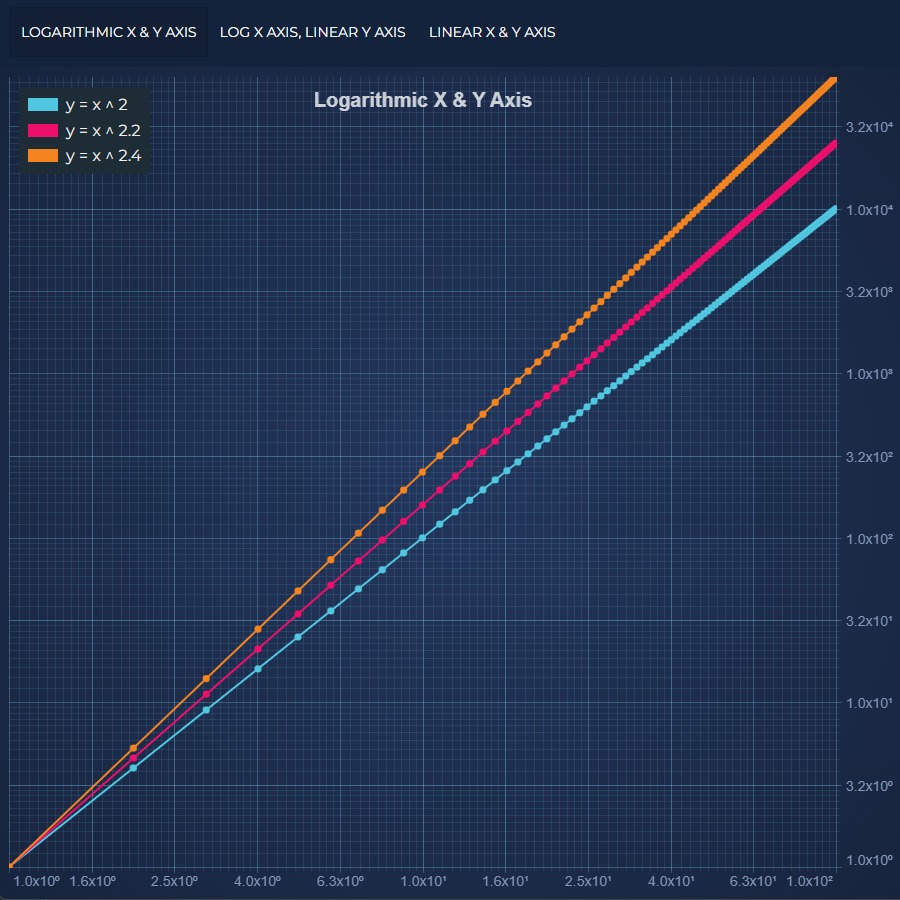
React Chart with Logarithmic Axis Example
Demonstrates Logarithmic Axis on a React Chart using SciChart.js. SciChart supports logarithmic axis with scientific or engineering notation and positive and negative values
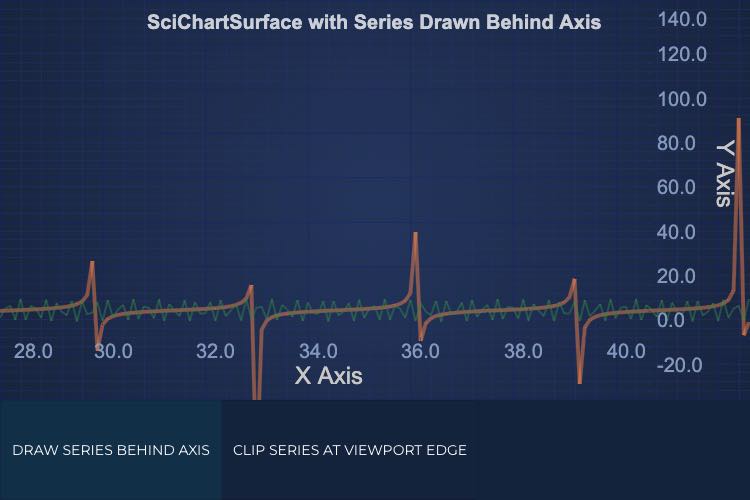
Draw React Chart Behind Axis
Demonstrates the option of the transparent Axes customization on a React Chart using SciChart.js.
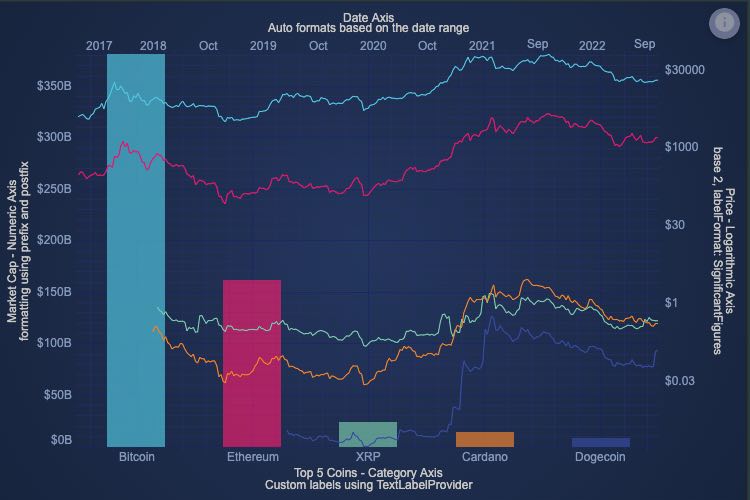
Axis Types
Demonstrates how to use arbitrary text for axis labels, rather than formatted data values, using the new TextLabelProvider
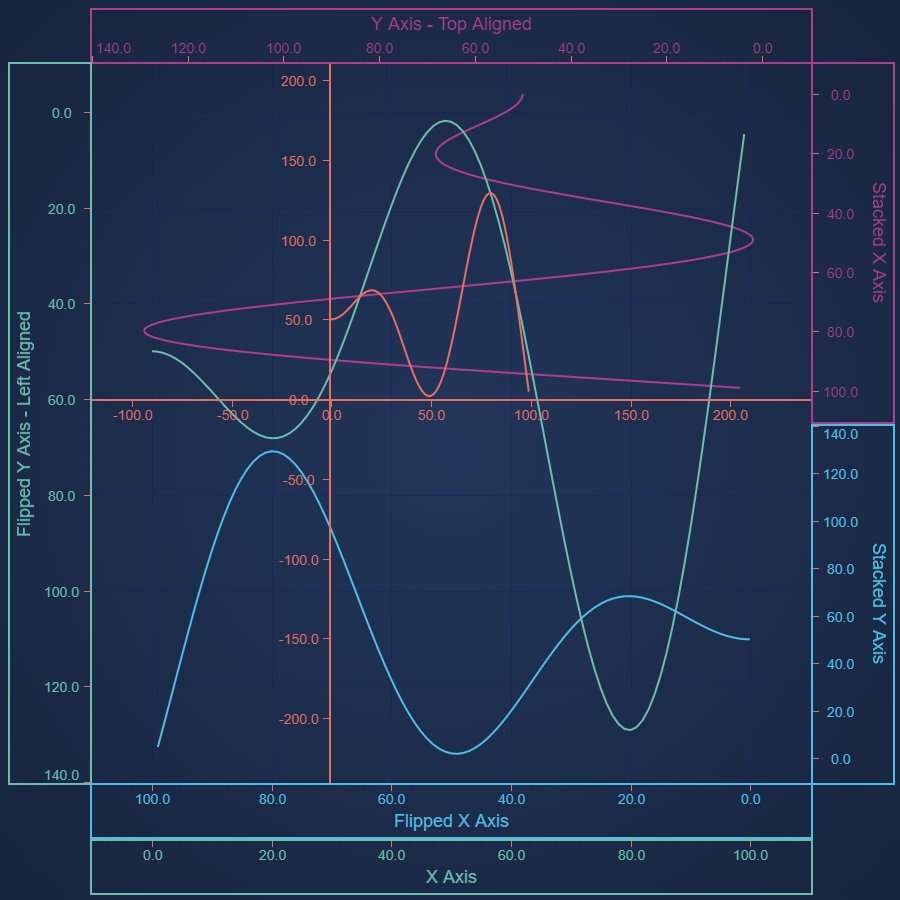
React Chart Axis Layout Options
Demonstrates outer, inner, central and stacked axes, and use of axis alignment to create vertical charts