Axis Types
Demonstrates the Numeric, Category, Date and Logarithmic axis types available SciChart.js, High Performance JavaScript Charts
drawExample.ts
index.tsx
TBinanceCandleData.ts
theme.ts
1import {
2    CategoryAxis,
3    DateTimeNumericAxis,
4    EFillPaletteMode,
5    EStrokePaletteMode,
6    EAutoRange,
7    EAxisAlignment,
8    ELabelAlignment,
9    ENumericFormat,
10    FastColumnRenderableSeries,
11    FastLineRenderableSeries,
12    IFillPaletteProvider,
13    IStrokePaletteProvider,
14    IPointMetadata,
15    IRenderableSeries,
16    LogarithmicAxis,
17    MouseWheelZoomModifier,
18    NumericAxis,
19    NumberRange,
20    parseColorToUIntArgb,
21    SciChartSurface,
22    TextLabelProvider,
23    Thickness,
24    XyDataSeries,
25    ZoomExtentsModifier,
26    ZoomPanModifier,
27} from "scichart";
28
29import { appTheme } from "../../../theme";
30import { TBinanceCandleData } from "../../../TBinanceCandleData";
31
32const colorStrings = [
33    appTheme.VividSkyBlue,
34    appTheme.VividPink,
35    appTheme.MutedTeal,
36    appTheme.VividOrange,
37    appTheme.VividBlue,
38];
39const colors = colorStrings.map((c) => parseColorToUIntArgb(c + "AA"));
40
41export const drawExample = async (rootElement: string | HTMLDivElement) => {
42    // Create a SciChartSurface with Theme
43    const { sciChartSurface, wasmContext } = await SciChartSurface.create(rootElement, {
44        theme: appTheme.SciChartJsTheme,
45    });
46    const labelProvider = new TextLabelProvider({
47        labels: ["Bitcoin", "Ethereum", "XRP", "Cardano", "Dogecoin"],
48    });
49    // Category Axis - measures using index not value.
50    const xAxis = new CategoryAxis(wasmContext, { id: "XCategory", labelProvider });
51
52    xAxis.labelStyle.fontSize = 18;
53    xAxis.labelStyle.alignment = ELabelAlignment.Center;
54    xAxis.labelStyle.padding = new Thickness(2, 1, 2, 1);
55    // Allow rotated labels to overlap
56    xAxis.axisRenderer.hideOverlappingLabels = false;
57    // Keep first and last labels aligned to their ticks
58    xAxis.axisRenderer.keepLabelsWithinAxis = false;
59    xAxis.axisTitle = ["Top 5 Coins - Category Axis", "Custom labels using TextLabelProvider"];
60    xAxis.axisTitleStyle.fontSize = 14;
61
62    sciChartSurface.xAxes.add(xAxis);
63
64    // Numeric Y-Axis. measures using value
65    const yAxis = new NumericAxis(wasmContext, {
66        id: "YNumeric",
67        autoRange: EAutoRange.Always,
68        labelPrefix: "$",
69        labelPostfix: "B",
70        labelPrecision: 0,
71        axisAlignment: EAxisAlignment.Left,
72        labelStyle: { fontSize: 14 },
73    });
74    // Pass array to axisTitle to make it multiline
75    yAxis.axisTitle = ["Market Cap - Numeric Axis", "formatting using prefix and postfix"];
76    yAxis.axisTitleStyle.fontSize = 14;
77
78    sciChartSurface.yAxes.add(yAxis);
79
80    const columnSeries = new FastColumnRenderableSeries(wasmContext, {
81        strokeThickness: 0,
82        dataPointWidth: 0.5,
83        paletteProvider: new AxisTypesPaletteProvider(),
84        xAxisId: xAxis.id,
85        yAxisId: yAxis.id,
86    });
87    sciChartSurface.renderableSeries.add(columnSeries);
88
89    const dataSeries = new XyDataSeries(wasmContext);
90    dataSeries.appendRange([0, 1, 2, 3, 4], [380.9, 162.1, 23.87, 14.56, 8.372]);
91    columnSeries.dataSeries = dataSeries;
92    const endDate = new Date(2022, 10, 5);
93    const startTime = endDate.getTime() / 1000 - 500 * 7 * 24 * 60 * 60;
94    const dateXAxis = new DateTimeNumericAxis(wasmContext, {
95        axisAlignment: EAxisAlignment.Top,
96        id: "XDate",
97        labelStyle: { fontSize: 18 },
98        axisTitle: ["Date Axis", "Auto formats based on the date range"],
99        axisTitleStyle: { fontSize: 18 },
100        visibleRangeLimit: new NumberRange(startTime, endDate.getTime() / 1000),
101    });
102    sciChartSurface.xAxes.add(dateXAxis);
103
104    // Logarithmic Y Axis - measures on log scale using value
105    const logYAxis = new LogarithmicAxis(wasmContext, {
106        id: "YLog",
107        logBase: 2,
108        labelFormat: ENumericFormat.SignificantFigures,
109        labelPrefix: "$",
110        axisAlignment: EAxisAlignment.Right,
111        labelStyle: { fontSize: 14 },
112        axisTitle: ["Price - Logarithmic Axis", "base 2, labelFormat: SignificantFigures"],
113        axisTitleStyle: { fontSize: 14 },
114    });
115    sciChartSurface.yAxes.add(logYAxis);
116
117    const symbols = ["BTCUSDT", "ETHUSDT", "XRPUSDT", "ADAUSDT", "DOGEUSDT"];
118    for (let index = 0; index < symbols.length; index++) {
119        const symbol = symbols[index];
120        const priceDataSeries = new XyDataSeries(wasmContext, { dataSeriesName: symbol });
121        const series = new FastLineRenderableSeries(wasmContext, {
122            id: symbol,
123            strokeThickness: 3,
124            xAxisId: dateXAxis.id,
125            yAxisId: logYAxis.id,
126            stroke: colorStrings[index],
127            dataSeries: priceDataSeries,
128        });
129        sciChartSurface.renderableSeries.add(series);
130
131        (async () => {
132            const response = await fetch(
133                `/api/get-binance-candles?interval=1w&symbol=${symbol}&limit=500&endTime=${endDate}`
134            );
135            const data: TBinanceCandleData = await response.json();
136            priceDataSeries.appendRange(data.xValues, data.closeValues);
137            sciChartSurface.zoomExtents();
138        })();
139    }
140
141    sciChartSurface.chartModifiers.add(
142        new ZoomPanModifier({ includedXAxisIds: [dateXAxis.id], includedYAxisIds: [logYAxis.id] }),
143        new MouseWheelZoomModifier({ includedXAxisIds: [dateXAxis.id], includedYAxisIds: [logYAxis.id] }),
144        new ZoomExtentsModifier()
145    );
146
147    return { sciChartSurface, wasmContext };
148};
149
150class AxisTypesPaletteProvider implements IStrokePaletteProvider, IFillPaletteProvider {
151    public readonly strokePaletteMode = EStrokePaletteMode.SOLID;
152    public readonly fillPaletteMode = EFillPaletteMode.SOLID;
153
154    // tslint:disable-next-line:no-empty
155    public onAttached(parentSeries: IRenderableSeries): void {}
156
157    // tslint:disable-next-line:no-empty
158    public onDetached(): void {}
159
160    public overrideFillArgb(xValue: number, yValue: number, index: number): number {
161        return colors[xValue];
162    }
163
164    public overrideStrokeArgb(
165        xValue: number,
166        yValue: number,
167        index: number,
168        opacity?: number,
169        metadata?: IPointMetadata
170    ): number {
171        return undefined;
172    }
173}
174
See Also: Chart Axis APIs (9 Demos)
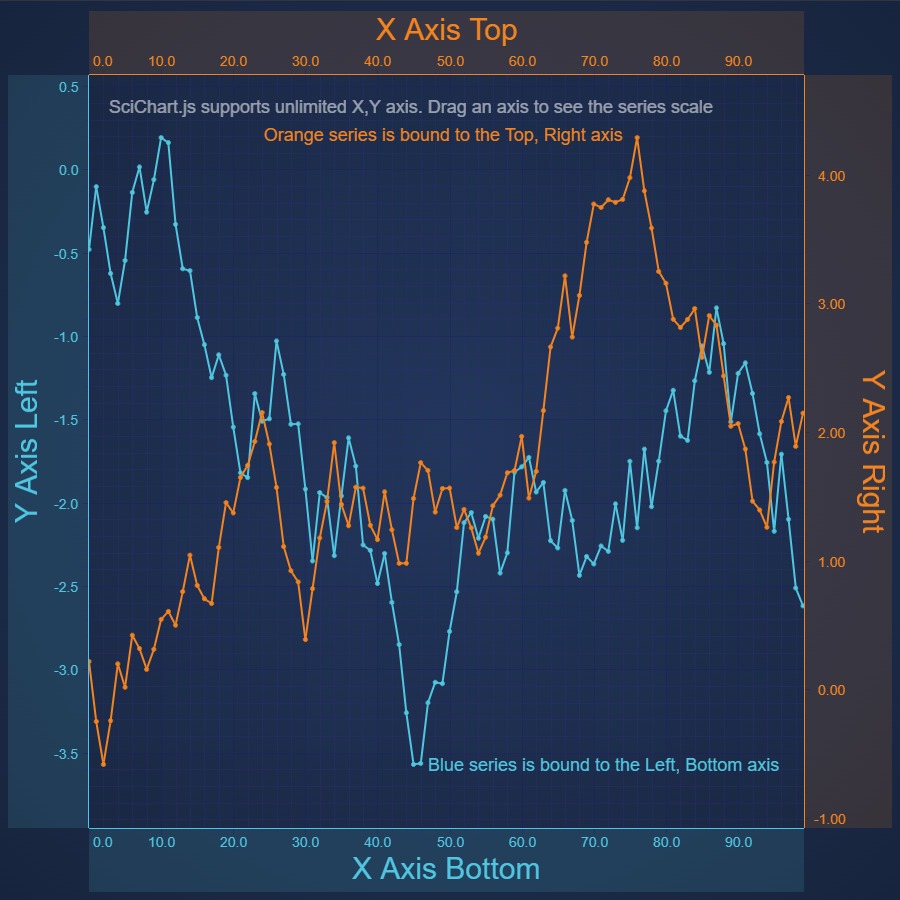
React Chart with Multiple X Axes
Demonstrates Multiple X & Y Axis on a React Chart using SciChart.js. SciChart supports unlimited left, right, top, bottom X, Y axis with configurable alignment and individual zooming, panning
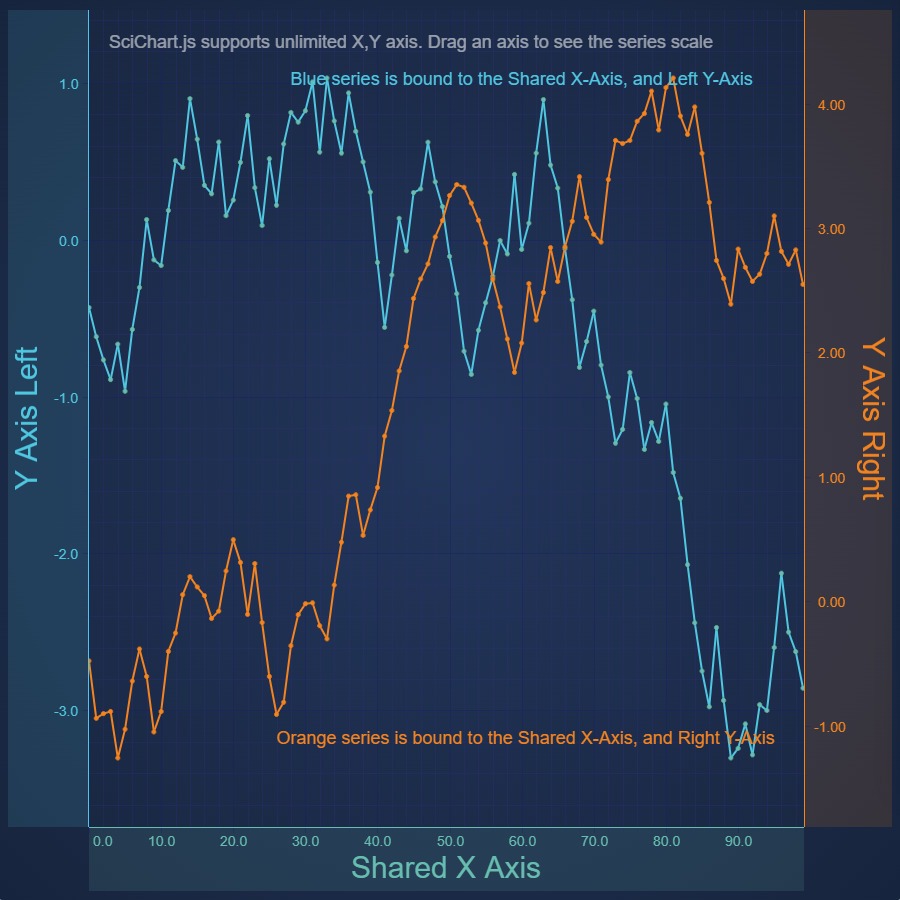
React Chart with Secondary Y Axes
Demonstrates Secondary Y Axis on a React Chart using SciChart.js. SciChart supports unlimited, multiple left, right, top, bottom X, Y axis with configurable alignment and individual zooming, panning
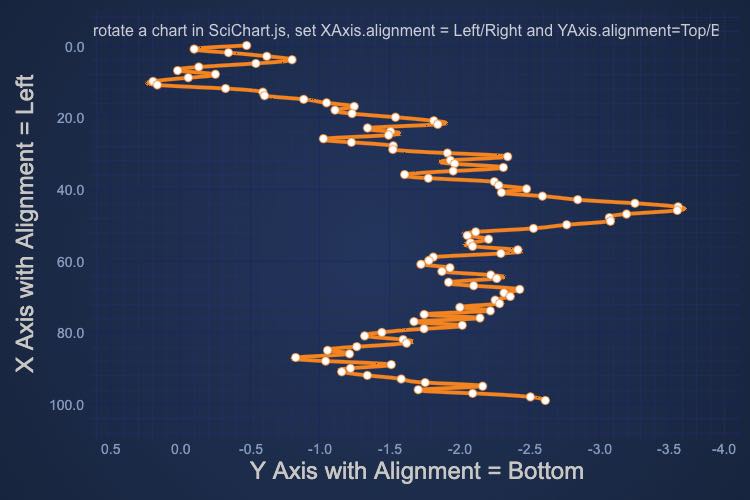
React Vertical Charts
Demonstrates alignment of Axis to create a vertical chart with SciChart.js - JavaScript Charts.

React Chart with Central Axes
Demonstrates Central Axes on a React Chart using SciChart.js. SciChart supports unlimited left, right, top, bottom X, Y axis with configurable layout
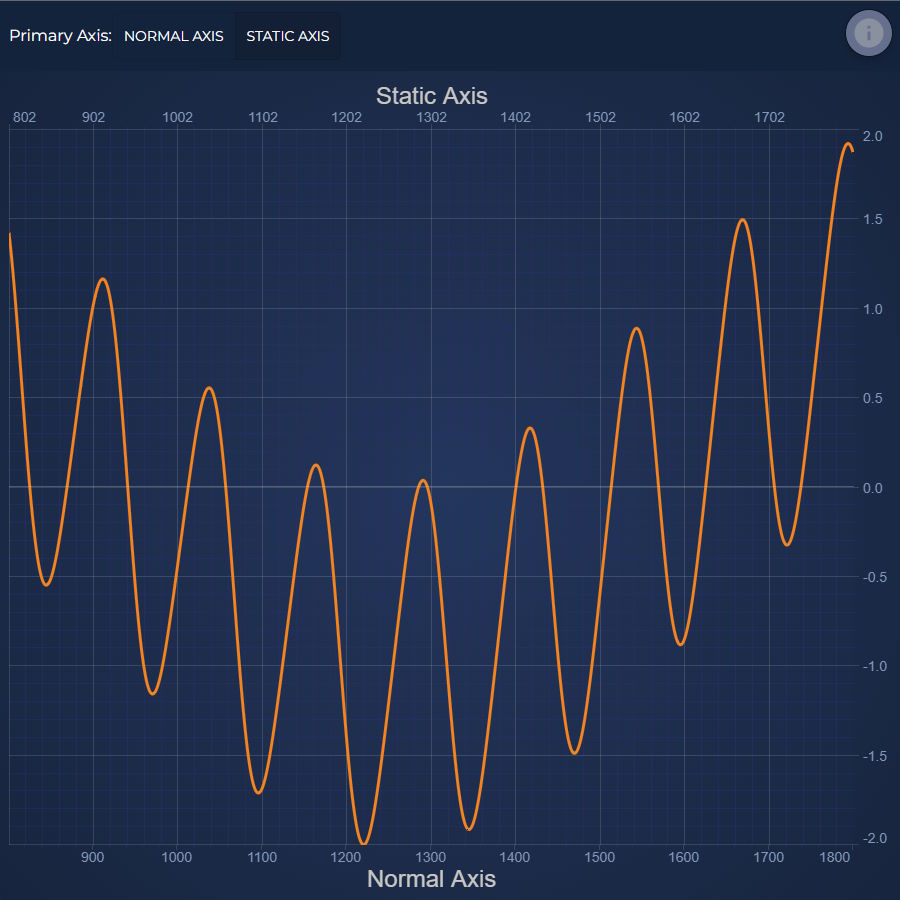
React Chart with Static X Axis
Demonstrates isStaticAxis on a React Chart using SciChart.js.
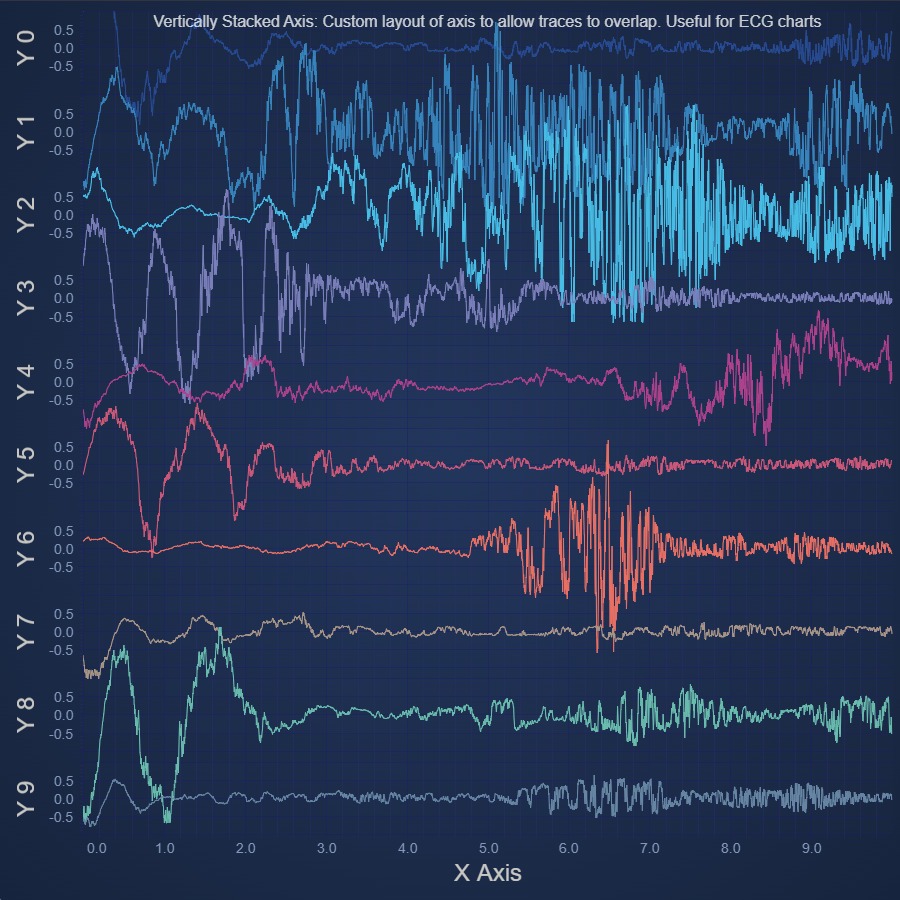
React Chart with Vertically Stacked Axes
Demonstrates Vertically Stacked Axes on a React Chart using SciChart.js, allowing data to overlap
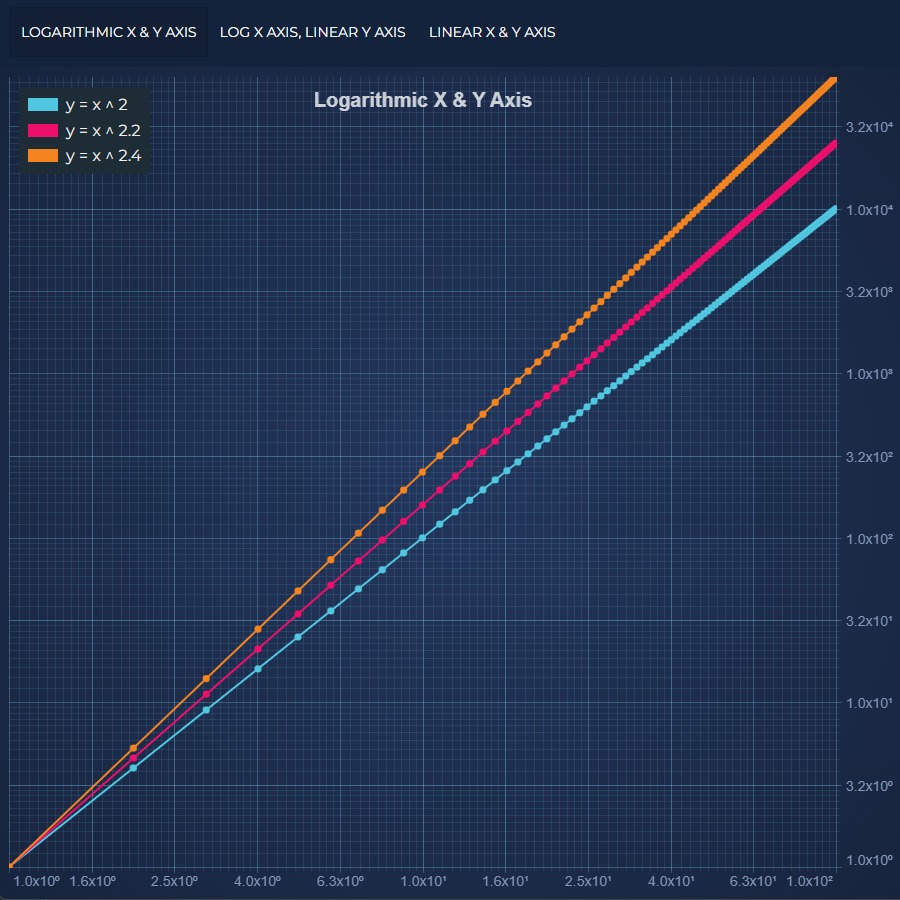
React Chart with Logarithmic Axis Example
Demonstrates Logarithmic Axis on a React Chart using SciChart.js. SciChart supports logarithmic axis with scientific or engineering notation and positive and negative values
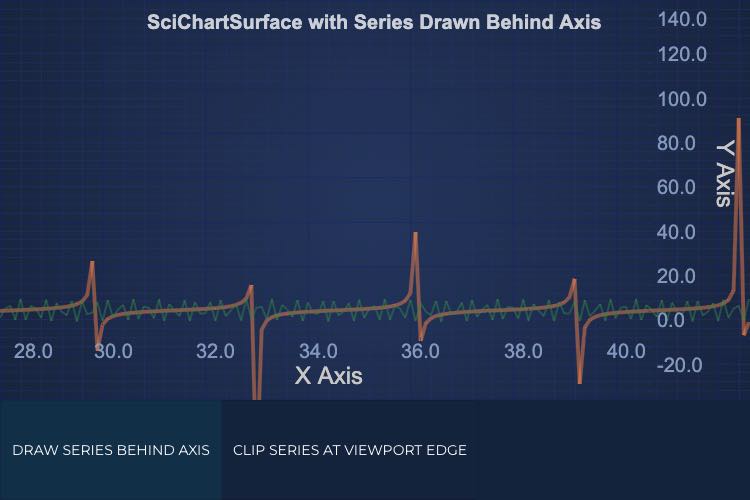
Draw React Chart Behind Axis
Demonstrates the option of the transparent Axes customization on a React Chart using SciChart.js.
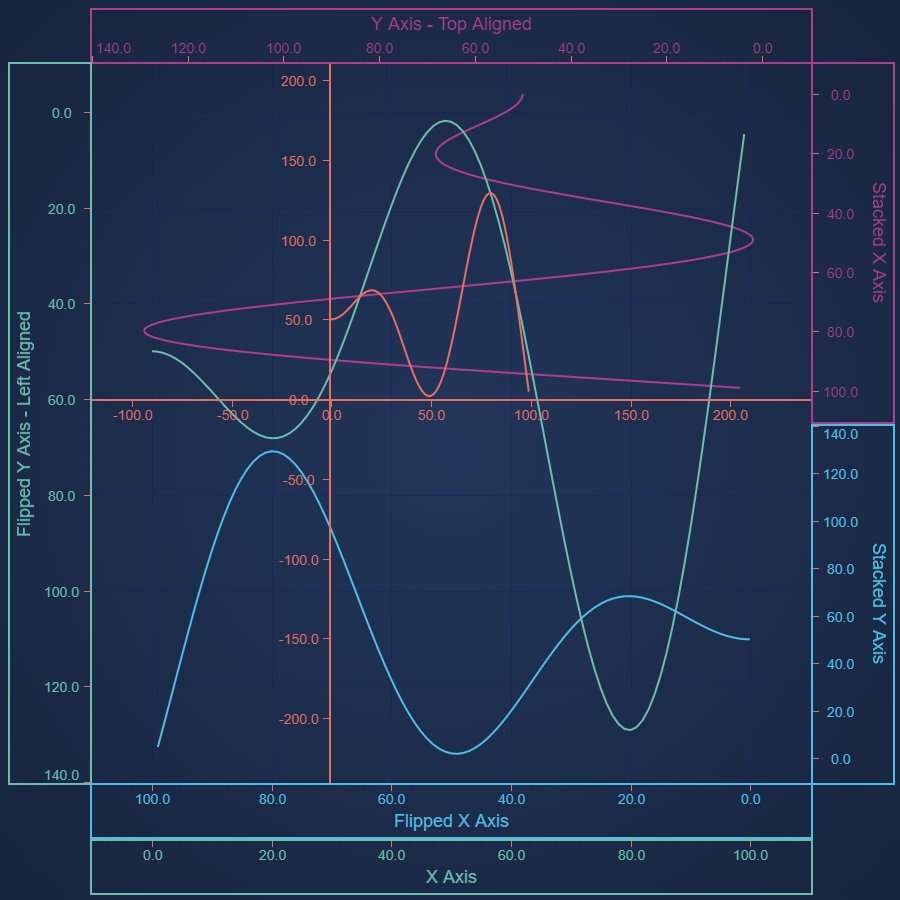
React Chart Axis Layout Options
Demonstrates outer, inner, central and stacked axes, and use of axis alignment to create vertical charts