JavaScript Vertical Charts
Demonstrates how to create a rotated JavaScript Chart with vertical X-Axis using SciChart.js, High Performance JavaScript Charts
drawExample.ts
index.html
vanilla.ts
RandomWalkGenerator.ts
theme.ts
1import {
2    EAxisAlignment,
3    ECoordinateMode,
4    EHorizontalAnchorPoint,
5    EllipsePointMarker,
6    EMultiLineAlignment,
7    EVerticalAnchorPoint,
8    EWrapTo,
9    FastLineRenderableSeries,
10    MouseWheelZoomModifier,
11    NativeTextAnnotation,
12    NumberRange,
13    NumericAxis,
14    SciChartSurface,
15    XyDataSeries,
16    ZoomExtentsModifier,
17    ZoomPanModifier,
18} from "scichart";
19import { appTheme } from "../../../theme";
20import { RandomWalkGenerator } from "../../../ExampleData/RandomWalkGenerator";
21
22export const drawExample = async (rootElement: string | HTMLDivElement) => {
23    const { wasmContext, sciChartSurface } = await SciChartSurface.create(rootElement, {
24        theme: appTheme.SciChartJsTheme,
25    });
26
27    // Setting an XAxis on the Left or Right
28    // and YAxis on the Top or Bottom
29    // causes the chart and series to be rotated vertically
30    sciChartSurface.xAxes.add(
31        new NumericAxis(wasmContext, {
32            axisTitle: "X Axis with Alignment = Left",
33            axisAlignment: EAxisAlignment.Left,
34            growBy: new NumberRange(0.15, 0.05),
35        })
36    );
37
38    sciChartSurface.yAxes.add(
39        new NumericAxis(wasmContext, {
40            axisTitle: "Y Axis with Alignment = Bottom",
41            axisAlignment: EAxisAlignment.Bottom,
42            growBy: new NumberRange(0.1, 0.1),
43        })
44    );
45
46    // Generate some data. xValues/yValues are just arrays of numbers
47    const generator = new RandomWalkGenerator().Seed(1337).getRandomWalkSeries(100);
48    const xValues = generator.xValues;
49    const yValues = generator.yValues;
50
51    // Add a line series to the chart. This will be drawn vertically.
52    sciChartSurface.renderableSeries.add(
53        new FastLineRenderableSeries(wasmContext, {
54            dataSeries: new XyDataSeries(wasmContext, { xValues, yValues }),
55            pointMarker: new EllipsePointMarker(wasmContext, {
56                width: 9,
57                height: 9,
58                fill: appTheme.ForegroundColor,
59                stroke: appTheme.VividOrange,
60            }),
61            strokeThickness: 5,
62            stroke: appTheme.VividOrange,
63        })
64    );
65
66    // Add title / instructions
67    sciChartSurface.annotations.add(
68        new NativeTextAnnotation({
69            x1: 0.02,
70            y1: 0.02,
71            xCoordinateMode: ECoordinateMode.Relative,
72            yCoordinateMode: ECoordinateMode.Relative,
73            horizontalAnchorPoint: EHorizontalAnchorPoint.Left,
74            verticalAnchorPoint: EVerticalAnchorPoint.Top,
75            fontSize: 16,
76            opacity: 0.77,
77            textColor: appTheme.ForegroundColor,
78            text: "To rotate a chart in SciChart.js, set XAxis.alignment = Left/Right and YAxis.alignment=Top/Bottom",
79            wrapTo: EWrapTo.ViewRect,
80            multiLineAlignment: EMultiLineAlignment.Left,
81        })
82    );
83
84    // Add some interactivity modifiers
85    sciChartSurface.chartModifiers.add(new ZoomPanModifier({ enableZoom: true }));
86    sciChartSurface.chartModifiers.add(new ZoomExtentsModifier());
87    sciChartSurface.chartModifiers.add(new MouseWheelZoomModifier());
88
89    sciChartSurface.zoomExtents();
90
91    return { wasmContext, sciChartSurface };
92};
93
See Also: Chart Axis APIs (9 Demos)
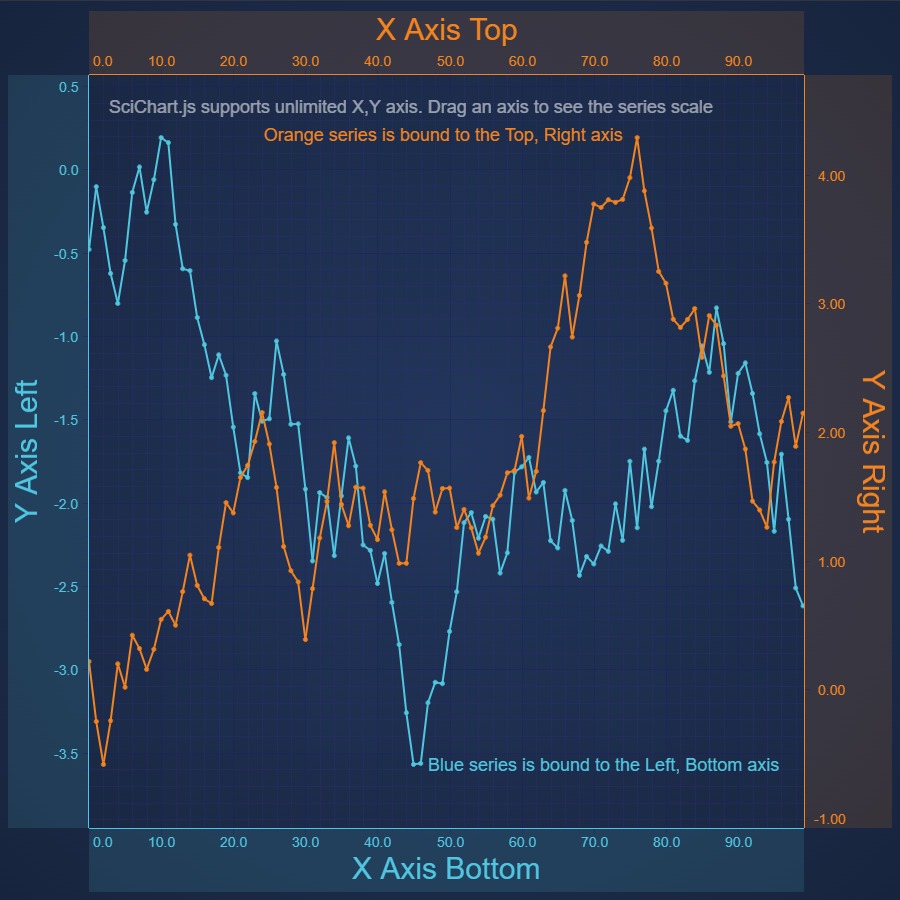
JavaScript Chart with Multiple X Axes
Demonstrates Multiple X & Y Axis on a JavaScript Chart using SciChart.js. SciChart supports unlimited left, right, top, bottom X, Y axis with configurable alignment and individual zooming, panning
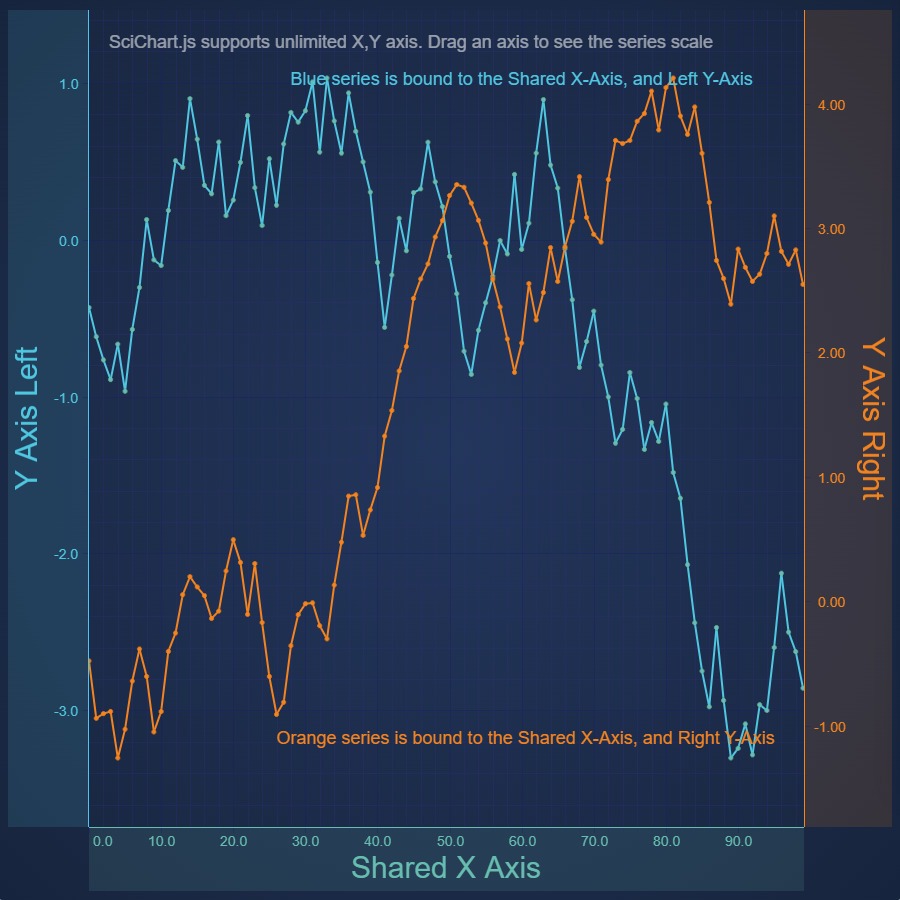
JavaScript Chart with Secondary Y Axes
Demonstrates Secondary Y Axis on a JavaScript Chart using SciChart.js. SciChart supports unlimited, multiple left, right, top, bottom X, Y axis with configurable alignment and individual zooming, panning

JavaScript Chart with Central Axes
Demonstrates Central Axes on a JavaScript Chart using SciChart.js. SciChart supports unlimited left, right, top, bottom X, Y axis with configurable layout
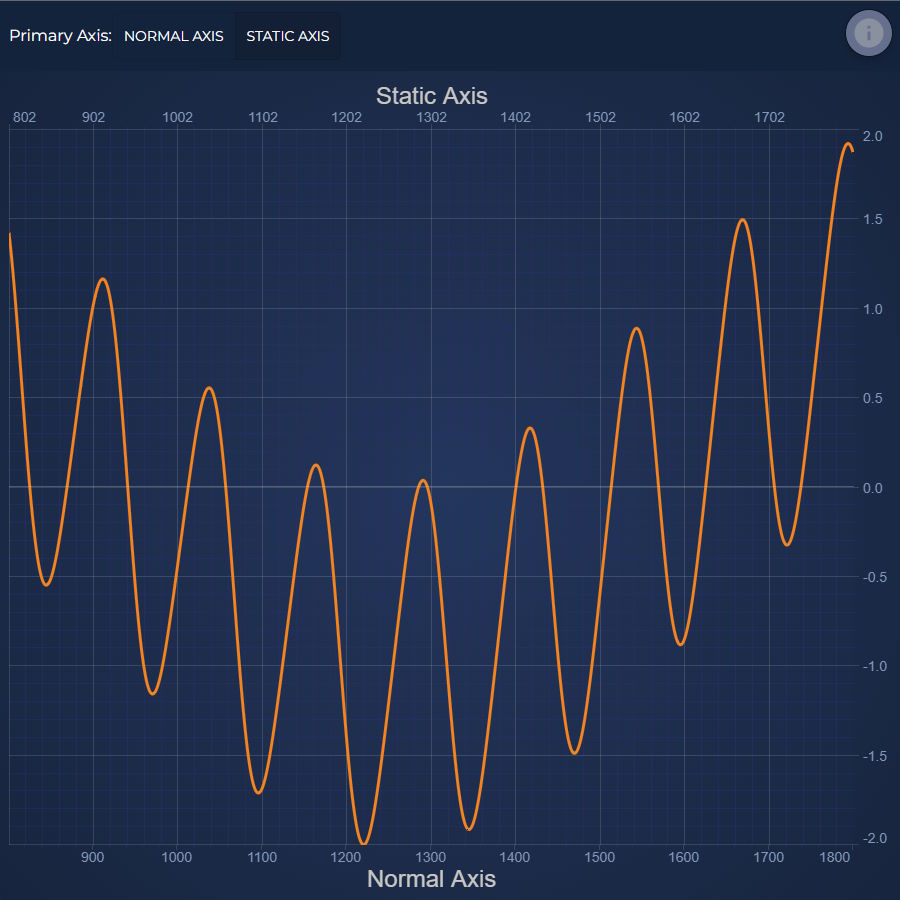
JavaScript Chart with Static X Axis
Demonstrates isStaticAxis on a JavaScript Chart using SciChart.js.
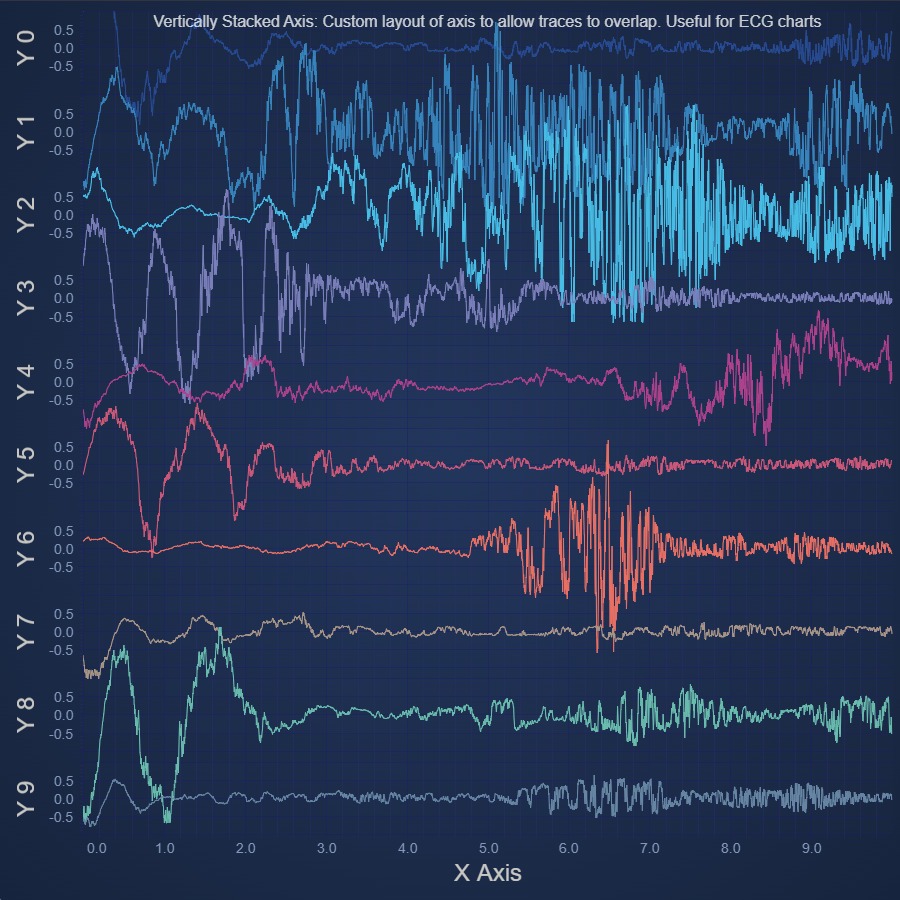
JavaScript Chart with Vertically Stacked Axes
Demonstrates Vertically Stacked Axes on a JavaScript Chart using SciChart.js, allowing data to overlap
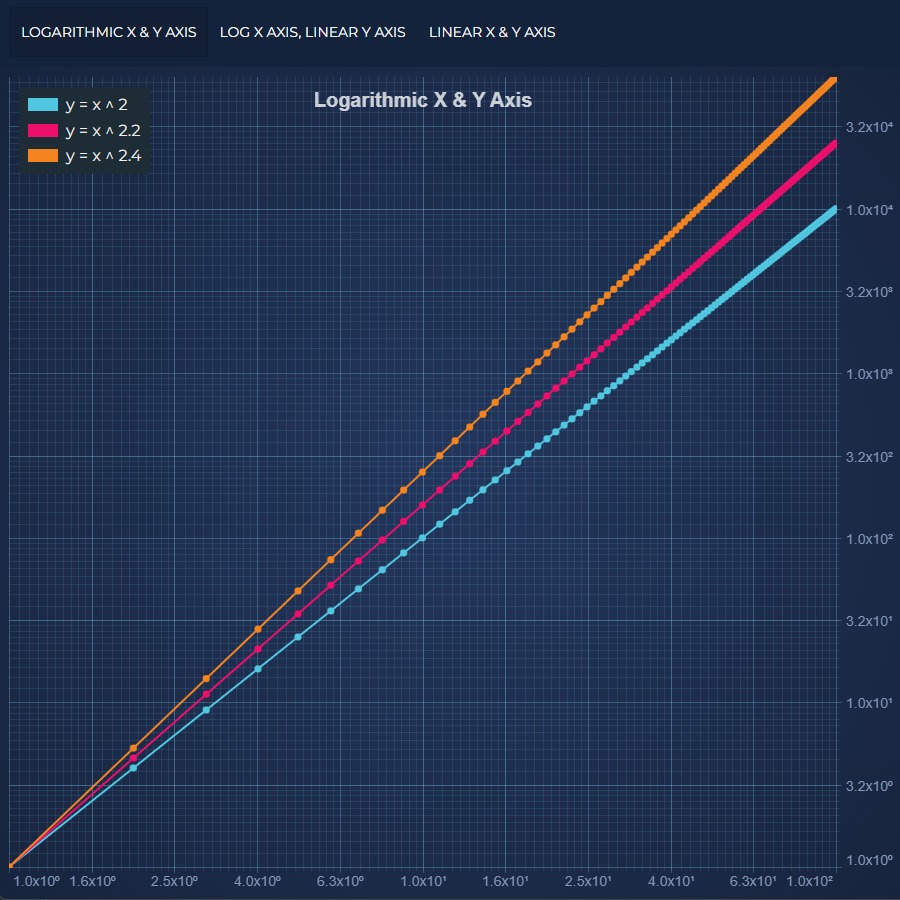
JavaScript Chart with Logarithmic Axis Example
Demonstrates Logarithmic Axis on a JavaScript Chart using SciChart.js. SciChart supports logarithmic axis with scientific or engineering notation and positive and negative values
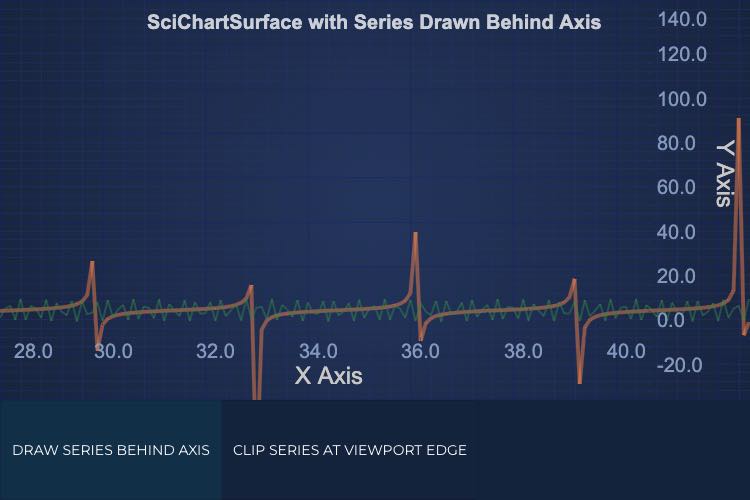
Draw JavaScript Chart Behind Axis
Demonstrates the option of the transparent Axes customization on a JavaScript Chart using SciChart.js.
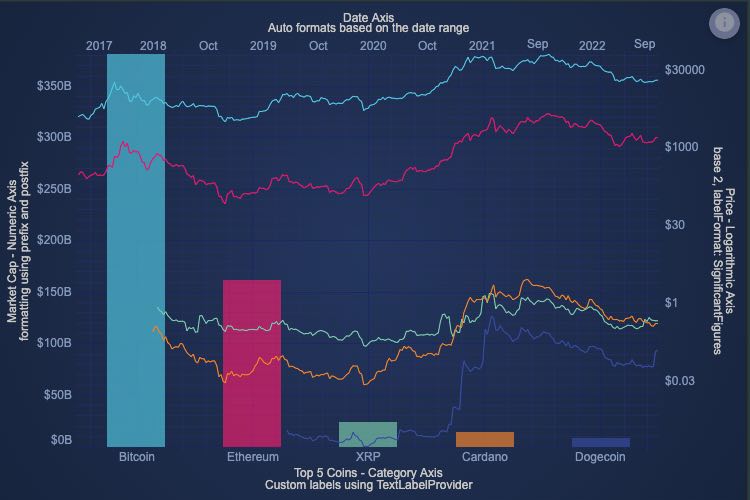
Axis Types
Demonstrates how to use arbitrary text for axis labels, rather than formatted data values, using the new TextLabelProvider
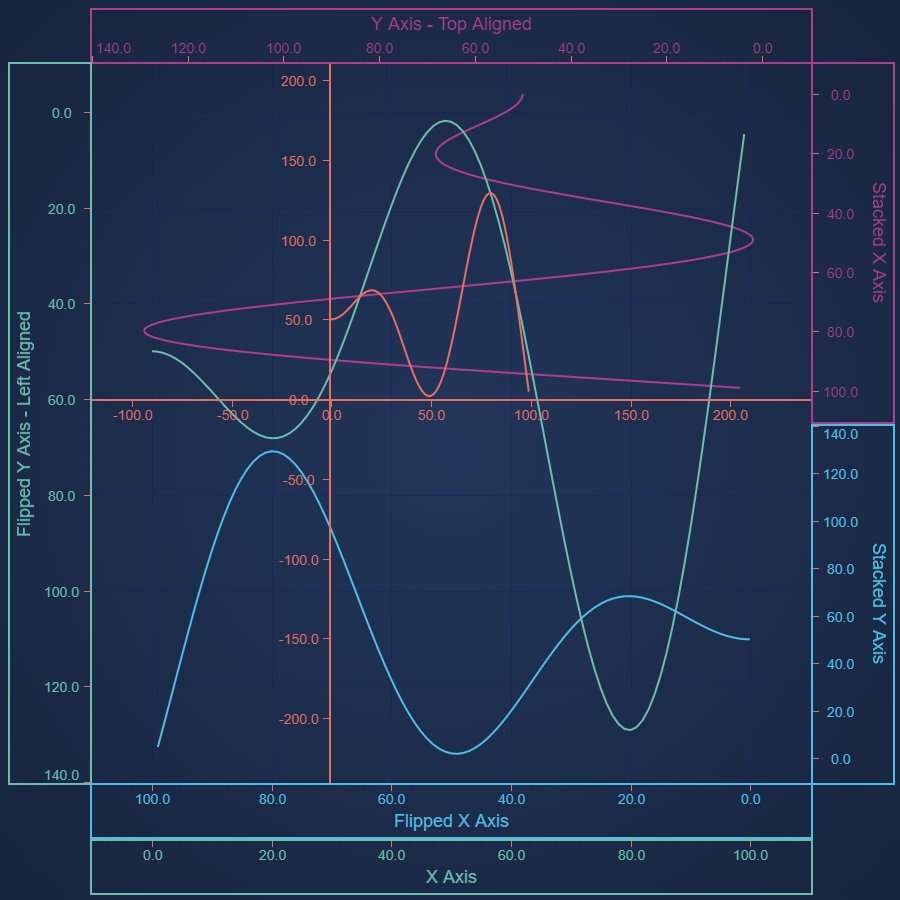
JavaScript Chart Axis Layout Options
Demonstrates outer, inner, central and stacked axes, and use of axis alignment to create vertical charts