JavaScript Stacked Column Chart
The example on this page demonstrates how to create a JavaScript Stacked Column Chart using our feature-rich JavaScript Chart Library, SciChart.js.
drawExample.ts
index.tsx
theme.ts
1import {
2    ENumericFormat,
3    MouseWheelZoomModifier,
4    NumericAxis,
5    SciChartSurface,
6    StackedColumnCollection,
7    StackedColumnRenderableSeries,
8    WaveAnimation,
9    XyDataSeries,
10    ZoomExtentsModifier,
11    ZoomPanModifier,
12    EColumnDataLabelPosition,
13    IStackedColumnSeriesDataLabelProviderOptions,
14    EVerticalTextPosition,
15    NumberRange,
16    Thickness,
17} from "scichart";
18import { appTheme } from "../../../theme";
19
20export const drawExample = async (rootElement: string | HTMLDivElement) => {
21    // Create a SciChartSurface
22    const { wasmContext, sciChartSurface } = await SciChartSurface.create(rootElement, {
23        theme: appTheme.SciChartJsTheme,
24    });
25
26    // Create XAxis, YAxis
27    sciChartSurface.xAxes.add(
28        new NumericAxis(wasmContext, {
29            labelFormat: ENumericFormat.Decimal,
30            labelPrecision: 0,
31            autoTicks: false,
32            majorDelta: 1,
33            minorDelta: 1,
34            drawMajorGridLines: false,
35            drawMinorGridLines: false,
36            drawMajorBands: false,
37            axisTitle: "Year",
38        })
39    );
40    sciChartSurface.yAxes.add(
41        new NumericAxis(wasmContext, {
42            labelPrecision: 0,
43            growBy: new NumberRange(0, 0.05),
44            axisTitle: "Sales $USD (Billion)",
45        })
46    );
47
48    // Data for the example
49    const xValues = [1992, 1993, 1994, 1995, 1996, 1997, 1998, 1999, 2000, 2001, 2002, 2003];
50    const yValues1 = [10, 13, 7, 16, 4, 6, 20, 14, 16, 10, 24, 11];
51    const yValues2 = [12, 17, 21, 15, 19, 18, 13, 21, 22, 20, 5, 10];
52    const yValues3 = [7, 30, 27, 24, 21, 15, 17, 26, 22, 28, 21, 22];
53    const yValues4 = [16, 10, 9, 8, 22, 14, 12, 27, 25, 23, 17, 17];
54    const yValues5 = [7, 24, 21, 11, 19, 17, 14, 27, 26, 22, 28, 16];
55
56    const dataLabels: IStackedColumnSeriesDataLabelProviderOptions = {
57        color: "#FFfFFF",
58        style: { fontSize: 12, fontFamily: "Arial", padding: new Thickness(0, 0, 2, 0) },
59        precision: 0,
60        positionMode: EColumnDataLabelPosition.Outside,
61        verticalTextPosition: EVerticalTextPosition.Center,
62    };
63
64    // Create some RenderableSeries - for each part of the stacked column
65    // Notice the stackedGroupId. This defines if series are stacked (same), or grouped side by side (different)
66    const rendSeries1 = new StackedColumnRenderableSeries(wasmContext, {
67        dataSeries: new XyDataSeries(wasmContext, { xValues, yValues: yValues1, dataSeriesName: "EU" }),
68        fill: appTheme.VividPurple,
69        stroke: appTheme.PaleSkyBlue,
70        opacity: 0.8,
71        stackedGroupId: "StackedGroupId",
72        dataLabels,
73    });
74
75    const rendSeries2 = new StackedColumnRenderableSeries(wasmContext, {
76        dataSeries: new XyDataSeries(wasmContext, { xValues, yValues: yValues2, dataSeriesName: "Asia" }),
77        fill: appTheme.VividPink,
78        stroke: appTheme.PaleSkyBlue,
79        opacity: 0.8,
80        stackedGroupId: "StackedGroupId",
81        dataLabels,
82    });
83
84    const rendSeries3 = new StackedColumnRenderableSeries(wasmContext, {
85        dataSeries: new XyDataSeries(wasmContext, { xValues, yValues: yValues3, dataSeriesName: "USA" }),
86        fill: appTheme.VividOrange,
87        stroke: appTheme.PaleSkyBlue,
88        opacity: 0.8,
89        stackedGroupId: "StackedGroupId",
90        dataLabels,
91    });
92
93    const rendSeries4 = new StackedColumnRenderableSeries(wasmContext, {
94        dataSeries: new XyDataSeries(wasmContext, { xValues, yValues: yValues4, dataSeriesName: "UK" }),
95        fill: appTheme.VividSkyBlue,
96        stroke: appTheme.PaleSkyBlue,
97        opacity: 0.8,
98        stackedGroupId: "StackedGroupId",
99        dataLabels,
100    });
101
102    const rendSeries5 = new StackedColumnRenderableSeries(wasmContext, {
103        dataSeries: new XyDataSeries(wasmContext, { xValues, yValues: yValues5, dataSeriesName: "Latam" }),
104        fill: appTheme.VividTeal,
105        stroke: appTheme.PaleSkyBlue,
106        opacity: 0.8,
107        stackedGroupId: "StackedGroupId",
108        dataLabels,
109    });
110
111    // To add the series to the chart, put them in a StackedColumnCollection
112    const stackedColumnCollection = new StackedColumnCollection(wasmContext, {
113        dataPointWidth: 0.6,
114    });
115
116    stackedColumnCollection.add(rendSeries1, rendSeries2, rendSeries3, rendSeries4, rendSeries5);
117    stackedColumnCollection.animation = new WaveAnimation({ duration: 1000, fadeEffect: true });
118
119    sciChartSurface.renderableSeries.add(stackedColumnCollection);
120
121    // Add some interactivity modifiers
122    sciChartSurface.chartModifiers.add(
123        new ZoomExtentsModifier(),
124        new ZoomPanModifier({ enableZoom: true }),
125        new MouseWheelZoomModifier()
126    );
127
128    sciChartSurface.zoomExtents();
129
130    const toggleHundredPercentMode = (value: boolean) => {
131        stackedColumnCollection.isOneHundredPercent = value;
132        sciChartSurface.zoomExtents(200);
133    };
134
135    const toggleDataLabels = (areDataLabelsVisible: boolean) => {
136        for (let i = 0; i < 5; i++) {
137            const columnSeries = stackedColumnCollection.get(i);
138            columnSeries.dataLabelProvider.style.fontSize = areDataLabelsVisible ? 0 : 12;
139        }
140        sciChartSurface.invalidateElement();
141    };
142
143    return { sciChartSurface, controls: { toggleHundredPercentMode, toggleDataLabels } };
144};
145
See Also: JavaScript Chart Types (28 Demos)

JavaScript Line Chart
Discover how to create a high performance JavaScript Line Chart with SciChart - the leading JavaScript library. Get your free demo now.
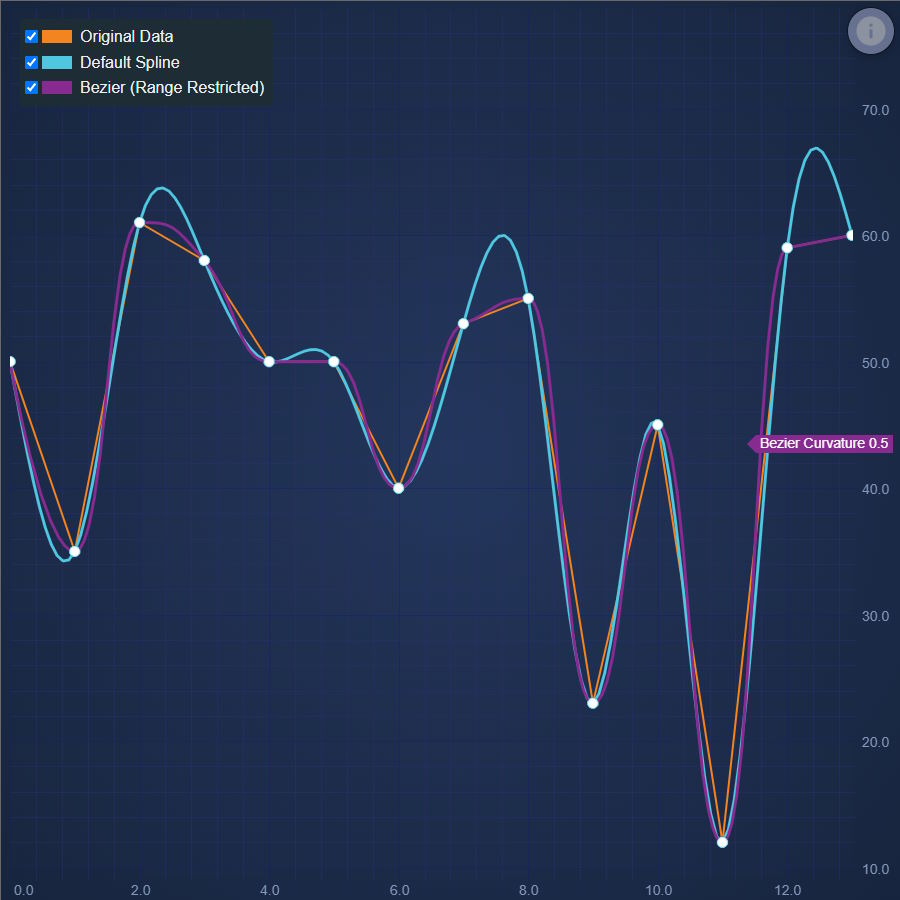
JavaScript Spline Line Chart
Discover how to create a JavaScript Spline Line Chart with SciChart. Demo includes algorithm for smoother lines. Get your free trial now.
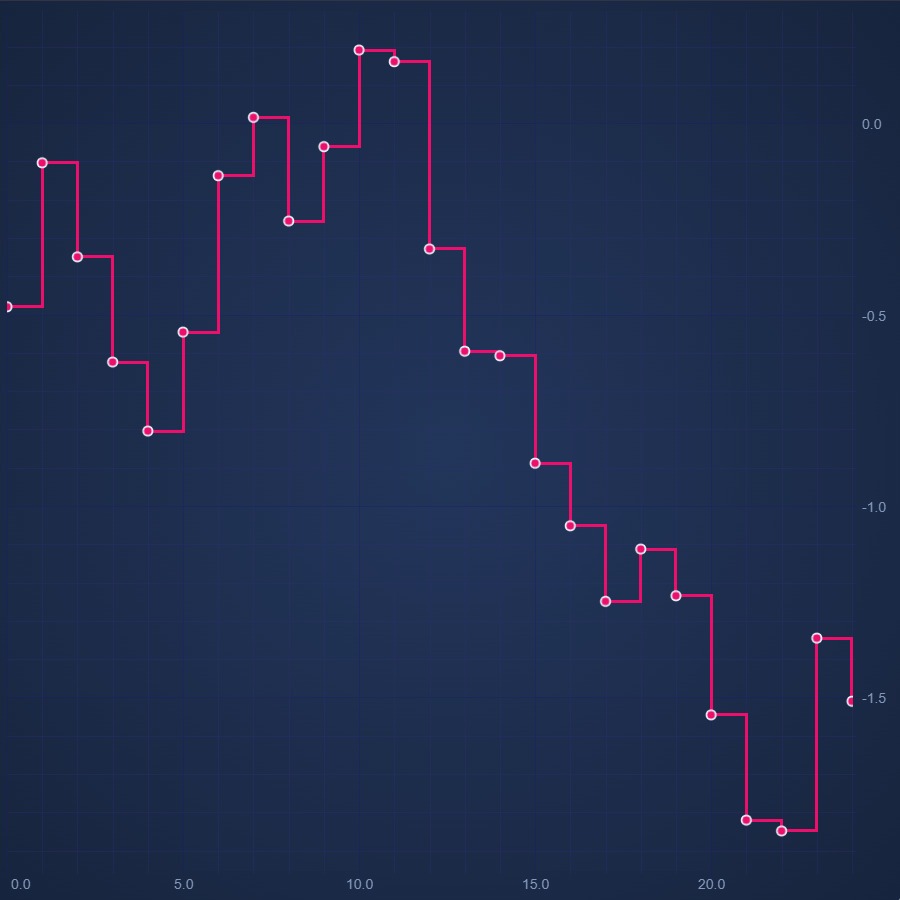
JavaScript Digital Line Chart
Discover how to create a JavaScript Digital Line Chart with SciChart - your feature-rich JavaScript Chart Library. Get your free demo now.
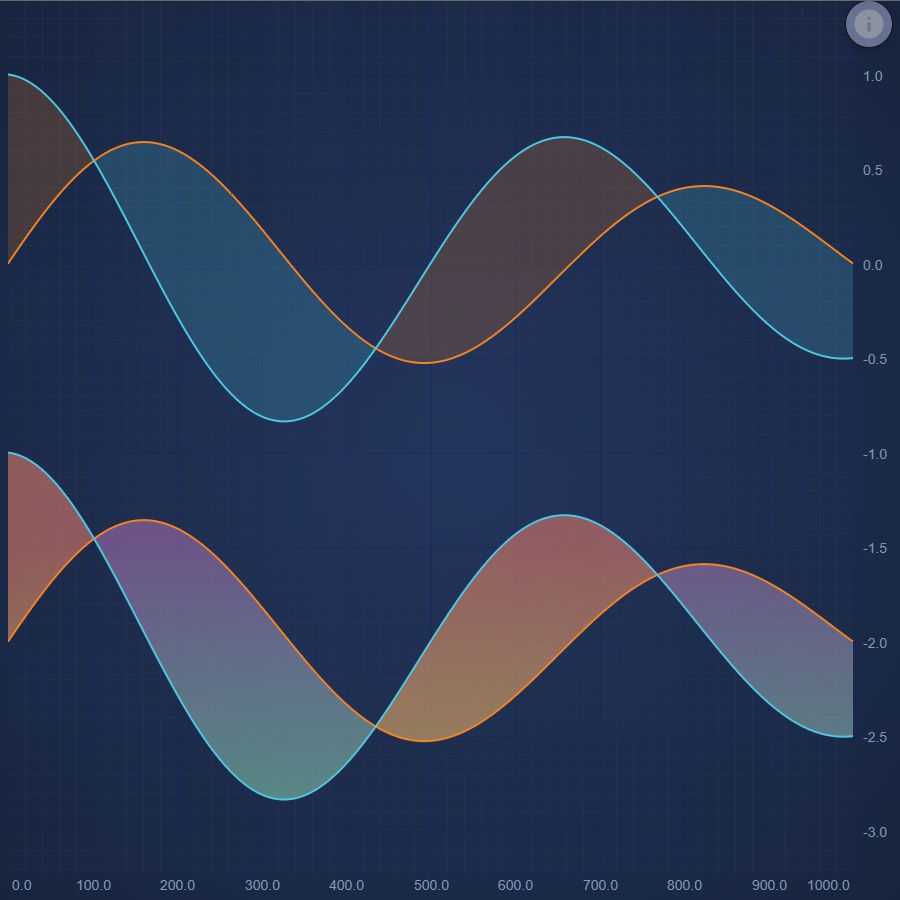
JavaScript Band Chart
Easily create a JavaScript Band Chart or High-Low Fill with SciChart - high performance JavaScript Chart Library. Get your free trial now.
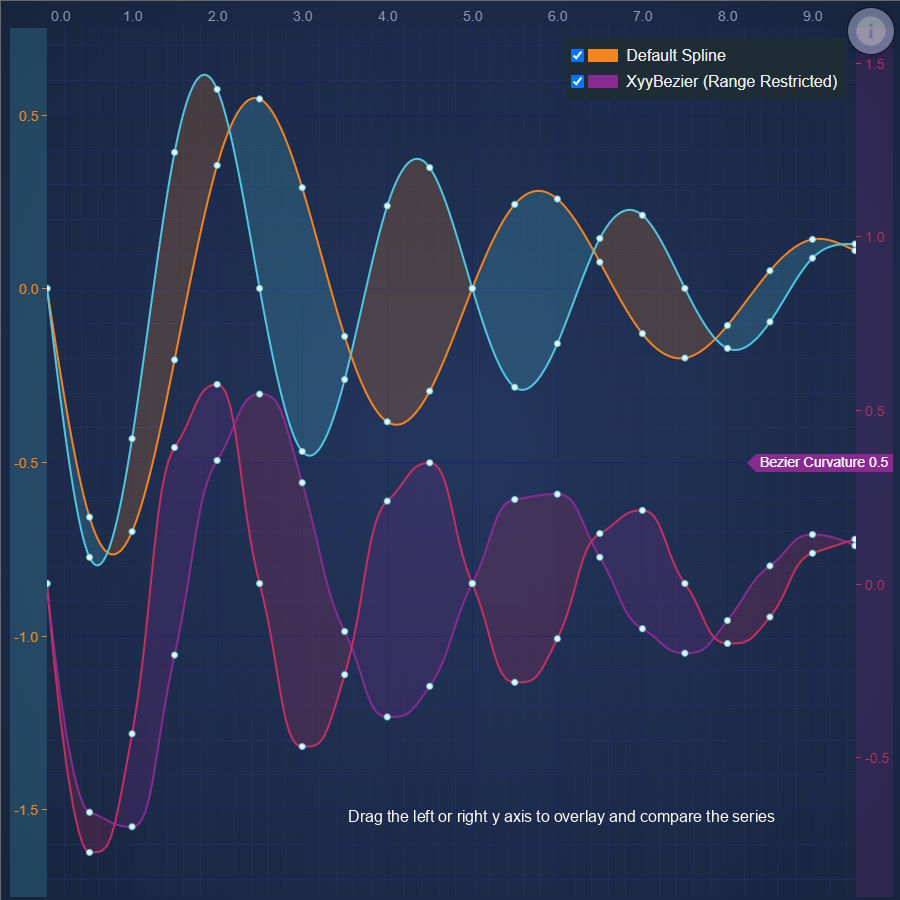
JavaScript Spline Band Chart
SciChart's JavaScript Spline Band Chart makes it easy to draw thresholds or fills between two lines on a chart. Get your free demo today.
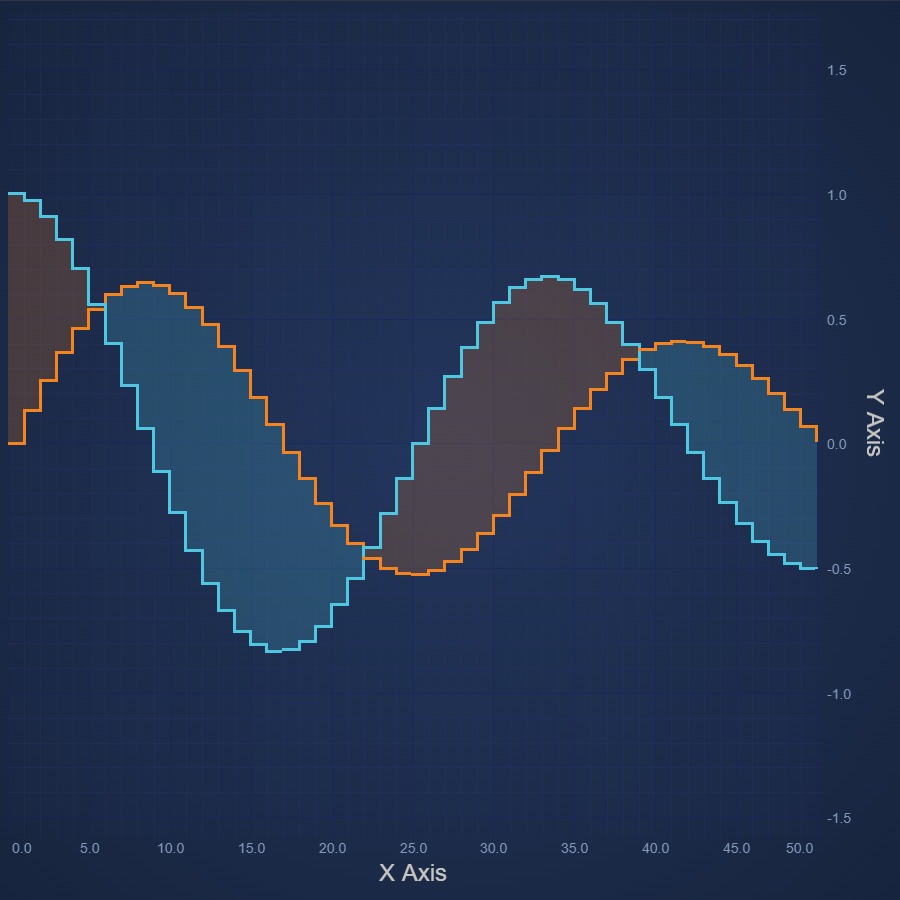
JavaScript Digital Band Chart
Learn how to create a JavaScript Digital Band Chart or High-Low Fill Chart with SciChart's easy-to-follow demos. Get your free trial today.
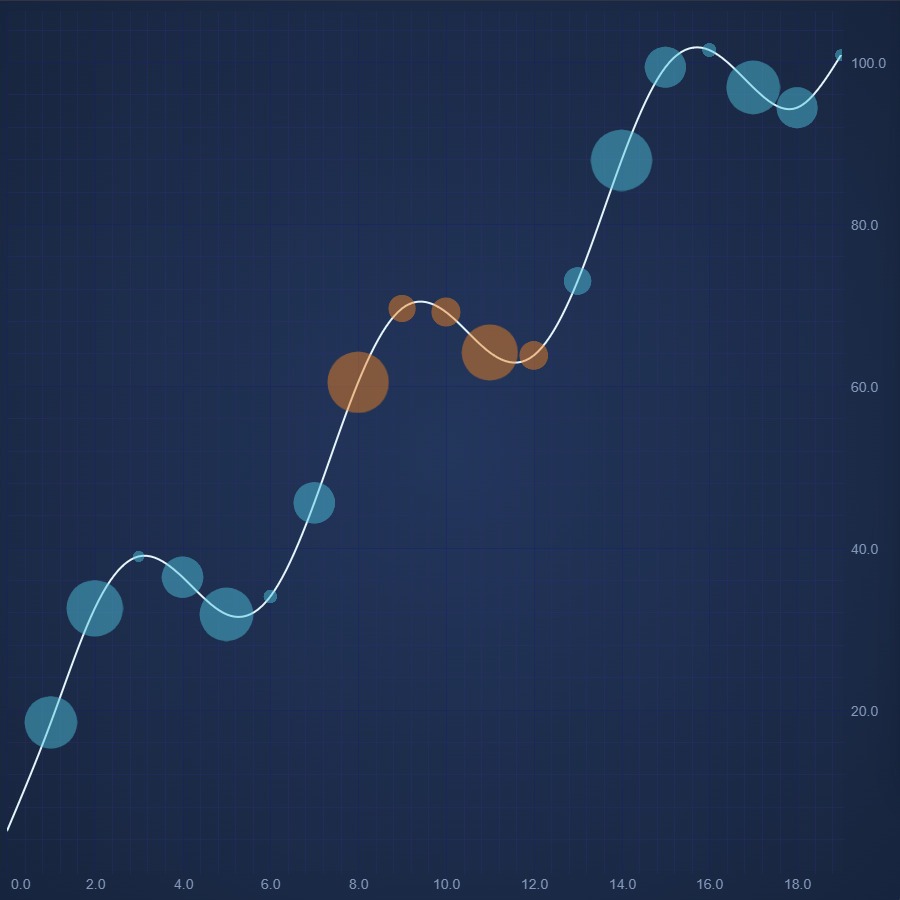
JavaScript Bubble Chart
Create a high performance JavaScript Bubble Chart with Sci-Chart. Demo shows how to draw point-markers at X,Y locations. Get your free demo now.

JavaScript Candlestick Chart
Discover how to create a JavaScript Candlestick Chart or Stock Chart using SciChart.js. For high Performance JavaScript Charts, get your free demo now.
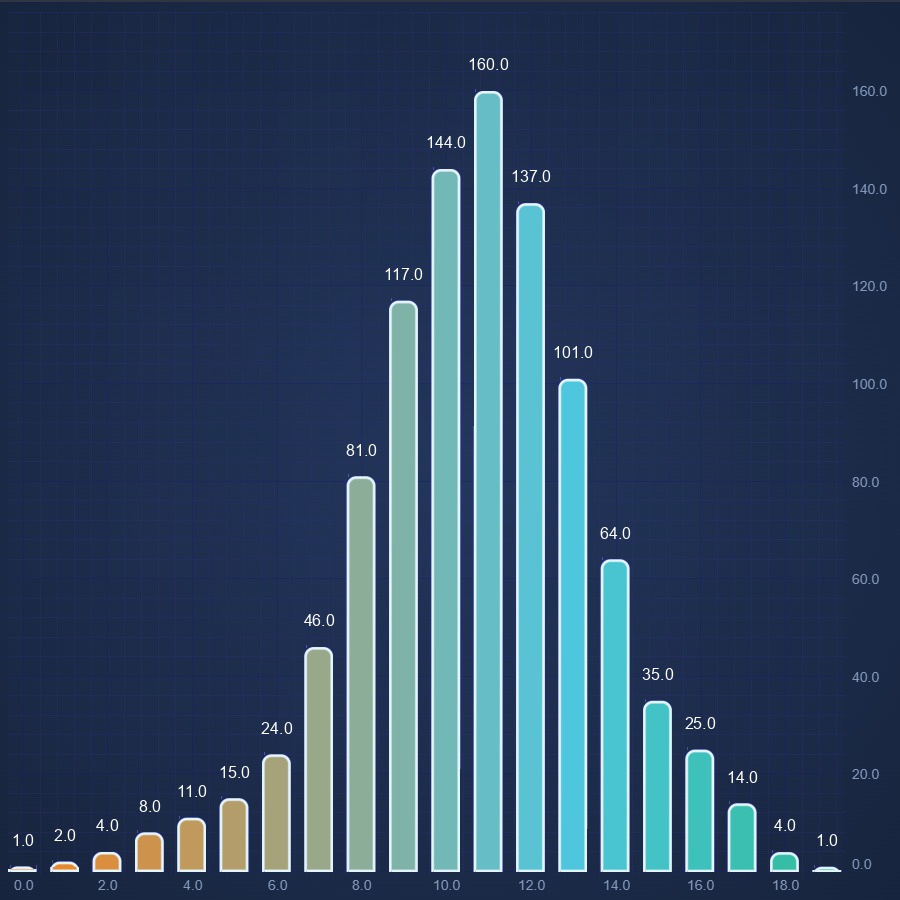
JavaScript Column Chart
JavaScript Column Chart demo by SciChart supports gradient fill and paletteproviders for more custom coloring options. Get your free demo now.
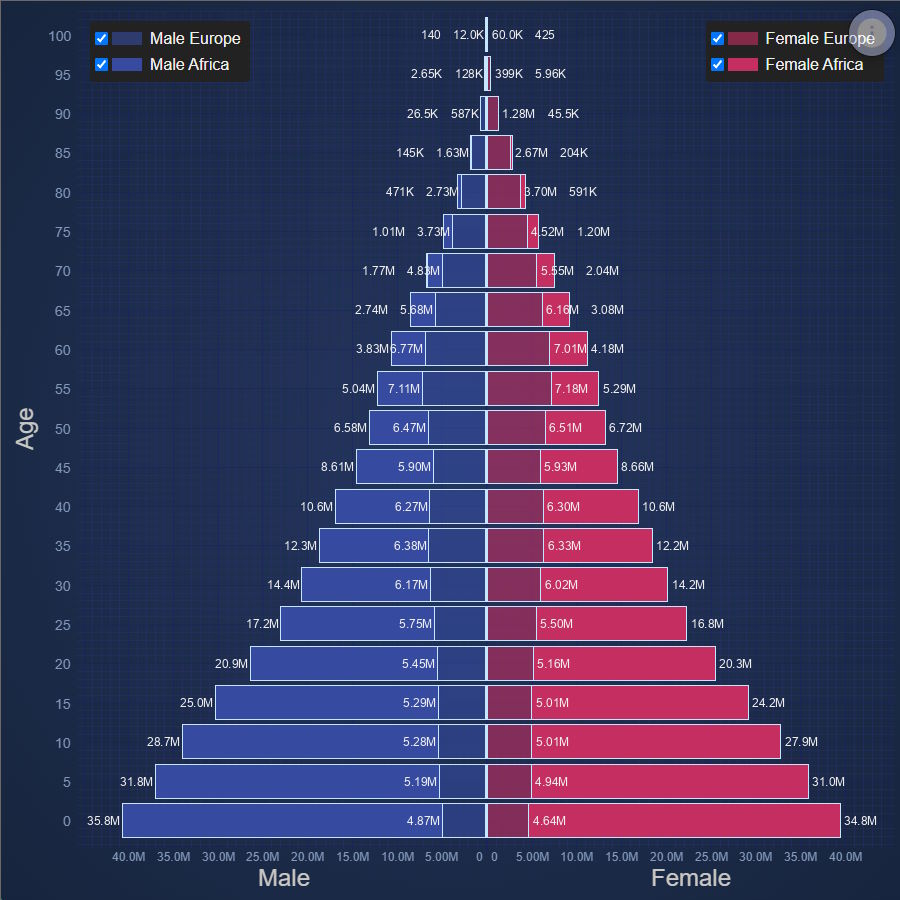
JavaScript Population Pyramid
Population Pyramid of Europe and Africa
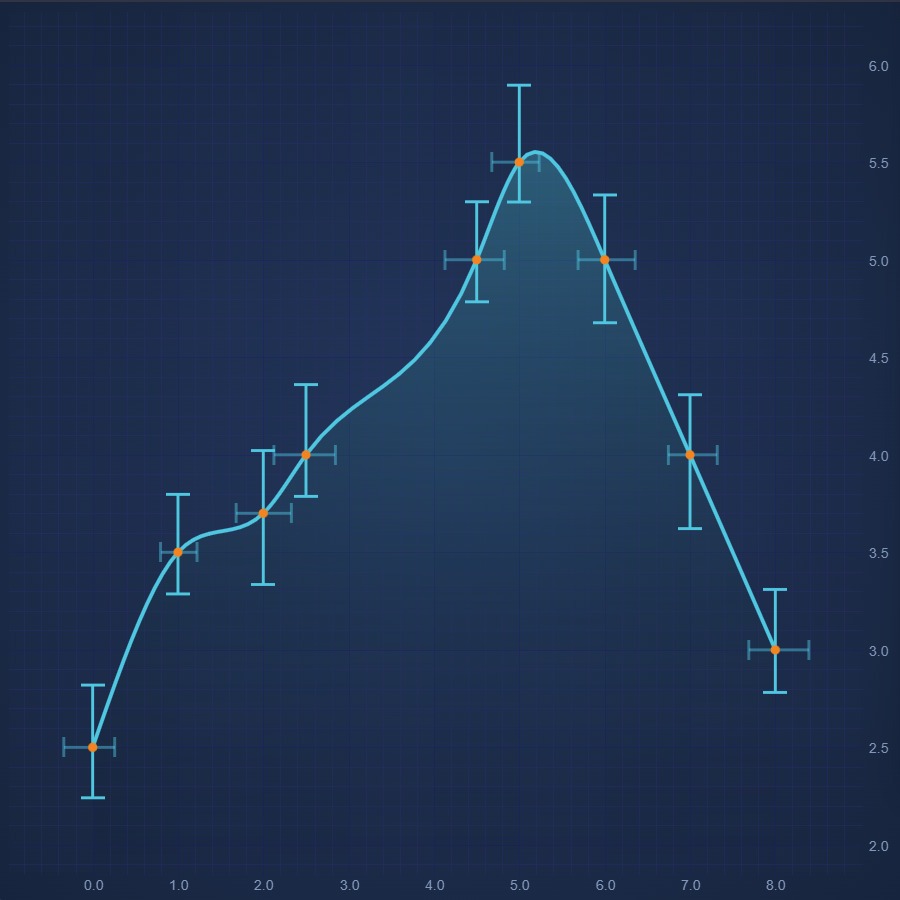
JavaScript Error Bars Chart
Create JavaScript Error Bars Chart using high performance SciChart.js. Display uncertainty or statistical confidence of a data-point. Get free demo now.
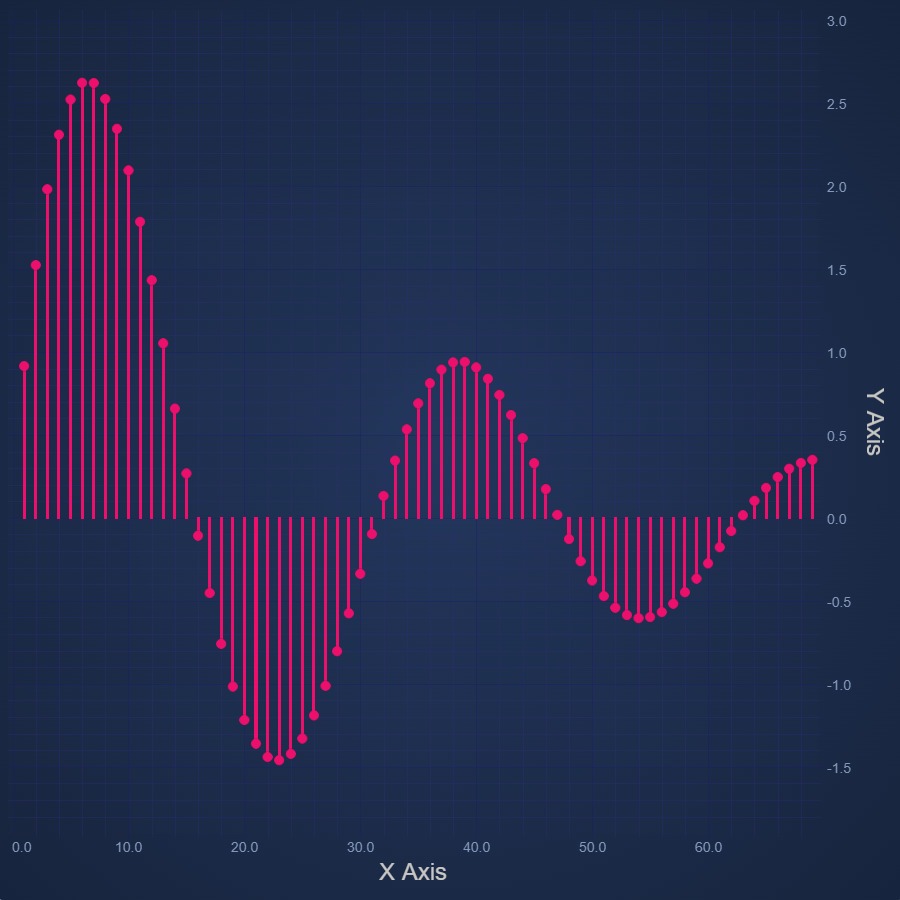
JavaScript Impulse Chart
Easily create JavaScript Impulse Chart or Stem Chart using SciChart.js - our own high performance JavaScript Chart Library. Get your free trial now.
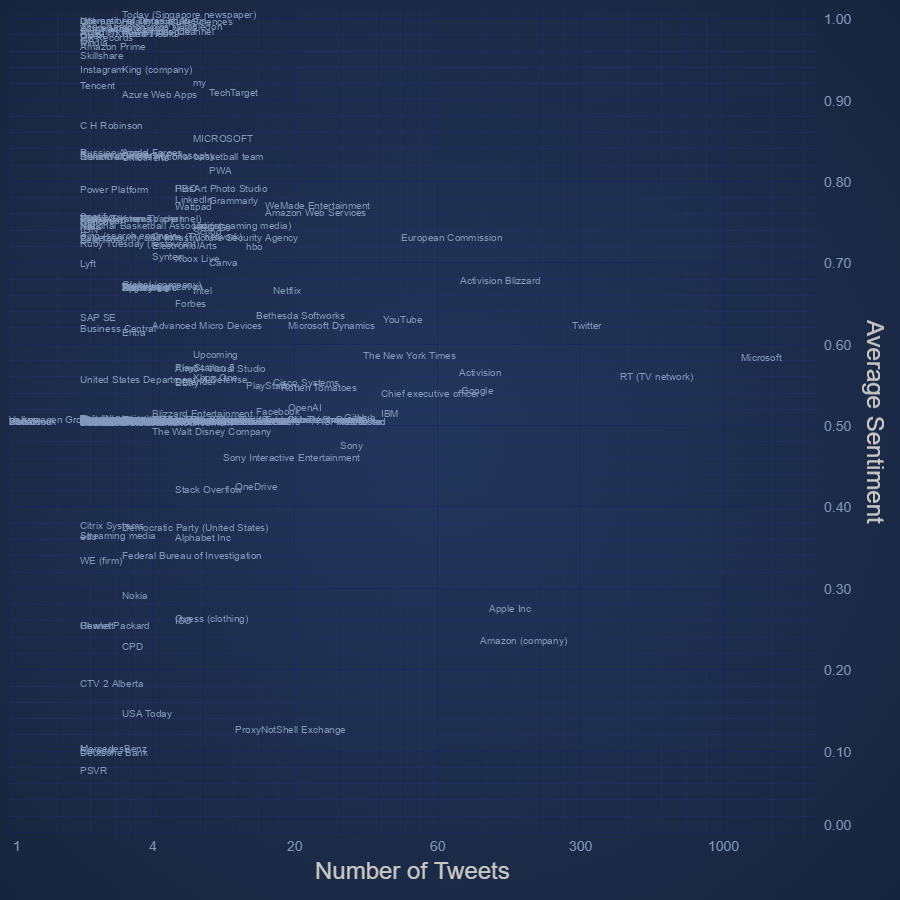
JavaScript Text Chart
Create JavaScript Text Chart with high performance SciChart.js.
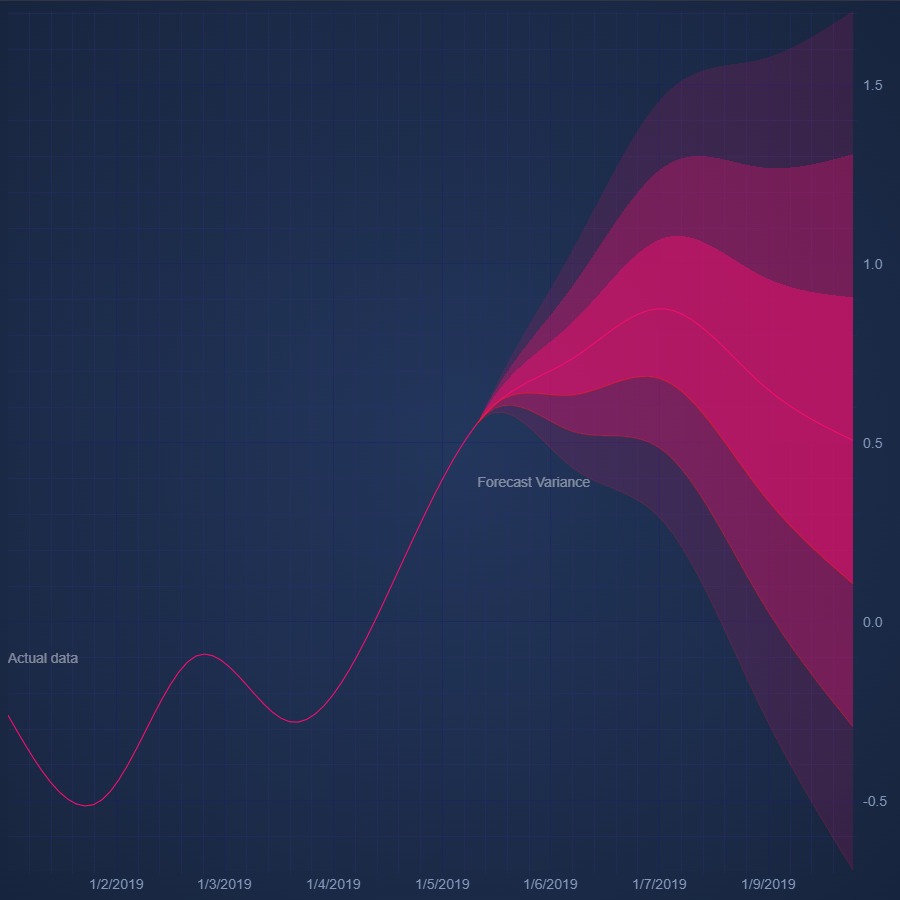
JavaScript Fan Chart
Discover how to create JavaScript Fan Chart with SciChart. Zoom in to see the detail you can go to using our JavaScript Charts. Get your free demo today.

JavaScript Heatmap Chart
Easily create a high performance JavaScript Heatmap Chart with SciChart. Get your free trial of our 5-star rated JavaScript Chart Component today.
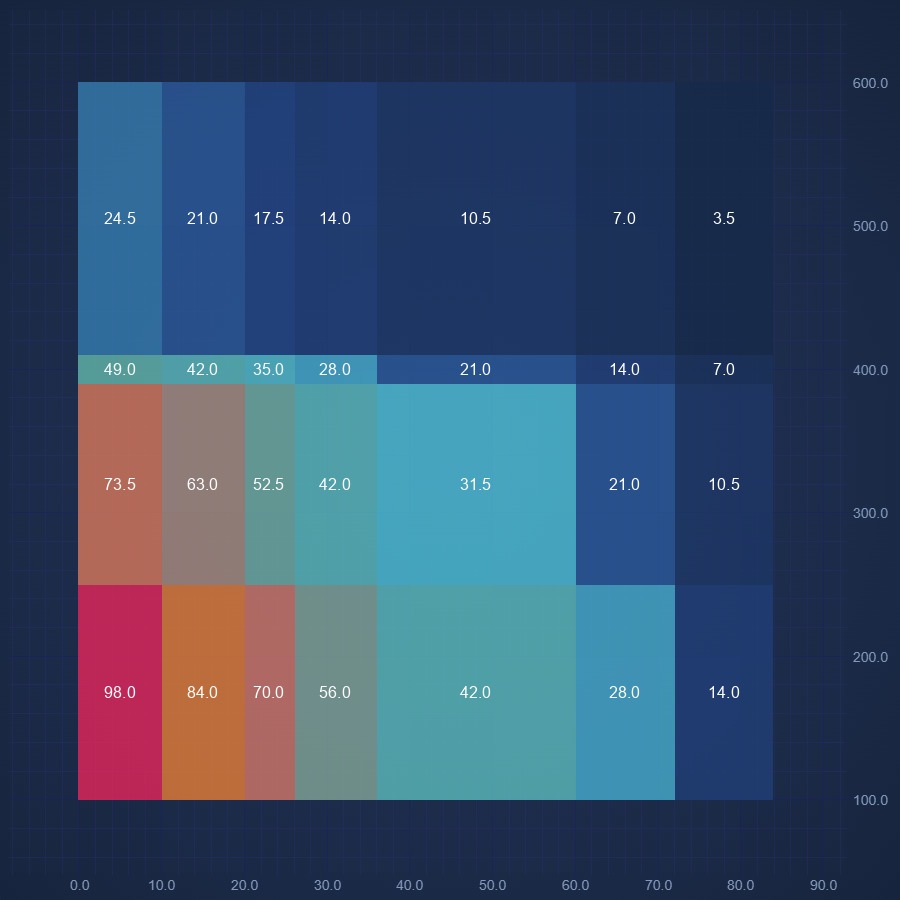
JavaScript Non Uniform Heatmap Chart
Create JavaScript Non Uniform Chart using high performance SciChart.js. Display Heatmap with variable cell sizes. Get free demo now.
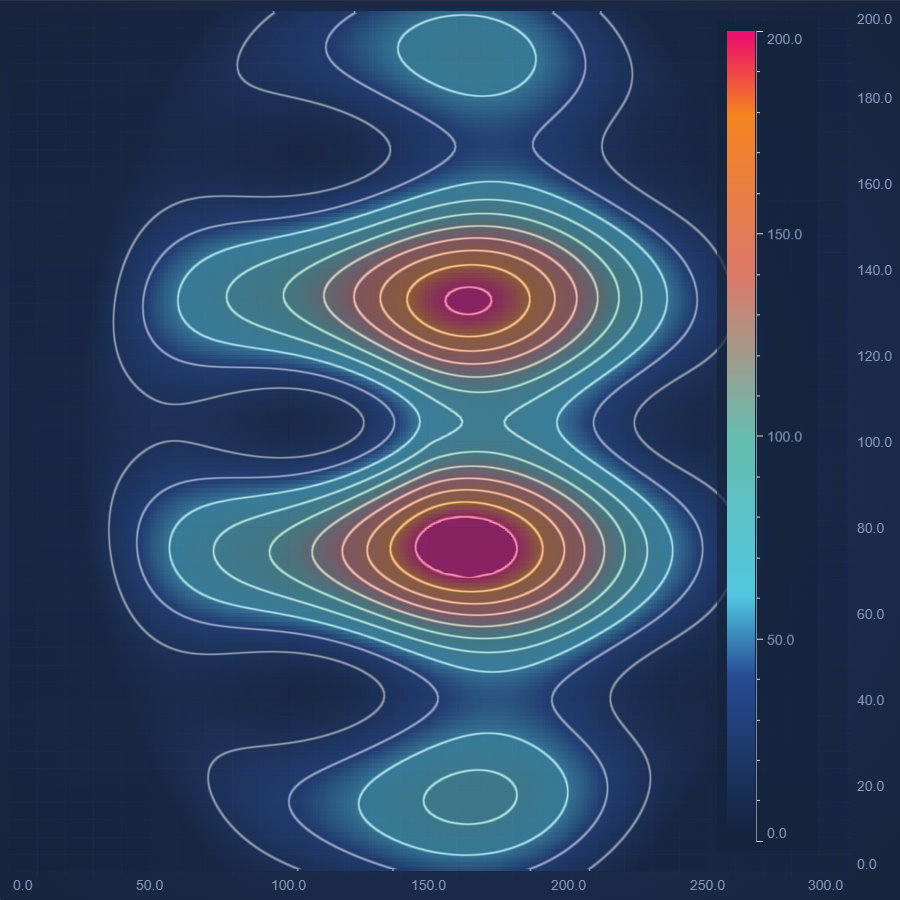
JavaScript Heatmap Chart With Contours
Design a highly dynamic JavaScript Heatmap Chart With Contours with SciChart's feature-rich JavaScript Chart Library. Get your free demo today.
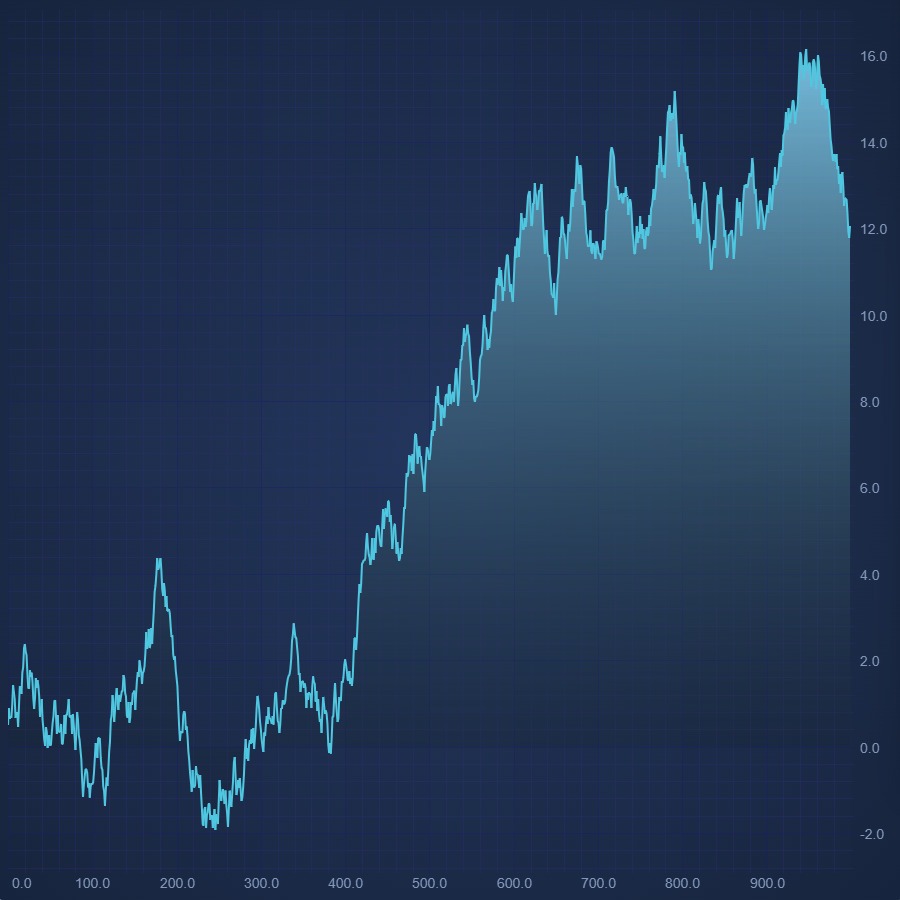
JavaScript Mountain Chart
Create JavaScript Mountain Chart with SciChart.js. Zero line can be zero or a specific value. Fill color can be solid or gradient as well. Get a free demo now.
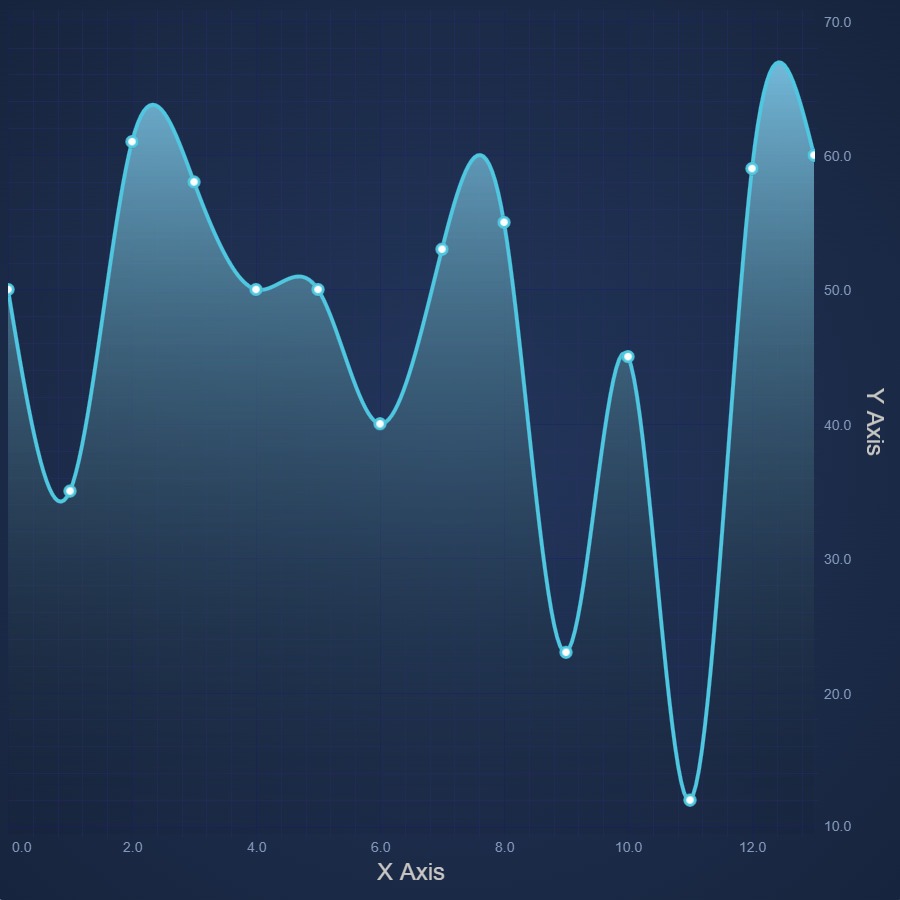
JavaScript Spline Mountain Chart
JavaScript Spline Mountain Chart design made easy. Use SciChart.js' JavaScript Charts for high performance, feature-rich designs. Get free demo now.
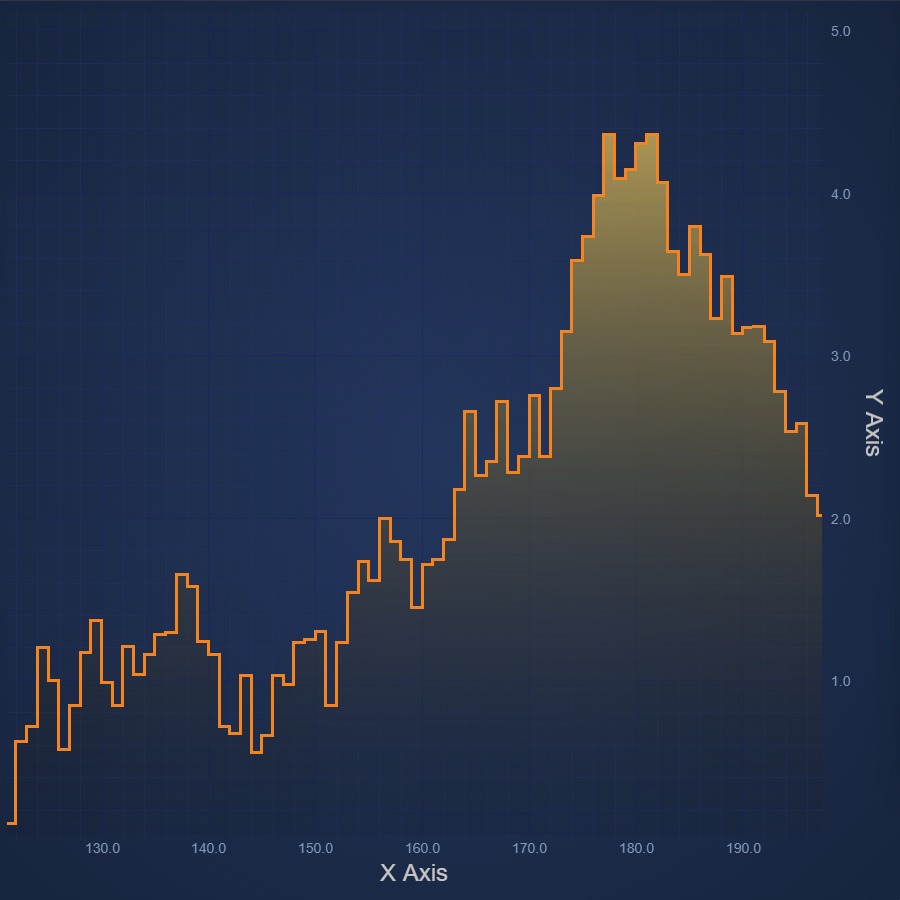
JavaScript Digital Mountain Chart
Create JavaScript Digital Mountain Chart with a stepped-line visual effect. Get your free trial of SciChart's 5-star rated JavaScript Chart Component now.
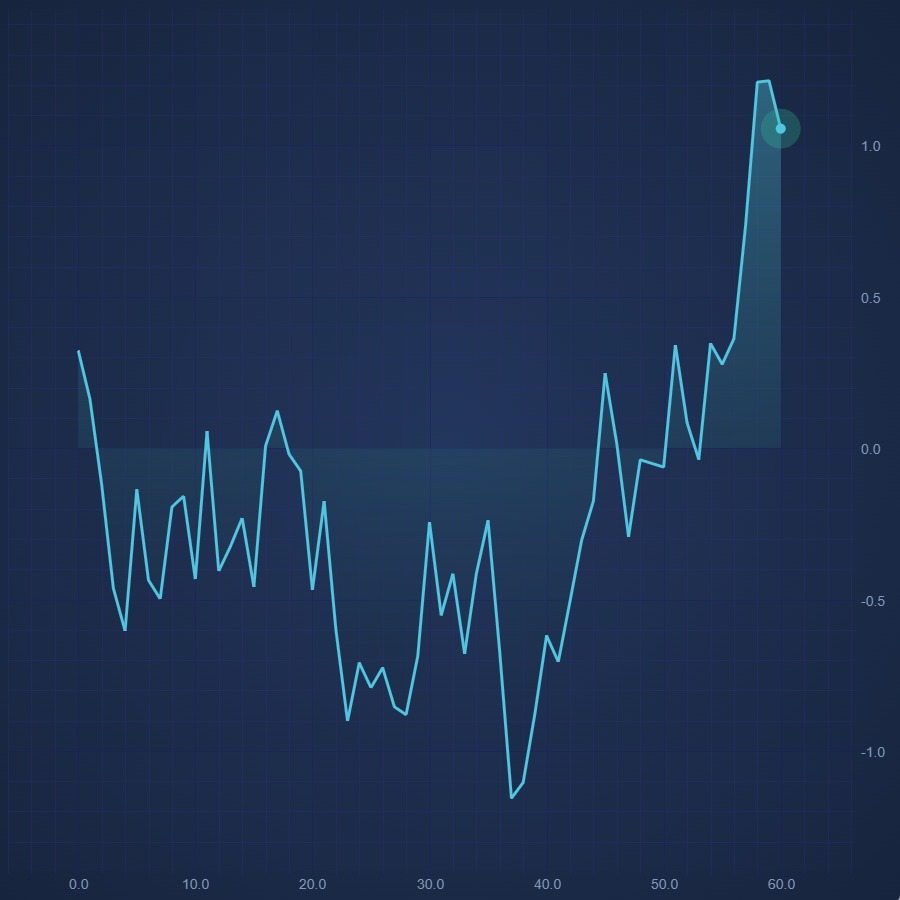
JavaScript Realtime Mountain Chart
JavaScript Realtime Mountain Chart made easy. Add animated, real-time updates with SciChart.js - high performance JavaScript Charts. Get free trial now.
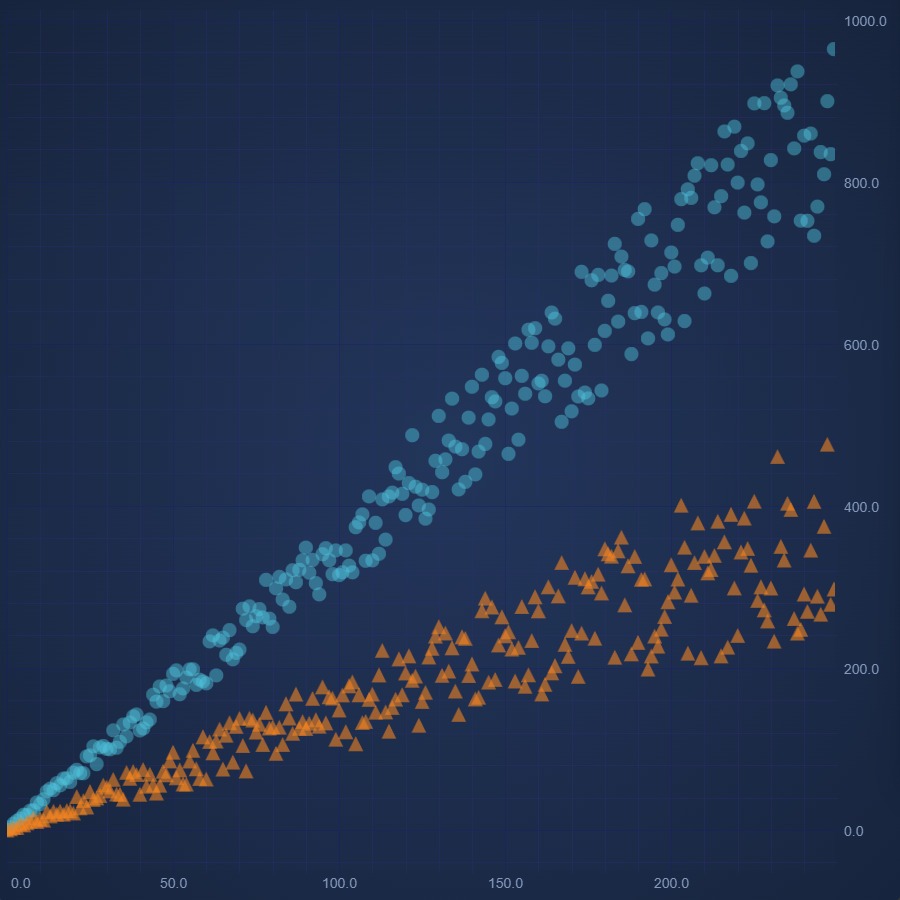
JavaScript Scatter Chart
Create JavaScript Scatter Chart with high performance SciChart.js. Easily render pre-defined point types. Supports custom shapes. Get your free trial now.
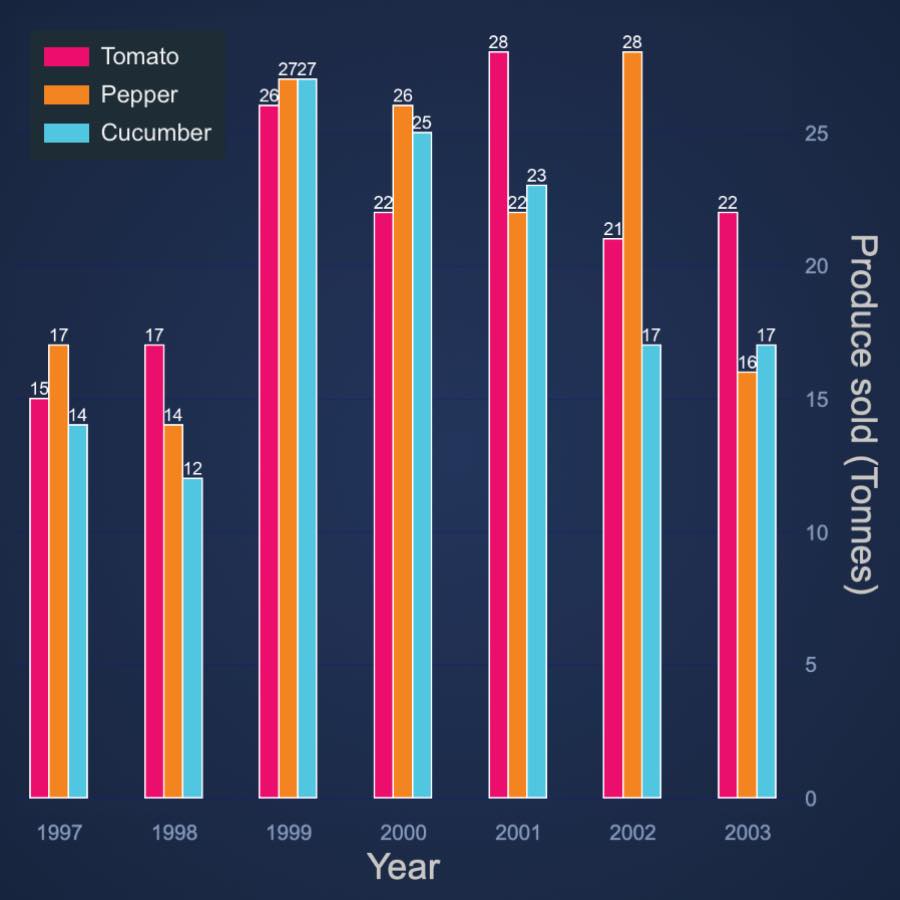
JavaScript Stacked Column Side by Side
Design JavaScript Stacked Group Column Chart side-by-side using our 5-star rated JavaScript Chart Framework, SciChart.js. Get your free demo now.
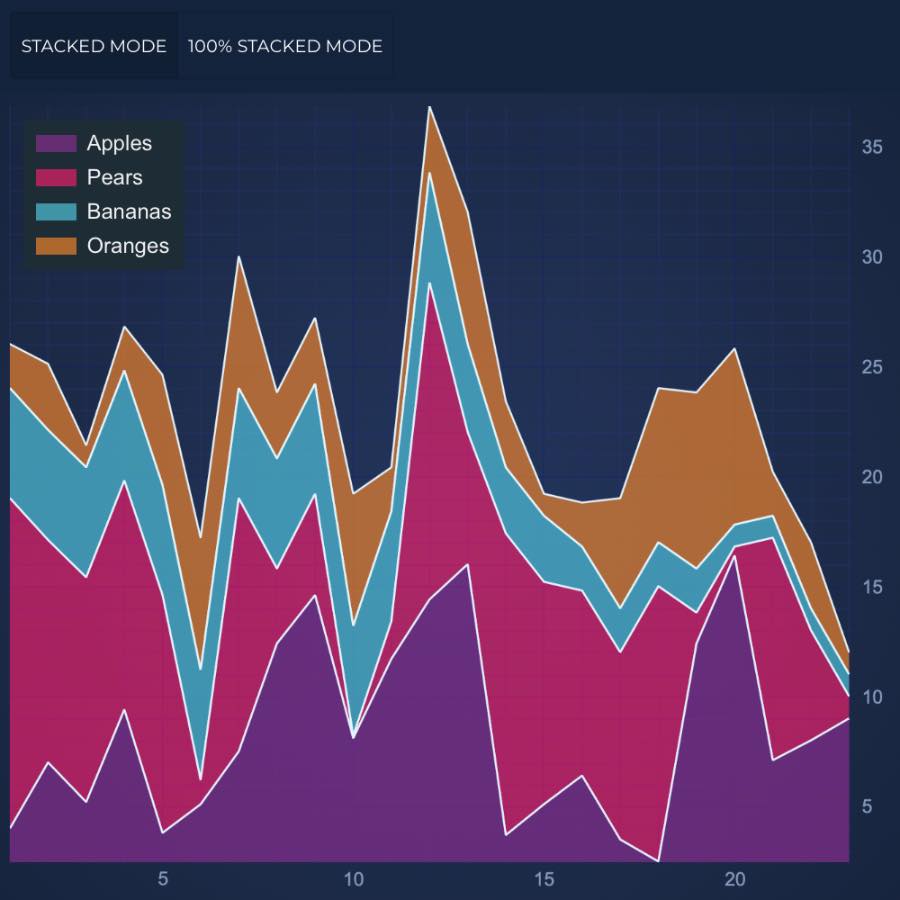
JavaScript Stacked Mountain Chart
Design a high performance JavaScript Stacked Mountain Chart with SciChart.js - your one-stop JavaScript chart library. Get free demo now to get started.
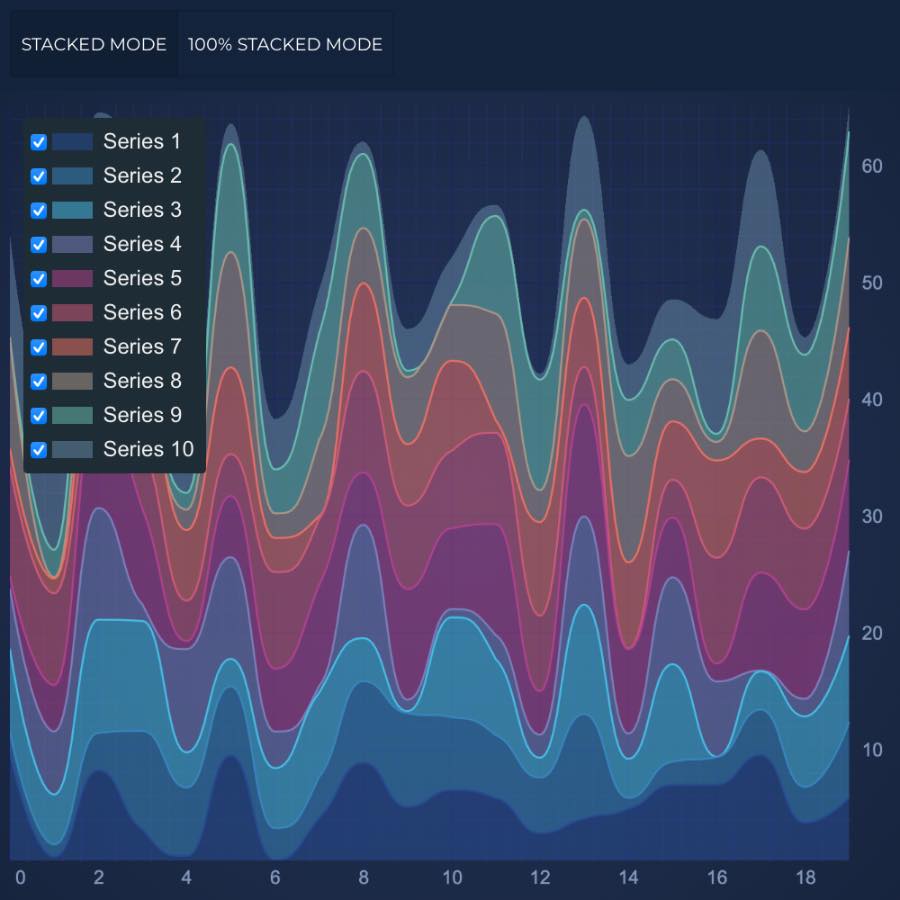
JavaScript Smooth Stacked Mountain Chart
Design a high performance JavaScript Stacked Mountain Chart with SciChart.js - your one-stop JavaScript chart library. Get free demo now to get started.
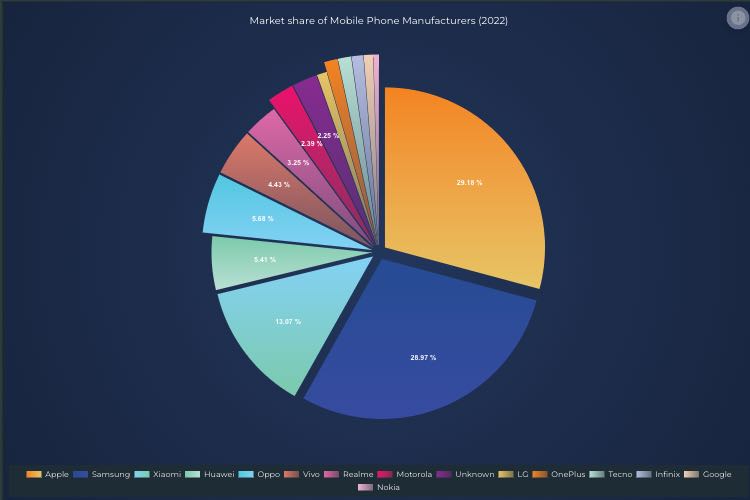
JavaScript Pie Chart
Easily create and customise a high performance JavaScript Pie Chart with 5-star rated SciChart.js. Get your free trial now to access the whole library.
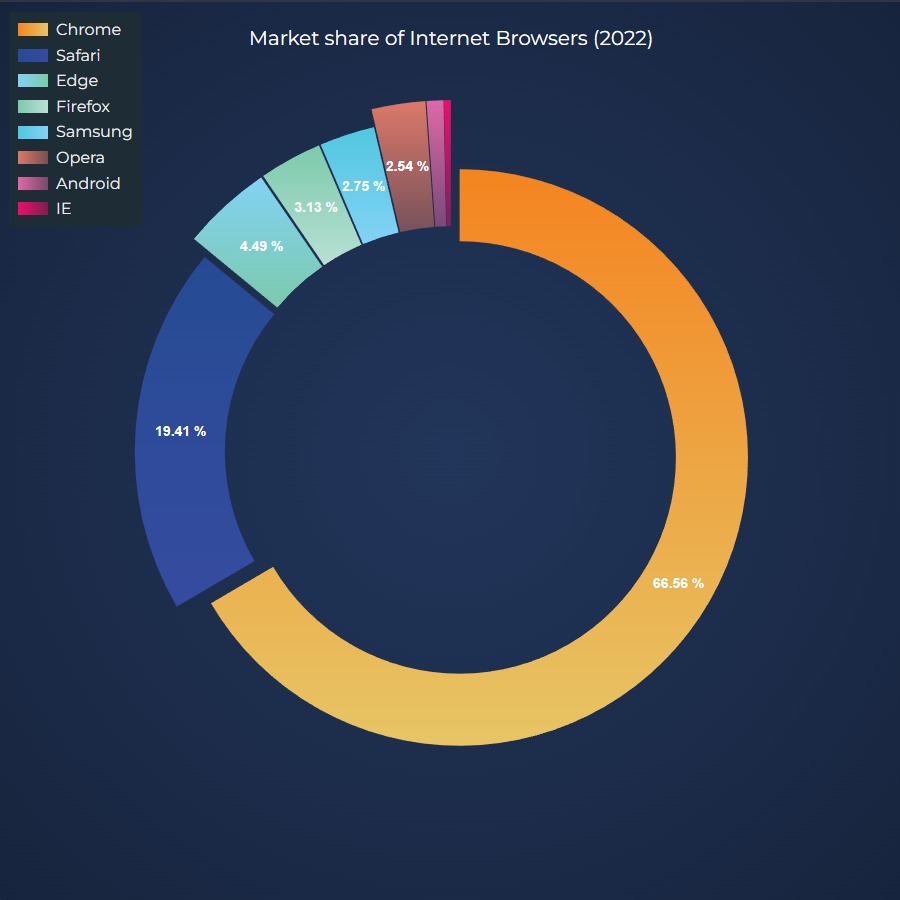
JavaScript Donut Chart
Create JavaScript Donut Chart with 5-star rated SciChart.js chart library. Supports legends, text labels, animated updates and more. Get free trial now.
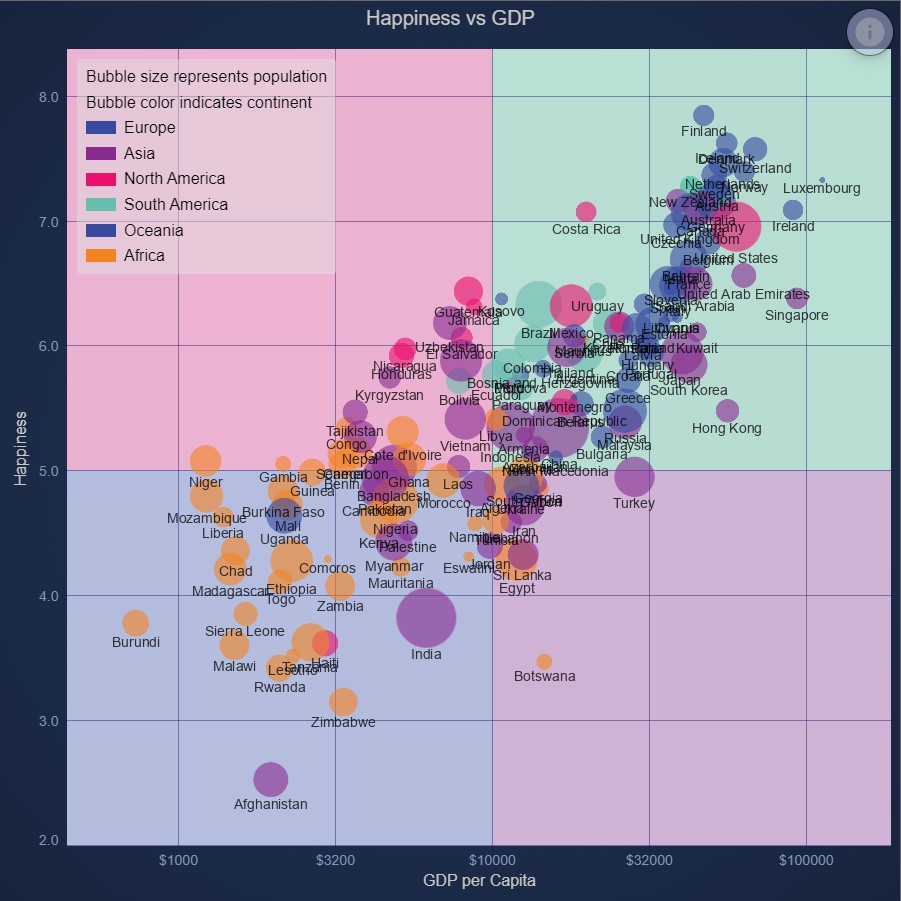
JavaScript Quadrant Chart using Background Annotations
Demonstrates how to color areas of the chart surface using background Annotations using SciChart.js Annotations API