Interactive Waterfall Spectral Chart
Demonstrates how to create a Waterfall chart in SciChart.js, showing chromotragraphy data with interactive selection of points.
drawExample.ts
index.tsx
ChartGroupLoader.tsx
Radix2FFT.ts
theme.ts
1import {
2    AnnotationDragDeltaEventArgs,
3    CustomAnnotation,
4    DefaultPaletteProvider,
5    EAutoRange,
6    EAxisAlignment,
7    ECoordinateMode,
8    EHorizontalAnchorPoint,
9    ELegendOrientation,
10    EStrokePaletteMode,
11    EVerticalAnchorPoint,
12    EXyDirection,
13    FastLineRenderableSeries,
14    FastMountainRenderableSeries,
15    GradientParams,
16    IRenderableSeries,
17    LegendModifier,
18    libraryVersion,
19    MouseWheelZoomModifier,
20    NumberRange,
21    NumericAxis,
22    Point,
23    SciChartJsNavyTheme,
24    SciChartSurface,
25    SeriesSelectionModifier,
26    Thickness,
27    TSciChart,
28    XyDataSeries,
29    ZoomExtentsModifier,
30    ZoomPanModifier,
31} from "scichart";
32import { Radix2FFT } from "../AudioAnalyzer/Radix2FFT";
33
34export const divMainChartId = "sciChart1";
35export const divCrossSection1 = "sciChart2";
36export const divCrossSection2 = "sciChart3";
37
38// This function generates some spectral data for the waterfall chart
39const createSpectralData = (n: number) => {
40    const spectraSize = 1024;
41    const timeData = new Array(spectraSize);
42
43    // Generate some random data with spectral components
44    for (let i = 0; i < spectraSize; i++) {
45        timeData[i] =
46            2.0 * Math.sin((2 * Math.PI * i) / (20 + n * 0.2)) +
47            5 * Math.sin((2 * Math.PI * i) / (10 + n * 0.01)) +
48            10 * Math.sin((2 * Math.PI * i) / (5 + n * -0.002)) +
49            2.0 * Math.random();
50    }
51
52    // Do a fourier-transform on the data to get the frequency domain
53    const transform = new Radix2FFT(spectraSize);
54    const yValues = transform.run(timeData).slice(0, 300); // We only want the first N points just to make the example cleaner
55
56    // This is just setting a floor to make the data cleaner for the example
57    for (let i = 0; i < yValues.length; i++) {
58        yValues[i] =
59            yValues[i] < -30 || yValues[i] > -5 ? (yValues[i] < -30 ? -30 : Math.random() * 9 - 6) : yValues[i];
60    }
61    yValues[0] = -30;
62
63    // we need x-values (sequential numbers) for the frequency data
64    const xValues = yValues.map((value, index) => index);
65
66    return { xValues, yValues };
67};
68
69// class CustomOffsetAxis extends NumericAxis {
70//     constructor(wasmContext: TSciChart, options: INumericAxisOptions) {
71//         super(wasmContext, options);
72//     }
73
74//     public customOffset: number = 0;
75
76//     public get offset(): number {
77//         return this.customOffset;
78//     }
79
80//     public set offset(value: number) {
81//         // do nothing
82//     }
83// }
84
85// tslint:disable-next-line:max-classes-per-file
86class CrossSectionPaletteProvider extends DefaultPaletteProvider {
87    public selectedIndex: number = -1;
88    public shouldUpdate: boolean = true;
89
90    public override shouldUpdatePalette(): boolean {
91        return this.shouldUpdate;
92    }
93
94    public override overrideStrokeArgb(xValue: number, yValue: number, index: number, opacity: number): number {
95        if (index === this.selectedIndex || index + 1 === this.selectedIndex || index - 1 === this.selectedIndex) {
96            return 0xffff8a42;
97        }
98        return undefined;
99    }
100}
101
102// This function returns methods for initializing the example
103export const getChartsInitializationAPI = () => {
104    const theme = new SciChartJsNavyTheme();
105
106    let mainChartSurface: SciChartSurface;
107    let mainChartSelectionModifier: SeriesSelectionModifier;
108    const crossSectionPaletteProvider = new CrossSectionPaletteProvider();
109    let dragMeAnnotation: CustomAnnotation;
110
111    // This function creates the main chart with waterfall series
112    // To do this, we create N series, each with its own X,Y axis with a different X,Y offset
113    // all axis other than the first are hidden
114    const initMainChart = async (rootElement: string | HTMLDivElement) => {
115        const { sciChartSurface, wasmContext } = await SciChartSurface.create(rootElement, {
116            disableAspect: true,
117            theme,
118        });
119
120        mainChartSurface = sciChartSurface;
121
122        const seriesCount = 50;
123        for (let i = 0; i < seriesCount; i++) {
124            // Create one yAxis per series
125            const yAxis = new NumericAxis(wasmContext, {
126                id: "Y" + i,
127                axisAlignment: EAxisAlignment.Left,
128                maxAutoTicks: 5,
129                drawMinorGridLines: false,
130                visibleRange: new NumberRange(-50, 60),
131                isVisible: i === seriesCount - 1,
132                overrideOffset: 3 * -i,
133            });
134            sciChartSurface.yAxes.add(yAxis);
135
136            // Create a shared, default xaxis
137            const xAxis = new NumericAxis(wasmContext, {
138                id: "X" + i,
139                axisAlignment: EAxisAlignment.Bottom,
140                maxAutoTicks: 5,
141                drawMinorGridLines: false,
142                growBy: new NumberRange(0, 0.2),
143                isVisible: i === seriesCount - 1,
144                overrideOffset: 2 * i,
145            });
146            sciChartSurface.xAxes.add(xAxis);
147
148            // Create some data for the example
149            const { xValues, yValues } = createSpectralData(i);
150            mainChartSurface.rendered.subscribe(() => {
151                // Don't recalculate the palette unless the selected index changes
152                crossSectionPaletteProvider.shouldUpdate = false;
153            });
154            const lineSeries = new FastLineRenderableSeries(wasmContext, {
155                id: "S" + i,
156                xAxisId: "X" + i,
157                yAxisId: "Y" + i,
158                stroke: "#64BAE4",
159                strokeThickness: 1,
160                dataSeries: new XyDataSeries(wasmContext, { xValues, yValues, dataSeriesName: `Spectra ${i}` }),
161                paletteProvider: crossSectionPaletteProvider,
162            });
163            // Insert series in reverse order so the ones at the bottom of the chart are drawn first
164            // sciChartSurface.renderableSeries.insert(0, lineSeries);
165            sciChartSurface.renderableSeries.add(lineSeries);
166        }
167
168        // Add an annotation which can be dragged horizontally to update the bottom right chart
169        dragMeAnnotation = new CustomAnnotation({
170            svgString: `<svg xmlns="http://www.w3.org/2000/svg" width="100" height="82">
171                  <g>
172                    <line x1="50%" y1="10" x2="50%" y2="27" stroke="#FFBE93" stroke-dasharray="2,2" />
173                    <circle cx="50%" cy="10" r="5" fill="#FFBE93" />
174                    <rect x="2" y="27" rx="10" ry="10" width="96" height="30" fill="#64BAE433" stroke="#64BAE4" stroke-width="2" />
175                    <text x="50%" y="42" fill="White" text-anchor="middle" alignment-baseline="middle" >Drag me!</text>
176                  </g>
177                </svg>`,
178            x1: 133,
179            y1: -25,
180            xAxisId: "X0",
181            yAxisId: "Y0",
182            isEditable: true,
183            annotationsGripsFill: "Transparent",
184            annotationsGripsStroke: "Transparent",
185            selectionBoxStroke: "Transparent",
186            horizontalAnchorPoint: EHorizontalAnchorPoint.Center,
187            verticalAnchorPoint: EVerticalAnchorPoint.Top,
188        });
189        sciChartSurface.annotations.add(dragMeAnnotation);
190
191        // Place an annotation with further instructions in the top right of the chart
192        const promptAnnotation = new CustomAnnotation({
193            svgString: `<svg xmlns="http://www.w3.org/2000/svg" width="130" height="82">
194              <g>
195                <line x1="5" y1="77" x2="40" y2="33" stroke="#ffffff" stroke-dasharray="2,2" />
196                <circle cx="5" cy="77" r="5" fill="#ffffff" />
197                <g>
198                  <rect x="10" y="2" width="118" height="30" rx="10" ry="10" fill="#64BAE433" stroke="#64BAE4" stroke-width="2" />
199                  <text x="68" y="19" fill="white" text-anchor="middle" alignment-baseline="middle" font-size="12">Hover/click chart</text>
200                </g>
201              </g>
202            </svg>`,
203            xAxisId: "X0",
204            yAxisId: "Y0",
205            isEditable: false,
206            xCoordinateMode: ECoordinateMode.Relative,
207            yCoordinateMode: ECoordinateMode.Relative,
208            horizontalAnchorPoint: EHorizontalAnchorPoint.Right,
209            verticalAnchorPoint: EVerticalAnchorPoint.Top,
210            x1: 0.9,
211            y1: 0.1,
212        });
213
214        sciChartSurface.annotations.add(promptAnnotation);
215
216        // Add zooming behaviours
217        sciChartSurface.chartModifiers.add(
218            new ZoomPanModifier({ enableZoom: true, xyDirection: EXyDirection.XDirection }),
219            new MouseWheelZoomModifier({ xyDirection: EXyDirection.XDirection }),
220            new ZoomExtentsModifier({ xyDirection: EXyDirection.XDirection })
221        );
222
223        const updateSeriesSelectionState = (series: IRenderableSeries) => {
224            series.stroke = series.isSelected ? "White" : series.isHovered ? "#FFBE93" : "#64BAE4";
225            series.strokeThickness = series.isSelected || series.isHovered ? 3 : 1;
226        };
227
228        let prevSelectedSeries: IRenderableSeries = sciChartSurface.renderableSeries.get(0);
229        // Add selection behaviour
230        mainChartSelectionModifier = new SeriesSelectionModifier({
231            enableHover: true,
232            enableSelection: true,
233            hitTestRadius: 5,
234            onSelectionChanged: (args) => {
235                if (args.selectedSeries.length > 0) {
236                    prevSelectedSeries = args.selectedSeries[0];
237                    args.allSeries.forEach(updateSeriesSelectionState);
238                } else {
239                    prevSelectedSeries.isSelected = true;
240                }
241            },
242            onHoverChanged: (args) => {
243                args.allSeries.forEach(updateSeriesSelectionState);
244            },
245        });
246        sciChartSurface.chartModifiers.add(mainChartSelectionModifier);
247        return { sciChartSurface };
248    };
249
250    let crossSectionSelectedSeries: IRenderableSeries;
251    let crossSectionHoveredSeries: IRenderableSeries;
252    let crossSectionSliceSeries: XyDataSeries;
253    let crossSectionLegendModifier: LegendModifier;
254
255    // In the bottom left chart, add two series to show the currently hovered/selected series on the main chart
256    // These will be updated in the selection callback below
257    const initCrossSectionLeft = async (rootElement: string | HTMLDivElement) => {
258        const { sciChartSurface, wasmContext } = await SciChartSurface.create(rootElement, {
259            disableAspect: true,
260            theme,
261        });
262
263        sciChartSurface.xAxes.add(
264            new NumericAxis(wasmContext, {
265                autoRange: EAutoRange.Always,
266                drawMinorGridLines: false,
267            })
268        );
269        sciChartSurface.yAxes.add(
270            new NumericAxis(wasmContext, {
271                autoRange: EAutoRange.Never,
272                axisAlignment: EAxisAlignment.Left,
273                visibleRange: new NumberRange(-30, 5),
274                drawMinorGridLines: false,
275            })
276        );
277
278        crossSectionSelectedSeries = new FastLineRenderableSeries(wasmContext, {
279            stroke: "#ff6600",
280            strokeThickness: 3,
281        });
282        sciChartSurface.renderableSeries.add(crossSectionSelectedSeries);
283        crossSectionHoveredSeries = new FastMountainRenderableSeries(wasmContext, {
284            stroke: "#64BAE477",
285            strokeThickness: 3,
286            strokeDashArray: [2, 2],
287            fillLinearGradient: new GradientParams(new Point(0, 0), new Point(0, 1), [
288                { color: "#64BAE455", offset: 0 },
289                { color: "#64BAE400", offset: 1 },
290            ]),
291            dataSeries: crossSectionSliceSeries,
292            zeroLineY: -999,
293        });
294        sciChartSurface.renderableSeries.add(crossSectionHoveredSeries);
295
296        // Add a legend to the bottom left chart
297        crossSectionLegendModifier = new LegendModifier({
298            showCheckboxes: false,
299            orientation: ELegendOrientation.Horizontal,
300        });
301        crossSectionLegendModifier.isEnabled = false;
302        sciChartSurface.chartModifiers.add(crossSectionLegendModifier);
303
304        return { sciChartSurface };
305    };
306
307    const initCrossSectionRight = async (rootElement: string | HTMLDivElement) => {
308        const { sciChartSurface, wasmContext } = await SciChartSurface.create(rootElement, {
309            disableAspect: true,
310            theme,
311            title: "Cross Section Slice",
312            titleStyle: {
313                fontSize: 13,
314                padding: Thickness.fromNumber(10),
315            },
316        });
317
318        sciChartSurface.xAxes.add(
319            new NumericAxis(wasmContext, {
320                autoRange: EAutoRange.Always,
321                drawMinorGridLines: false,
322            })
323        );
324        sciChartSurface.yAxes.add(
325            new NumericAxis(wasmContext, {
326                autoRange: EAutoRange.Never,
327                axisAlignment: EAxisAlignment.Left,
328                visibleRange: new NumberRange(-30, 5),
329                drawMinorGridLines: false,
330            })
331        );
332
333        crossSectionSliceSeries = new XyDataSeries(wasmContext);
334        sciChartSurface.renderableSeries.add(
335            new FastMountainRenderableSeries(wasmContext, {
336                stroke: "#64BAE4",
337                strokeThickness: 3,
338                strokeDashArray: [2, 2],
339                fillLinearGradient: new GradientParams(new Point(0, 0), new Point(0, 1), [
340                    { color: "#64BAE477", offset: 0 },
341                    { color: "#64BAE433", offset: 1 },
342                ]),
343                dataSeries: crossSectionSliceSeries,
344                zeroLineY: -999,
345            })
346        );
347
348        return { sciChartSurface };
349    };
350
351    const configureAfterInit = () => {
352        // Link interactions together
353        mainChartSelectionModifier.selectionChanged.subscribe((args) => {
354            const selectedSeries = args.selectedSeries[0]?.dataSeries;
355            if (selectedSeries) {
356                crossSectionSelectedSeries.dataSeries = selectedSeries;
357            }
358            crossSectionLegendModifier.isEnabled = true;
359            crossSectionLegendModifier.sciChartLegend?.invalidateLegend();
360        });
361        mainChartSelectionModifier.hoverChanged.subscribe((args) => {
362            const hoveredSeries = args.hoveredSeries[0]?.dataSeries;
363            if (hoveredSeries) {
364                crossSectionHoveredSeries.dataSeries = hoveredSeries;
365            }
366            crossSectionLegendModifier.sciChartLegend?.invalidateLegend();
367        });
368
369        // Add a function to update drawing the cross-selection when the drag annotation is dragged
370        const updateDragAnnotation = () => {
371            // Don't allow to drag vertically, only horizontal
372            dragMeAnnotation.y1 = -25;
373
374            // Find the index to the x-values that the axis marker is on
375            // Note you could just loop getNativeXValues() here but the wasmContext.NumberUtil function does it for you
376            const dataIndex = mainChartSurface.webAssemblyContext2D.NumberUtil.FindIndex(
377                mainChartSurface.renderableSeries.get(0).dataSeries.getNativeXValues(),
378                dragMeAnnotation.x1,
379                mainChartSurface.webAssemblyContext2D.SCRTFindIndexSearchMode.Nearest,
380                true
381            );
382
383            crossSectionPaletteProvider.selectedIndex = dataIndex;
384            crossSectionPaletteProvider.shouldUpdate = true;
385            mainChartSurface.invalidateElement();
386            if (crossSectionSliceSeries) {
387                crossSectionSliceSeries.clear();
388                console.log("crossSectionSliceSeries:", crossSectionSliceSeries);
389                for (let i = 0; i < mainChartSurface.renderableSeries.size(); i++) {
390                    crossSectionSliceSeries.append(
391                        i,
392                        mainChartSurface.renderableSeries.get(i).dataSeries.getNativeYValues().get(dataIndex)
393                    );
394                }
395            } else {
396                console.error("crossSectionSliceSeries is not defined");
397            }
398        };
399
400        // Run it once
401        updateDragAnnotation();
402
403        //Run it when user drags the annotation
404        dragMeAnnotation.dragDelta.subscribe((args: AnnotationDragDeltaEventArgs) => {
405            updateDragAnnotation();
406        });
407
408        mainChartSurface.renderableSeries.get(0).isSelected = true;
409    };
410
411    return { initMainChart, initCrossSectionLeft, initCrossSectionRight, configureAfterInit };
412};
413
See Also: Scientific & Medical Charts (5 Demos)

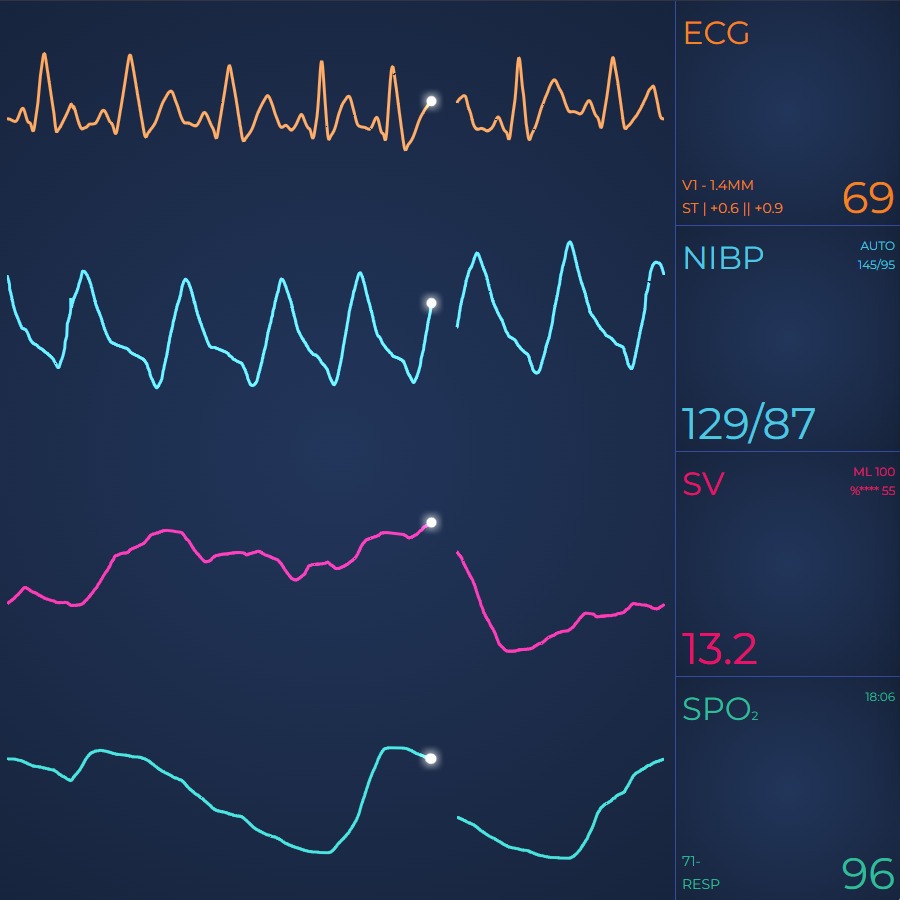
JavaScript Vital Signs ECG/EKG Medical Demo
In this example we are simulating four channels of data showing that SciChart.js can be used to draw real-time ECG/EKG charts and graphs to monitor heart reate, body temperature, blood pressure, pulse rate, SPO2 blood oxygen, volumetric flow and more.

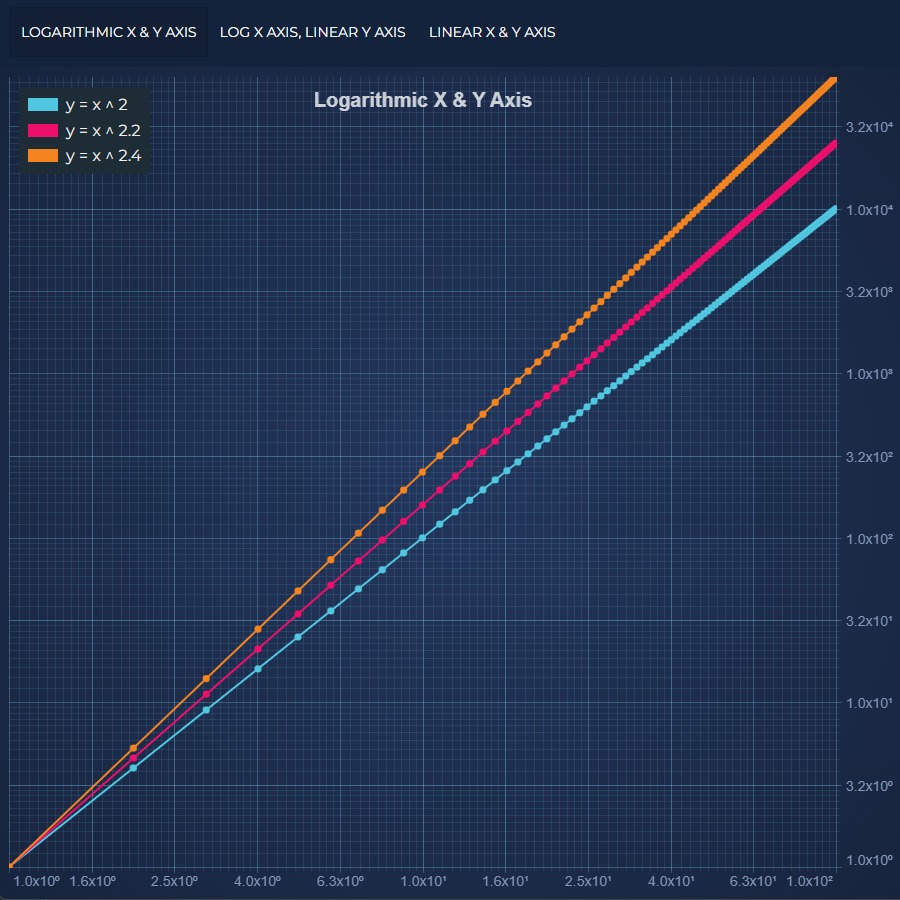
JavaScript Chart with Logarithmic Axis Example
Demonstrates Logarithmic Axis on a JavaScript Chart using SciChart.js. SciChart supports logarithmic axis with scientific or engineering notation and positive and negative values

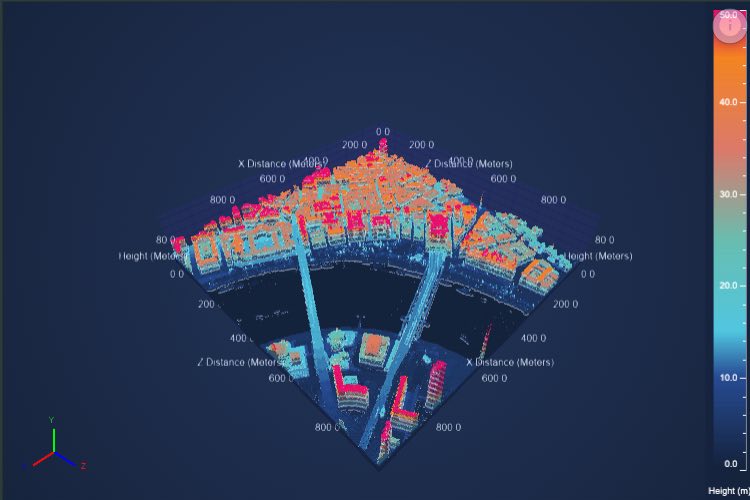
LiDAR 3D Point Cloud of Geospatial Data
Demonstrating the capability of SciChart.js to create JavaScript 3D Point Cloud charts and visualize LiDAR data from the UK Defra Survey.

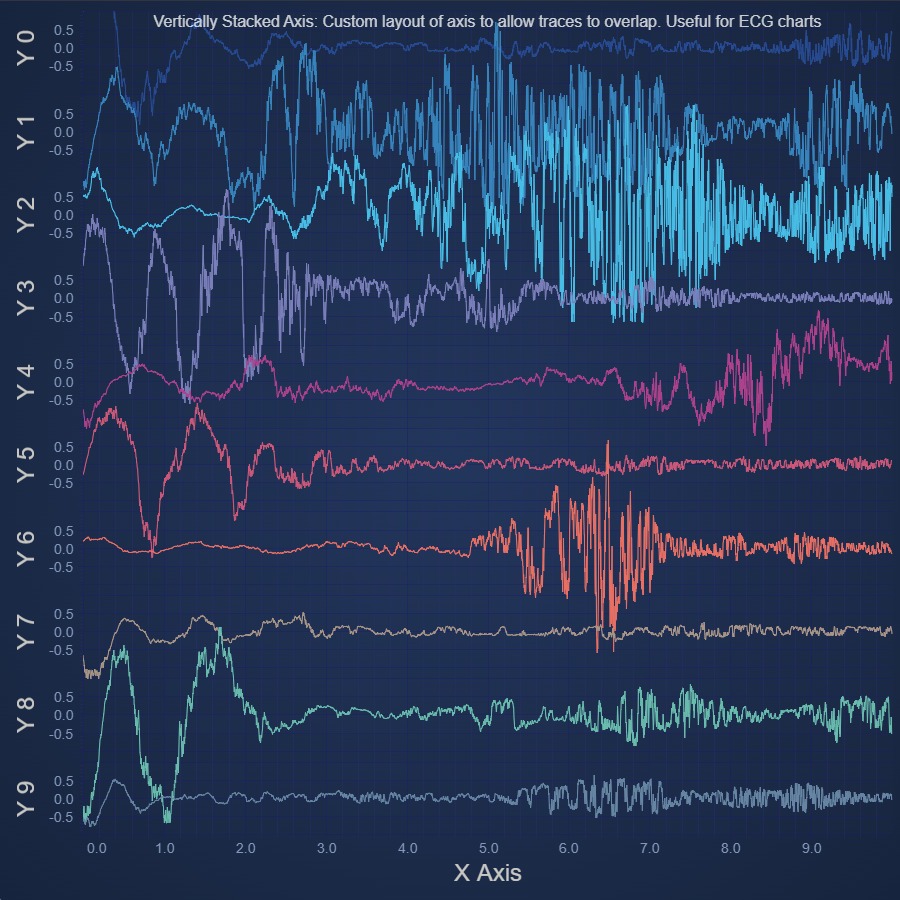
JavaScript Chart with Vertically Stacked Axes
Demonstrates Vertically Stacked Axes on a JavaScript Chart using SciChart.js, allowing data to overlap

Realtime Audio Analyzer Demo
Demonstrating the capability of SciChart.js to create a JavaScript Audio Analyzer and visualize the Fourier-Transform of an audio waveform in realtime.