Chart from JSON
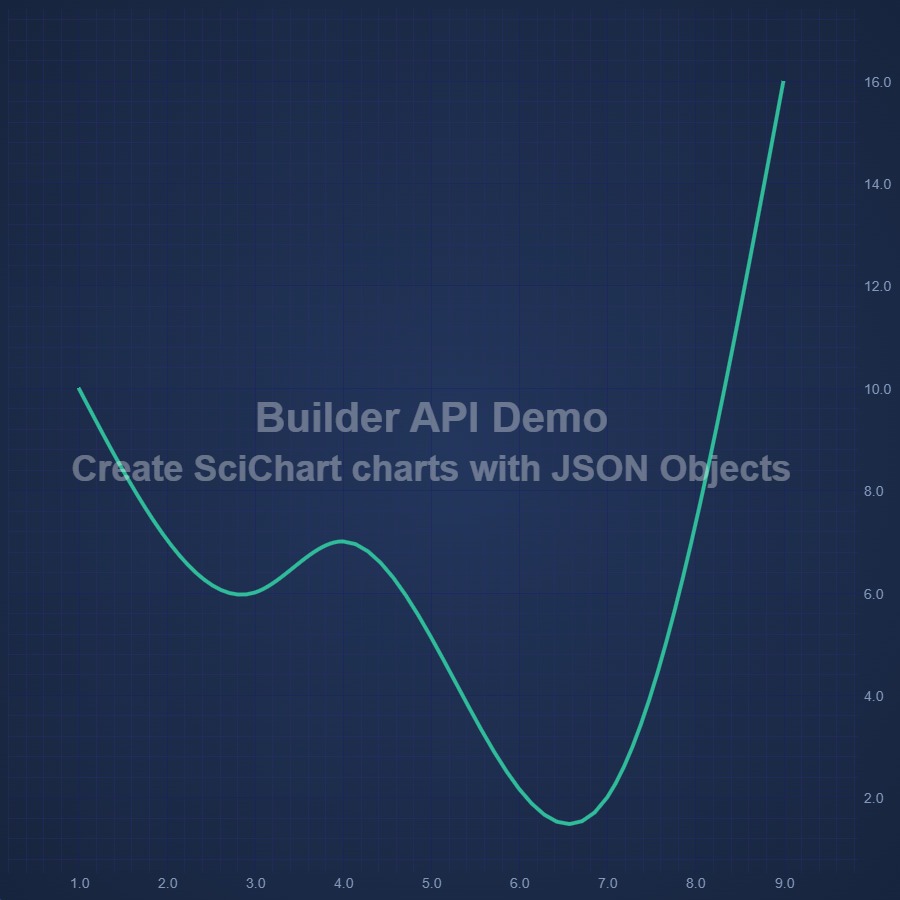
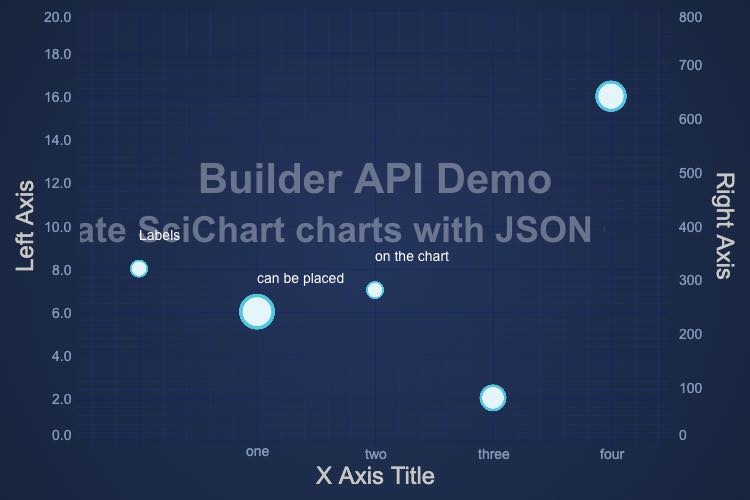
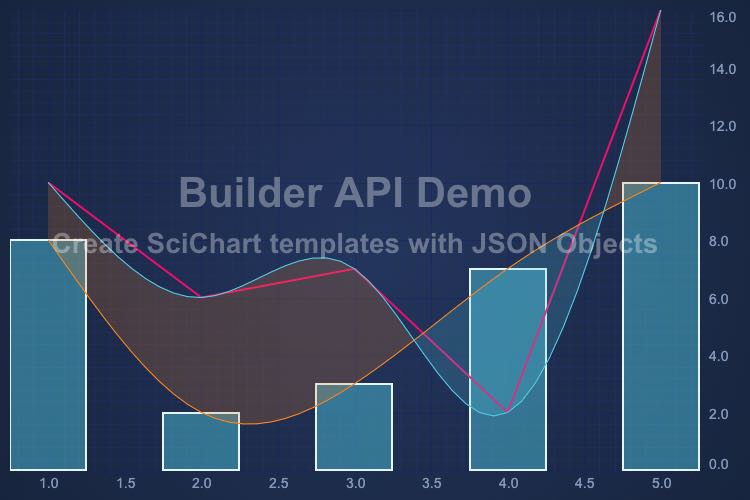
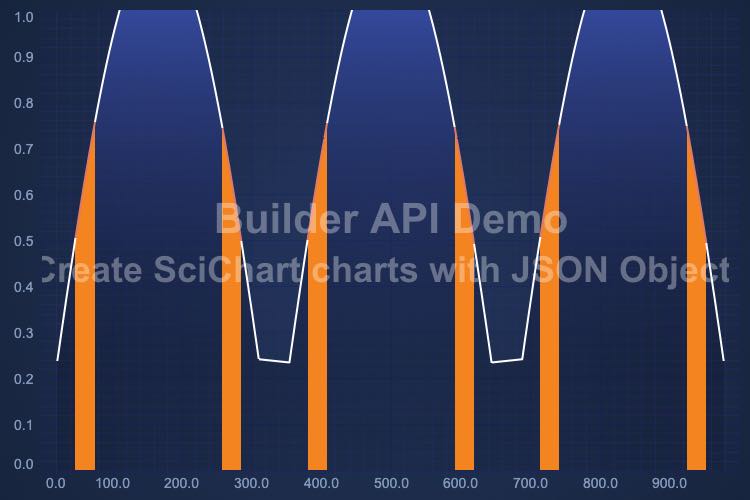
Demonstrates how to use the Builder Api to create a Chart from JSON using SciChart.js. Adjust the JSON in the window below and the chart will re-build. Choose from pre-selected defaults to learn more about the Builder API.
drawExample.ts
index.tsx
1import { SciChartSurface, chartBuilder, TWebAssemblyChart } from "scichart";
2
3export const drawExample = async (
4    divElementId: string | HTMLDivElement,
5    json: string,
6    setErrors: (error: any) => void
7) => {
8    try {
9        // Build the SciChartSurface from Json passed in
10        const { sciChartSurface, wasmContext } = await chartBuilder.build2DChart(divElementId, json);
11
12        return { sciChartSurface, wasmContext };
13    } catch (error) {
14        const msg = (error as any).message;
15        setErrors(msg);
16        return { sciChartSurface: undefined, wasmContext: undefined };
17    }
18};
19
20export const defaultJsonDefinition = `{
21    "surface": { "theme": { "type": "Navy" }},
22    "series": { "type": "SplineLineSeries",
23        "options": { "stroke": "red" },
24        "xyData": { "xValues": [1,3,4,7,9], "yValues": [10,6,7,2,16] }
25    },
26    "yAxes": { "type": "NumericAxis", "options": { "visibleRange": {"min": 0, "max": 20} } },
27    "annotations": [{
28        "type": "SVGTextAnnotation", "options": { "text": "Builder API Demo", "x1": 0.5, "y1": 0.5, "opacity": 0.33,
29              "yCoordShift": -26, "xCoordinateMode": "Relative", "yCoordinateMode": "Relative",
30              "horizontalAnchorPoint": "Center", "verticalAnchorPoint": "Center",
31              "fontSize": 36, "fontWeight": "Bold"
32            }
33        },
34        {
35            "type": "SVGTextAnnotation", "options": { "text": "Create SciChart charts from JSON", "x1": 0.5, "y1": 0.5, "opacity": 0.33,
36                "yCoordShift": 26, "xCoordinateMode": "Relative", "yCoordinateMode": "Relative",
37                "horizontalAnchorPoint": "Center", "verticalAnchorPoint": "Center",
38                "fontSize": 24, "fontWeight": "Bold"
39            }
40        }]
41}`;
42
43export const detailedJsonDefinition = `{
44            "surface": {
45                "theme": {
46                    "type": "Navy",
47                    "axisTitleColor": "#1d4e8f"
48                }
49            },
50            "xAxes": [{
51                    "type": "CategoryAxis",
52                    "options": {
53                        "axisTitle": "X Axis Title",
54                        "labelProvider": {
55                            "type": "Text",
56                            "options": {
57                                "labels": { "1": "one", "2": "two", "3": "three", "4": "four", "5": "five" }
58                            }
59                        }
60                    }
61                }
62            ],
63            "yAxes": [{
64                    "type": "NumericAxis",
65                    "options": {
66                        "axisAlignment": "Left",
67                        "axisTitle": "Left Axis",
68                        "id": "y1",
69                        "visibleRange": { "min": 0, "max": 20 },
70                        "zoomExtentsToInitialRange": true
71                    }
72                }, {
73                    "type": "NumericAxis",
74                    "options": {
75                        "axisAlignment": "Right",
76                        "axisTitle": "Right Axis",
77                        "id": "y2",
78                        "visibleRange": { "min": 0, "max": 800 },
79                        "zoomExtentsToInitialRange": true
80                    }
81                }
82            ],
83            "series": [{
84                    "type": "SplineMountainSeries",
85                    "options": {
86                        "yAxisId": "y1",
87                        "stroke": "#1d4e8f",
88                        "fillLinearGradient": {
89                            "gradientStops": [{
90                                    "color": "rgba(161, 233, 255, 1)",
91                                    "offset": 0.5
92                                }, {
93                                    "color": "rgba(0, 55, 117, 0.3)",
94                                    "offset": 1
95                                }
96                            ],
97                            "startPoint": { "x": 0, "y": 0 },
98                            "endPoint": {"x": 0, "y": 1 }
99                        }
100                    },
101                    "xyData": {
102                        "xValues": [1, 2, 3, 4, 5],
103                        "yValues": [8, 6, 7, 2, 16]
104                    }
105                }, {
106                    "type": "BubbleSeries",
107                    "options": {
108                        "pointMarker": {
109                            "type": "Ellipse",
110                            "options": {
111                                "fill": "#FFA24399",
112                                "strokeThickness": 0,
113                                "height": 100,
114                                "width": 100
115                            }
116                        },
117                        "yAxisId": "y2"
118                    },
119                    "xyzData": {
120                        "xValues": [1, 2, 3, 4, 5],
121                        "yValues": [180, 350, 490, 720, 530],
122                        "zValues": [20, 40, 20, 30, 35]
123                    }
124                }
125            ],
126            "modifiers": [
127                { "type": "Rollover", "options": { "yAxisId": "y1" } },
128                { "type": "MouseWheelZoom" },
129                { "type": "ZoomExtents" }
130            ],
131            "annotations": [{
132                    "type": "SVGTextAnnotation",
133                    "options": {
134                        "y1": 10,
135                        "text": "Annotation"
136                    }
137                }
138            ]
139        }`;
140
141const spiralX = [];
142const spiralY = [];
143for (let i = 0; i < 20; i += 0.2) {
144    spiralX.push(Math.sin(i) + Math.cos(i / 20));
145    spiralY.push(Math.cos(i) - Math.sin(i / 20));
146}
147export const centralLayoutJsonDefinition = `{
148            "surface": { "layoutManager": { "type": "CentralAxes" }, "theme": { "type": "Navy" }},
149            "series": {
150                "type": "ScatterSeries",
151                "options": { "pointMarker": { "type": "Ellipse", "options": { "fill": "white" } } },
152                "xyData": { "dataIsSortedInX": false, "xValues": [${spiralX}], "yValues": [${spiralY}] }
153            },
154            "yAxes": {
155                "type": "NumericAxis",
156                "options": { "labelPrecision": 1, "axisBorder": { "borderRight": 1, "color": "white" } }
157            },
158            "xAxes": {
159                "type": "NumericAxis",
160                "options": { "labelPrecision": 1, "axisBorder": { "borderTop": 1, "color": "white" } }
161            },
162            "modifiers": [
163                { "type": "MouseWheelZoom" },
164                { "type": "ZoomExtents" },
165                { "type": "Cursor" },
166                { "type": "ZoomPan" }
167            ]
168        }`;
169
See Also: Builder (JSON / JS Objects) API (4 Demos)

Simple Chart using Builder API
Demonstrates how to use the Builder Api to create a simple chart using a definition object. The builder api is designed to make it easier to discover the types and options available in SciChart JS.

Full Chart using Builder API
Demonstrates how to use the Builder Api to configure axes, series, annotations and modifiers using a definition object. The builder api is designed to make it easier to discover the types and options available in SciChart JS.

JavaScript Chart with Reusable Templates using Shared Data
Demonstrates how to use the Builder Api to create Reusable Chart Templates.Data can be easily integrated into a definition and shared between series

Custom Types with Builder API
Demonstrates how to make a custom type such as a PaletteProvider available for use with the Builder Api.You can call methods within the builder api to get references to the objects being built, so you can update them later.